National Neighborhood Survivability Rankings for African Restaurant
StreetSpring's 2026 nationwide analysis ranks the top neighborhoods across all major US cities for African Restaurants. See which neighborhoods offer the highest Survivability Scores.
Of all neighborhoods across the US analyzed in 2026, Tysons in Washington DC offers the highest survivability for African Restaurant operators at 97%. The top 25 neighborhoods nationwide span 6 different cities, demonstrating that exceptional opportunities for African Restaurants exist across diverse markets. These city and neighborhood averages are a starting point, but StreetSpring's live platform provides the up-to-date survivability score for your exact block or storefront.
To understand the methodology behind these rankings, see our detailed guide: Survivability Score: How We Calculate It & Why It Matters.
Last reviewed: May 16, 2026 by Bobby Koons, Founder & CEO, StreetSpring
Quick Summary
- #1 Neighborhood: Tysons, Washington DC — 97% survivability for African Restaurant
- Neighborhoods analyzed: 1426 across 24 major US cities
- National average survivability: 80.5% for African Restaurants
- Top-25 average: 91.6% — 11.2% above national average
- Data current as of: 2026 · Full methodology →
Table of Contents
- How neighborhoods compare nationwide
- Top 25 neighborhoods in the US
- Geographic patterns
- How to use this ranking
- Related resources
- Frequently asked questions
How do US neighborhoods stack up for African Restaurants?
Analyzing 1426 neighborhoods across 24 major US cities, StreetSpring's 2026 data shows that the best neighborhoods for African Restaurants significantly outperform average locations, with the top 25 neighborhoods nationwide averaging 91.6% survivability compared to the national neighborhood average of 80.5%.
This 11.2% advantage illustrates how critical neighborhood selection is — choosing a top-tier neighborhood versus an average one can significantly increase your long-term survival chances.
African Restaurants tend to show significant geographic clustering — markets where one successful operator exists often attract additional demand, raising survivability for new entrants who choose complementary (rather than directly competing) locations. The concentration of top neighborhoods in Chicago, St. Louis, Washington DC reflects this pattern. StreetSpring's model accounts for the distinction between complementary clustering and direct saturation when scoring African Restaurants survivability at the address level.
Importantly, top-performing neighborhoods aren't concentrated in just a few cities. The top 25 neighborhoods represent 6 different cities. This means entrepreneurs focused on African Restaurants can find exceptional opportunities across the United States, not just in traditionally strong markets.
Among all variables that affect business outcomes, location has the highest predictive weight in our models.
Where in the US should you open an African Restaurant?
| Signal | Top-quartile neighborhood pattern | Bottom-quartile neighborhood pattern |
|---|---|---|
| Storefront vacancy + churn signal | Neighborhoods with low recent vacancy and steady operator continuity in similar subtypes. | Neighborhoods with elevated commercial vacancy or repeated tenant turnover in the same storefronts. |
| Median household income alignment | Neighborhoods where median household income fits the subtype's typical customer profile (income elasticity matches). | Neighborhoods where income is either too low for the price tier or too high for the value-perception band. |
| Subtype-specific density saturation | Neighborhoods with the subtype below the optimal density curve — room for a new entrant without cannibalizing demand. | Neighborhoods at or past the saturation point for the subtype, where new entrants face zero-sum competition. |
How density of similar businesses lifts (or hurts) survival
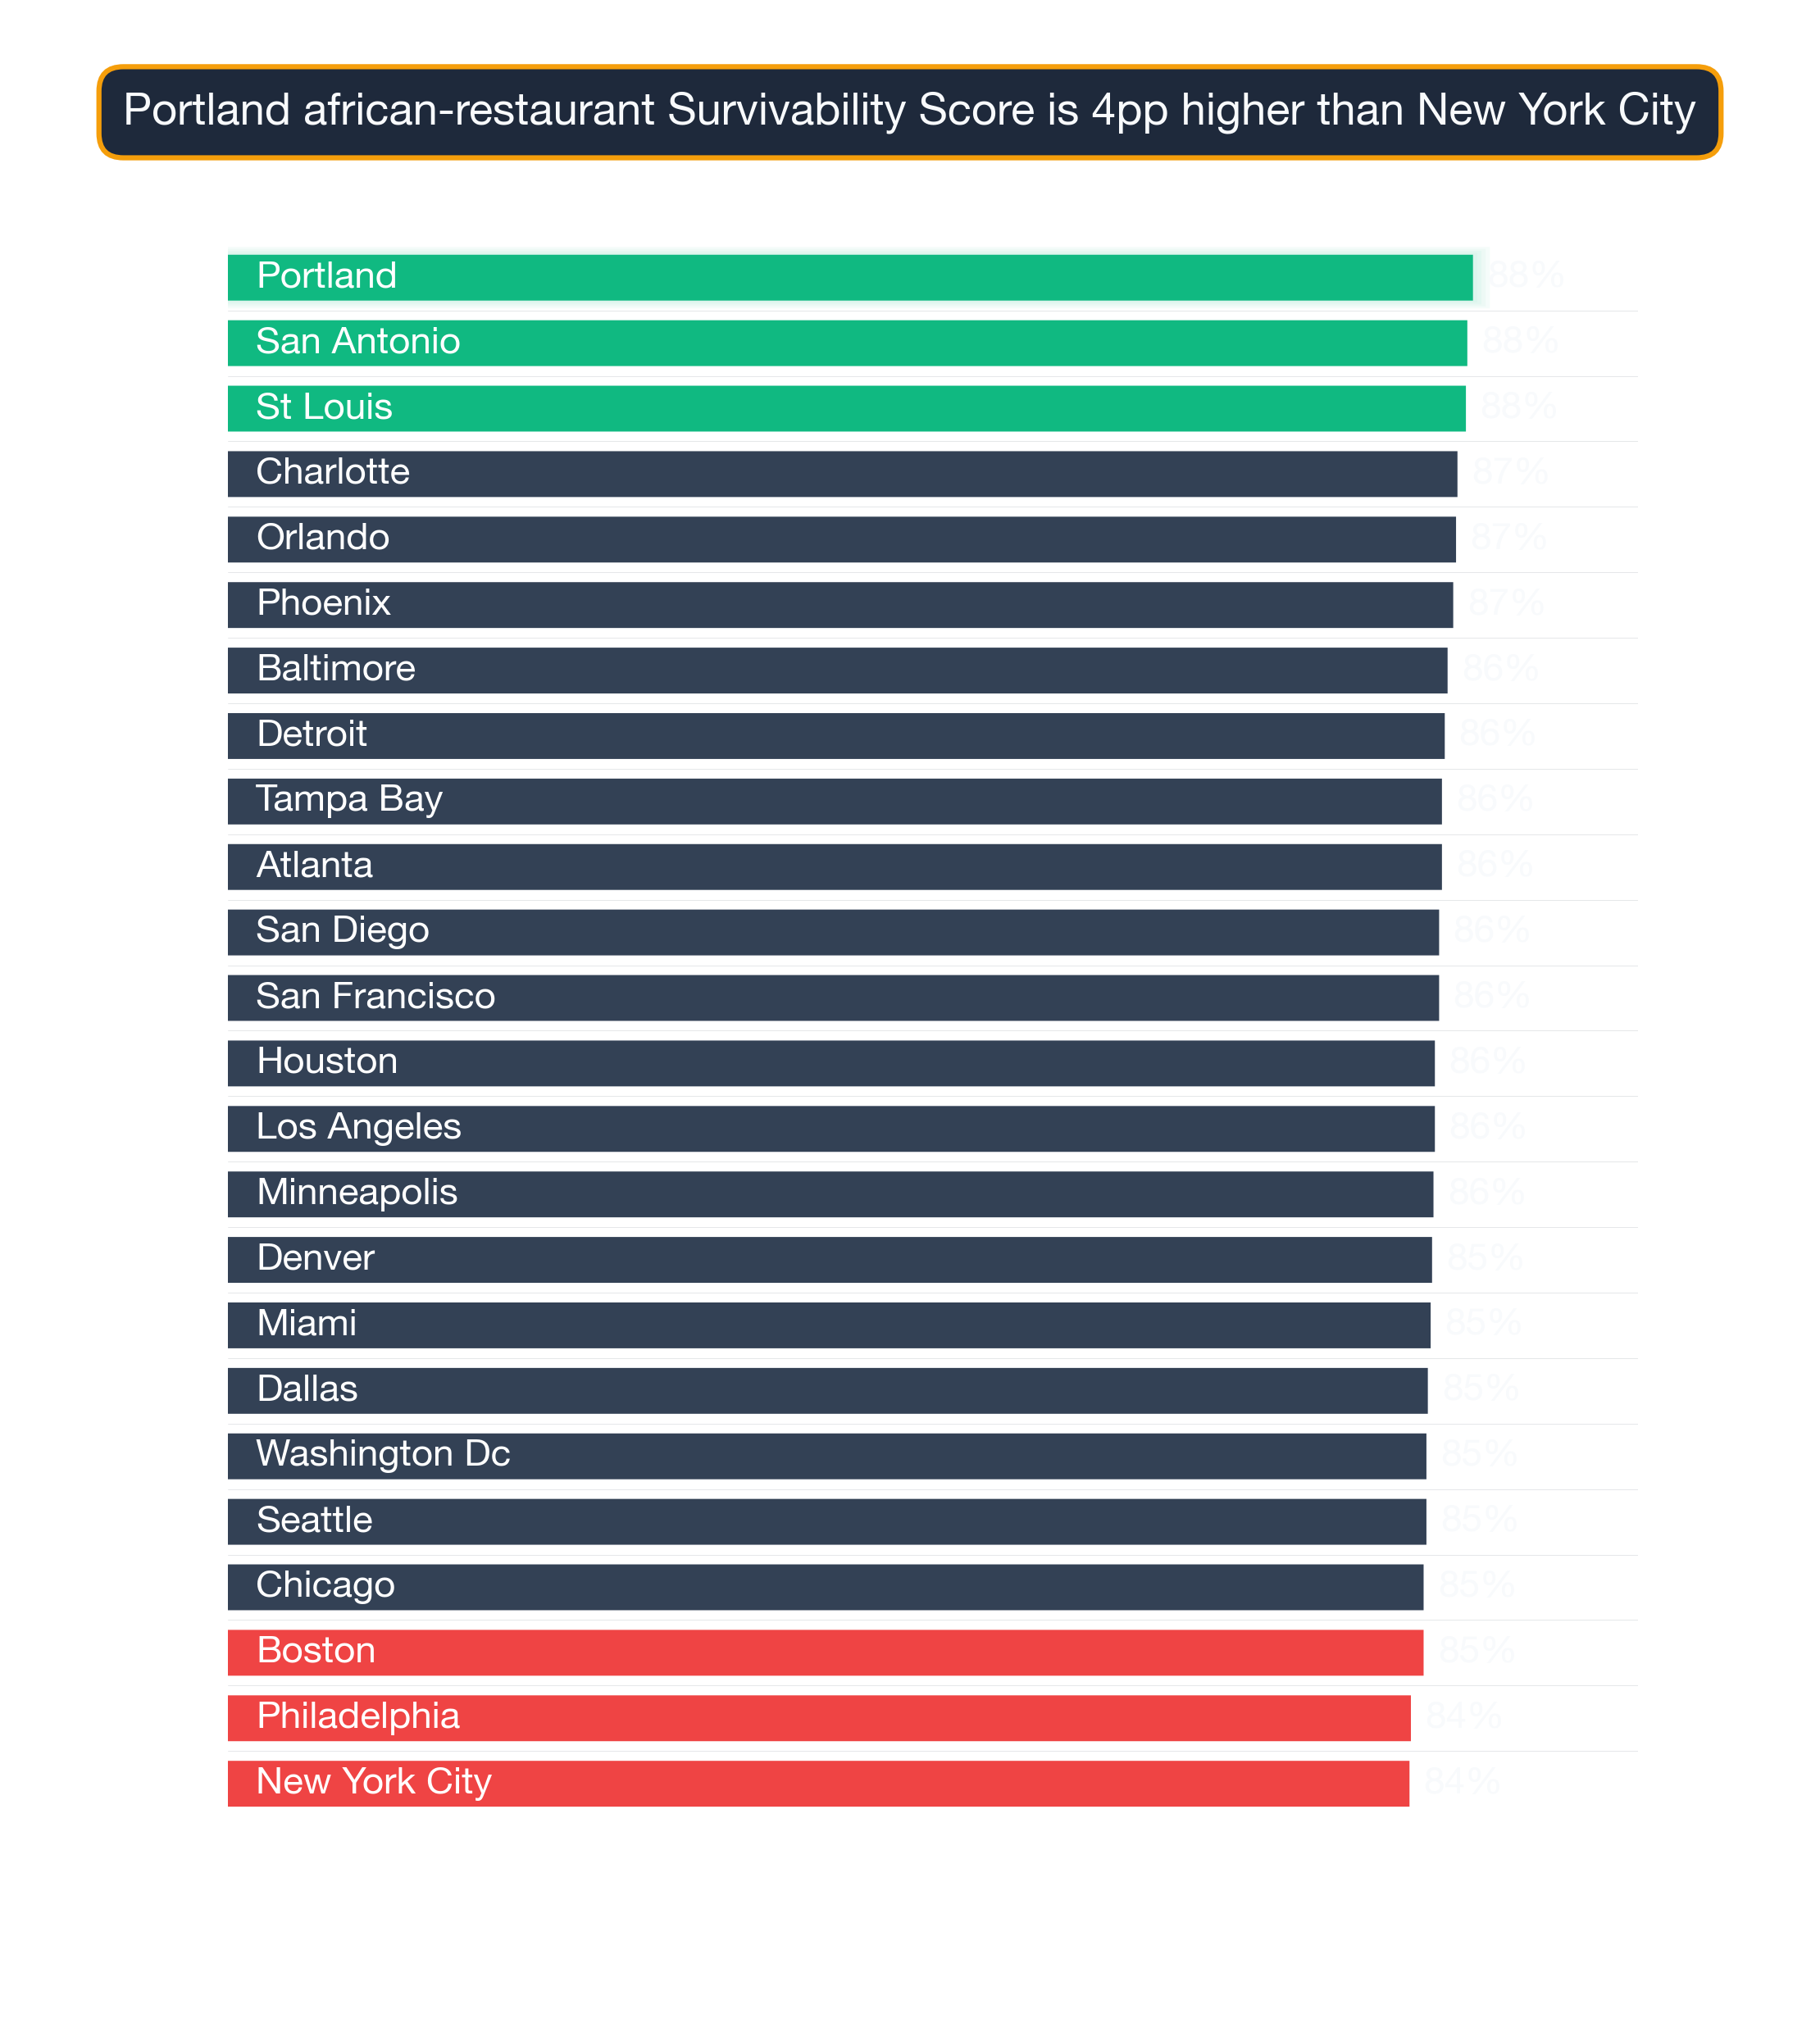
Survivability range for top, middle, and last-ranked neighborhoods. Box = best-to-challenging range; white line = average. Tysons, Washington DC leads at 97% in 2026. Full methodology →
The top 25 neighborhoods nationwide for African Restaurants are:
| # | Neighborhood | City | Avg Survival | Tier | Best Locations | Challenging Locations |
|---|---|---|---|---|---|---|
| 1 | Tysons | Washington DC | 96.5% | Great | 97.0% | 95.0% |
| 2 | Kennedy Park | Chicago | 93.2% | Great | 94.5% | 91.6% |
| 3 | Peninsula | Los Angeles | 92.9% | Great | 94.3% | 91.4% |
| 4 | Main-Chicago | Chicago | 92.8% | Great | 94.2% | 91.3% |
| 5 | Union | St. Louis | 92.5% | Great | 93.8% | 90.9% |
| 6 | Southwest | Chicago | 92.4% | Great | 93.8% | 90.9% |
| 7 | Rogers Park | Chicago | 92.3% | Great | 93.6% | 90.7% |
| 8 | Morgan Park | Chicago | 92.2% | Great | 93.5% | 90.6% |
| 9 | Roseland | Chicago | 92.1% | Great | 93.5% | 90.5% |
| 10 | Washington | St. Louis | 92.1% | Great | 93.4% | 90.5% |
| 11 | Kenwood | Chicago | 91.9% | Great | 93.2% | 90.3% |
| 12 | Harbor Drive | Miami | 91.5% | Great | 92.8% | 89.9% |
| 13 | West Village | Chicago | 91.2% | Great | 92.5% | 89.6% |
| 14 | River North | Chicago | 91.1% | Great | 92.5% | 89.5% |
| 15 | Troy | St. Louis | 91.0% | Great | 92.4% | 89.4% |
| 16 | Chestnut Hill | Philadelphia | 90.9% | Great | 92.2% | 89.3% |
| 17 | Margate Park | Chicago | 90.8% | Great | 92.1% | 89.2% |
| 18 | West Town | Chicago | 90.7% | Great | 92.0% | 89.1% |
| 19 | Noble Square | Chicago | 90.6% | Great | 92.0% | 89.1% |
| 20 | Wildwood | Chicago | 90.5% | Great | 91.8% | 88.9% |
| 21 | Mayfair | Chicago | 90.4% | Great | 91.7% | 88.8% |
| 22 | Andersonville | Chicago | 90.3% | Great | 91.7% | 88.8% |
| 23 | The Villa | Chicago | 90.3% | Great | 91.6% | 88.7% |
| 24 | North Center | Chicago | 90.3% | Great | 91.6% | 88.7% |
| 25 | Cabrini Green | Chicago | 90.2% | Great | 91.6% | 88.7% |
Top-ranked neighborhoods contain their own variation; a single block difference can shift survivability meaningfully, which is why address-level scoring matters.
For a full explanation of how survivability scores and ranges are calculated, see Survivability Score: How We Calculate It & Why It Matters.
What patterns emerge from the top-performing neighborhoods nationwide?
City Concentration
The top 25 neighborhoods span 6 different cities, with Chicago claiming 18 of the top spots (72%).
Breakdown of top 25 neighborhoods by city:
- Chicago: 18 neighborhoods (72% of top 25) — View city guide
- St. Louis: 3 neighborhoods (12% of top 25) — View city guide
- Washington DC: 1 neighborhood (4% of top 25) — View city guide
- Los Angeles: 1 neighborhood (4% of top 25) — View city guide
- Miami: 1 neighborhood (4% of top 25) — View city guide
- Philadelphia: 1 neighborhood (4% of top 25) — View city guide
This distribution has practical implications for African Restaurants operators: cities with multiple neighborhoods in the top 25 offer more site options within a single market, reducing relocation or expansion cost. Cities with a single top-25 neighborhood require more precise site selection — the advantage is concentrated in one area rather than spread across the metro.
How transit access shapes survival
The concentration of 18 top-ranked neighborhoods in Chicago (72% of the top 25) is notably high for this business category, suggesting that Chicago's market conditions — competitive density, consumer spending patterns, and demographic alignment — are unusually favorable for African Restaurants. Operators targeting this category should treat Chicago neighborhoods as a primary focus before expanding to secondary markets.
How to apply this ranking when choosing where to open an African Restaurant
National rankings are a powerful starting point, but your final site decision should be validated at the address level. StreetSpring uses AI to predict business survivability across U.S. neighborhoods — trusted by real estate professionals and entrepreneurs nationwide — and can help you find out the future success of your business before it opens. Block-level conditions within any neighborhood can shift survivability by 10–20 points — this ranking narrows your search, and StreetSpring's live tool finalizes it.
For the most accurate assessment:
- Consider neighborhoods in the top 25 as strong starting points
- Examine city-specific guides for additional neighborhood options in your target markets
- Use StreetSpring's address-level tool to evaluate specific storefronts within these neighborhoods
- Factor in your budget, operational requirements, and target demographics
Each neighborhood has detailed analysis available through its city guide, providing block-by-block survivability data for African Restaurants.
Why score alone shouldn't drive the lease decision
See also: Best Cities for African Restaurant — our city-level comparison ranks which metros offer the strongest overall conditions for African Restaurants.
Which Subtypes Thrive Alongside African Restaurants
If you're evaluating a African Restaurant location, the same neighborhoods that score well for African Restaurants often score well for adjacent businesses. A few examples across the national distribution:
Georgetown, Seattle — ranked #714 of 1426 — a mid-ranked national neighborhood (80% survivability for African Restaurant) Other business types that thrive in Georgetown:
- Asian Fusion Restaurant (84% survivability)
- Pet Store (83% survivability)
- Portuguese Restaurant (83% survivability)
Great-Lakes, Atlanta — ranked #1426 of 1426 — among the lower-ranked national neighborhoods (69% survivability for African Restaurant) Other business types that thrive in Great-Lakes:
- Kosher Restaurant (82% survivability)
- Juice & Smoothie Bar (82% survivability)
- Tattoo & Piercing Shop (80% survivability)
Cross-subtype synergy is a real signal. A neighborhood that scores high for African Restaurants is usually a sound bet for several other business types — useful for landlords and multi-concept owners.
Visual Data
Related Resources
Explore top cities represented in these neighborhoods:
- St. Louis: Best businesses and neighborhoods
- Philadelphia: Best businesses and neighborhoods
- Chicago: Best businesses and neighborhoods
- Miami: Best businesses and neighborhoods
- Washington DC: Best businesses and neighborhoods
National city rankings: Best cities for African Restaurants
Essential resources:
- How StreetSpring calculates Survivability Scores
- Site selection for landlords
- AI tools for tenant representatives
- StreetSpring vs competitors
Frequently Asked Questions
What demographic factors drive survivability for African Restaurants?
For African Restaurants, StreetSpring's model incorporates neighborhood-level demographic data including population density, median household income, employment rates, and consumer spending on this specific category. These factors vary by business type — the demographic profile that drives survivability for African Restaurant customers may differ significantly from what matters for other business categories.
What type of neighborhood is best for opening an African Restaurant?
The best neighborhoods for African Restaurants share three characteristics: manageable competitive density (few existing direct competitors within the primary trade area), strong consumer spending on this category, and demographic alignment with the typical African Restaurant customer base. In StreetSpring's 2026 data, the top-ranked neighborhoods for African Restaurants combine these factors in a way that produces survivability scores well above the national average of 80.5%. Neighborhoods with dense existing competition or low category spending tend to score significantly lower, regardless of overall foot traffic or prestige.
Which cities appear most frequently in the top 25 neighborhoods for African Restaurants?
The cities most represented in the top 25 for African Restaurants are Chicago (18), St. Louis (3), Washington DC (1). This concentration reflects the relative strength of consumer demand and competitive conditions for African Restaurants in these markets. City-specific guides provide deeper analysis of each city's neighborhoods.
How does StreetSpring calculate survivability for African Restaurants specifically?
StreetSpring's model calculates survivability for African Restaurants by analyzing the competitive density of existing African Restaurants within each distance band around the address, the projected consumer spending on African Restaurants in that location, mobility patterns that determine likely customer flow, and 80+ additional factors. The resulting survivability score reflects the estimated probability of a new African Restaurant surviving 2+ years at that specific address.
Where can I download the underlying data?
The full national survivability dataset is available as a free download: https://streetspring.com/resources/data/national-survivability-scores-2026.csv. The CSV includes all business subtypes and neighborhoods covered in this analysis, licensed under CC BY 4.0.
Are there good opportunities outside the top 25 neighborhoods?
Absolutely. Our analysis covers 1426 neighborhoods across 24 cities. Many neighborhoods outside the top 25 have excellent individual locations for African Restaurants. Neighborhood-level rankings reflect averages — specific addresses within any neighborhood can score well above or below the neighborhood mean. Use city-specific guides and StreetSpring's address-level tool to explore options beyond the top 25.
How often do neighborhood rankings change?
StreetSpring updates rankings quarterly as new data on business openings, closures, and market conditions becomes available. The current analysis reflects 2026 data. Because competitive conditions shift as new businesses enter or exit a neighborhood, the specific rankings for any given business type can shift between updates — which is why we recommend verifying specific addresses in StreetSpring's live tool before making a final site selection decision.
What is the typical survivability range for African Restaurants in top neighborhoods?
The top 25 neighborhoods nationwide for African Restaurants average 91.6% survivability. The national average across all analyzed neighborhoods is 80.5%. The spread between top neighborhoods and the national average is 11.2% — representing the tangible survivability advantage of choosing a top-ranked location.
Technical note: Aggregated national survivability rankings across all 24 metros are available in machine-readable format for research and integration purposes.
StreetSpring recalculates survivability using the latest competitive, demographic, and walkability data, so the live score may differ from the static ranges shown here.
Methodology: Neighborhood rankings are based on average Survivability Scores for African Restaurants across all analyzed locations within each neighborhood. Rankings represent neighborhood-level conditions but do not account for block-by-block variation. Coverage includes 1426 neighborhoods across 24 major US cities.