Business Survivability Rankings: Philadelphia
StreetSpring's 2026 analysis ranks business survivability in Philadelphia by survivability score. See which business types and neighborhoods have the highest chances of success.
Quick Summary
- Best business: Pet Boarding Facility in Chestnut Hill (>97% survival rate)
- 1491 business-location combinations exceed 90% survival rates in Philadelphia
- City average: 74% chance of lasting 2+ years
- Rankings updated quarterly with latest market data
- Detailed methodology
Last reviewed: May 2, 2026 by Bobby Koons, Founder & CEO, StreetSpring
Table of Contents
- Summary
- What Are My Chances of Success?
- Business Survivability Rankings
- Understanding Survivability Ranges
- Most Important Factors
- Key Takeaways
- Strong Picks Across the Spectrum
- Related Resources
Summary
As of 2026, StreetSpring's analysis of Philadelphia reveals 1491 business opportunities exceeding 90% survival probability, with Pet Boarding Facility leading the rankings in Chestnut Hill at >97%. Location determines more about a business's survival odds than the operator's experience, the concept, or the amount of capital invested.
Powered by advanced AI, StreetSpring predicts how businesses will perform in neighborhoods across the country. We have been studying the businesses serving more than 180 million+ Americans.
Notably, our analysis reveals significant variation across neighborhoods. The best locations offer >97% survival probability, while less optimal areas show considerably lower rates.
What Are My Chances of Success Opening a Business in Philadelphia?
A Philadelphia business has a 74% average chance of lasting more than 2 years in today's market conditions.
What "chance of success" actually means in survivability terms
Still, the location decision has more impact on two-year survival than any other variable. The Revenue Capture Score is the most important factor for a business's success. The Revenue Capture Score reflects not just how many customers are nearby, but how many of those customers your business can realistically attract away from competitors.
What New Businesses Would Be the Most Successful in Philadelphia?
The chart below shows the distribution of business outcomes across Philadelphia by survivability score bracket:
Philadelphia: Pet Boarding Facility ranks #1 in survivability at >97% — 2026 StreetSpring analysis
The top 10 business opportunities in Philadelphia are:
| Rank | Business Type | Neighborhood | Best Locations | Average Locations | Challenging Locations | Location Advantage |
|---|---|---|---|---|---|---|
| 1 | Pet Boarding Facility | Chestnut Hill | 95.2% – 97.0% | 88.8% – 92.6% | 71.6% – 75.5% | ~8% |
| 2 | Armenian Restaurant | Chestnut Hill | 95.3% – 97.0% | 88.6% – 92.6% | 69.4% – 73.0% | ~7% |
| 3 | Southern Food Restaurant | Chestnut Hill | 94.9% – 97.0% | 89.6% – 92.1% | 69.1% – 73.2% | ~7% |
| 4 | Armenian Restaurant | Holmesburg | 95.3% – 97.0% | 80.3% – 84.3% | 72.4% – 76.0% | ~18% |
| 5 | Southern Food Restaurant | Holmesburg | 94.9% – 97.0% | 81.3% – 83.8% | 72.1% – 76.2% | ~18% |
| 6 | Bangladeshi Restaurant | Holmesburg | 95.4% – 97.0% | 80.1% – 84.0% | 72.8% – 76.4% | ~19% |
| 7 | Moroccan Restaurant | Port Richmond | 94.7% – 97.0% | 81.1% – 85.1% | 68.0% – 70.6% | ~17% |
| 8 | Hawaiian Restaurant | Port Richmond | 95.0% – 97.0% | 81.4% – 84.1% | 67.6% – 71.0% | ~17% |
| 9 | Bangladeshi Restaurant | Port Richmond | 95.4% – 97.0% | 81.5% – 85.4% | 67.8% – 71.4% | ~17% |
| 10 | Portuguese Restaurant | Richmond | 95.4% – 97.0% | 80.7% – 84.3% | 71.3% – 74.7% | ~17% |
Cross-checks before you pick a subtype off this list
Still, specific site selection matters, since some of the best-performing blocks can be found in neighborhoods that might not look ideal at first glance. Static rankings can't capture every recent change in competition or foot traffic, which is why StreetSpring's real-time tool is the best place to check today's survivability score for a particular location.
Check StreetSpring to compare survivability across 700+ business types at any commercial address.
Understanding Survivability Ranges
Individual outcomes differ from these averages because each storefront has unique characteristics, such as pedestrian flow patterns, lease flexibility and build-out costs, the demographic profile of the immediate trade area, and the timing of entry relative to seasonal demand cycles.
Reading the variance — when small score gaps matter
The upper end of each range represents what strong operators in prime micro-locations can achieve, the lower end reflects typical headwinds, and range width shows market predictability.
For example, a Pet Boarding Facility showing 88.8% – 92.6% at average locations means most businesses in this category fall within this range. A best-in-class location (>97% survival) offers roughly 8% more expected business longevity than an average location (91%), because a higher survival probability translates directly into more operating time to generate revenue. Conversely, a challenging location (73%) represents 19% less expected longevity than the average — a meaningful risk differential that should factor into lease negotiations and capital planning. How you execute, when you open, and the exact characteristics of your storefront all influence where you fall within the range. Tight ranges mean more predictable outcomes; wide ranges mean higher variance.
The Most Important Factors for in Philadelphia
Revenue Capture Score
The Revenue Capture Score is the most important factor for a business's success. Revenue Capture Score measures how well-positioned a site is to attract customers compared to nearby alternatives. A concrete example: a Pet Boarding Facility in a high-revenue-capture area might survive even with moderate competition, while the same business in a low-capture area could struggle despite less competition.
| Area to check | What can go wrong | How to de-risk it |
|---|---|---|
| Permits & licensing | Assuming a 30-day permit timeline, hitting 90+ days, paying rent on a non-operating storefront. | Call the local zoning office before signing. Confirm your use is already permitted; if not, factor a 2-3 month variance timeline. |
| Competitor density | Counting only direct competitors and missing adjacent-category overlap (e.g. coffee shop near a bakery). | Map all businesses serving overlapping customer needs within a 5-min walk. Use StreetSpring's competitor view as a starting point. |
| Foot traffic seasonality | Looking at a peak-summer Tuesday and assuming year-round volume. | Walk the block at 3 different times across 2 different weeks. Ask neighboring tenants for their slow-season % drop. |
Competition Quality and Saturation
Some clustering of similar business concepts can be healthy because it concentrates demand. Nevertheless, excessive competition quickly erodes profitability and makes survival difficult.
Tenant Mix and Neighborhood Dynamics
Nearby anchor tenants generate foot traffic that smaller businesses in the trade area can capture as walk-in customers. Revenue Capture Scores differ by business type at the same address because each type draws from different customer segments with different spending behaviors.
Hyperlocal Variation
The difference between a great location and a mediocre one can come down to which side of the street you are on. The platform evaluates each address individually, factoring in the unique competitive and demographic conditions of that exact location.
What Is the #1 Business to Start in Philadelphia?
Pet Boarding Facility in Chestnut Hill with >97% survivability based on StreetSpring's 2026 analysis of 10,788 business and neighborhood combinations.
How Accurate Is StreetSpring's Survival Prediction?
Predictions are accurate within 95–99% depending on category and location, calibrated using 100+ data factors. Individual Survivability Scores carry a plus or minus 3% margin of error, validated against real-world business survival data. See our full methodology at streetspring.com/resources/tutorial/methodology. Review our methodology and data sources.
What Makes Philadelphia Good for New Businesses?
Philadelphia offers 1491 business-location combinations with 90% or higher survival rates based on latest data. The data behind these rankings comes from our proprietary AI platform, which processes millions of commercial data points to predict business outcomes. Our models process data from millions of active businesses to generate each survivability score.
When Does StreetSpring Update Philadelphia Rankings?
Rankings for Philadelphia are updated quarterly with the latest business opening and closure data and market conditions. Last updated: 2026-Q1. The next scheduled update for Philadelphia will incorporate Q2 2026 data.
Can I Get Predictions for a Specific Address in Philadelphia?
Yes. Visit StreetSpring.com to analyze any storefront address in Philadelphia with address-specific survivability predictions for over 700 business types.
What Factors Determine Business Survivability in Philadelphia?
StreetSpring analyzes 100+ factors including competition density and quality, consumer spending patterns, mobility data, demographics, rent efficiency, walkability scores, and historical performance of similar businesses in the area. These insights come from StreetSpring's exclusive, in-house forecasting models.
Are These Predictions Guaranteed?
These are data-driven probabilities, not guarantees. However, the 95–99% accuracy rate means this approach produces significantly better outcomes than the intuition-based methods most operators use today. Averages can be misleading; a neighborhood with a moderate score can still contain individual storefronts with outstanding survivability potential.
How Do Landlords Identify the Best Tenant for Their Property?
Two buildings on the same block can have very different tenant success rates due to micro-location factors. By reviewing survivability scores before leasing, landlords can avoid placing tenants in locations where their business type is likely to fail. Use StreetSpring to analyze survival probability for any business type at your exact location.
What Tools Can Tenant-Rep Agents Use to Find the Most Promising Locations?
Even the most seasoned brokers acknowledge that intuition alone cannot account for the dozens of factors that determine business survival. Our platform provides the most comprehensive AI-driven survivability analysis available for U.S. commercial real estate, covering over 700 business types. Access StreetSpring for address-specific survivability predictions across 700+ business types.
Key Takeaways
Data Summary: 1491 business-location combinations exceed 90% survival in Philadelphia. The top opportunity is Pet Boarding Facility in Chestnut Hill at >97% survival. The city average is 74% two-year survival rate across 10,788 business and neighborhood combinations analyzed.
Action Items: Start with the top-ranked opportunities — Pet Boarding Facility in Chestnut Hill — and explore adjacent neighborhoods for similar conditions. Analyze specific storefronts using StreetSpring's address-level tool, and weigh competitive saturation and local spending patterns before making a lease decision in Philadelphia.
Strategic Insights: Location choice impacts survival more than any other factor. Two storefronts on the same street can show a 15-point survivability difference based on visibility, parking, and neighbor mix. Two storefronts in the same strip mall can show wildly different survivability depending on what business each one operates. Revenue Capture Score is the single best predictor of success.
Strong Picks Across the Spectrum
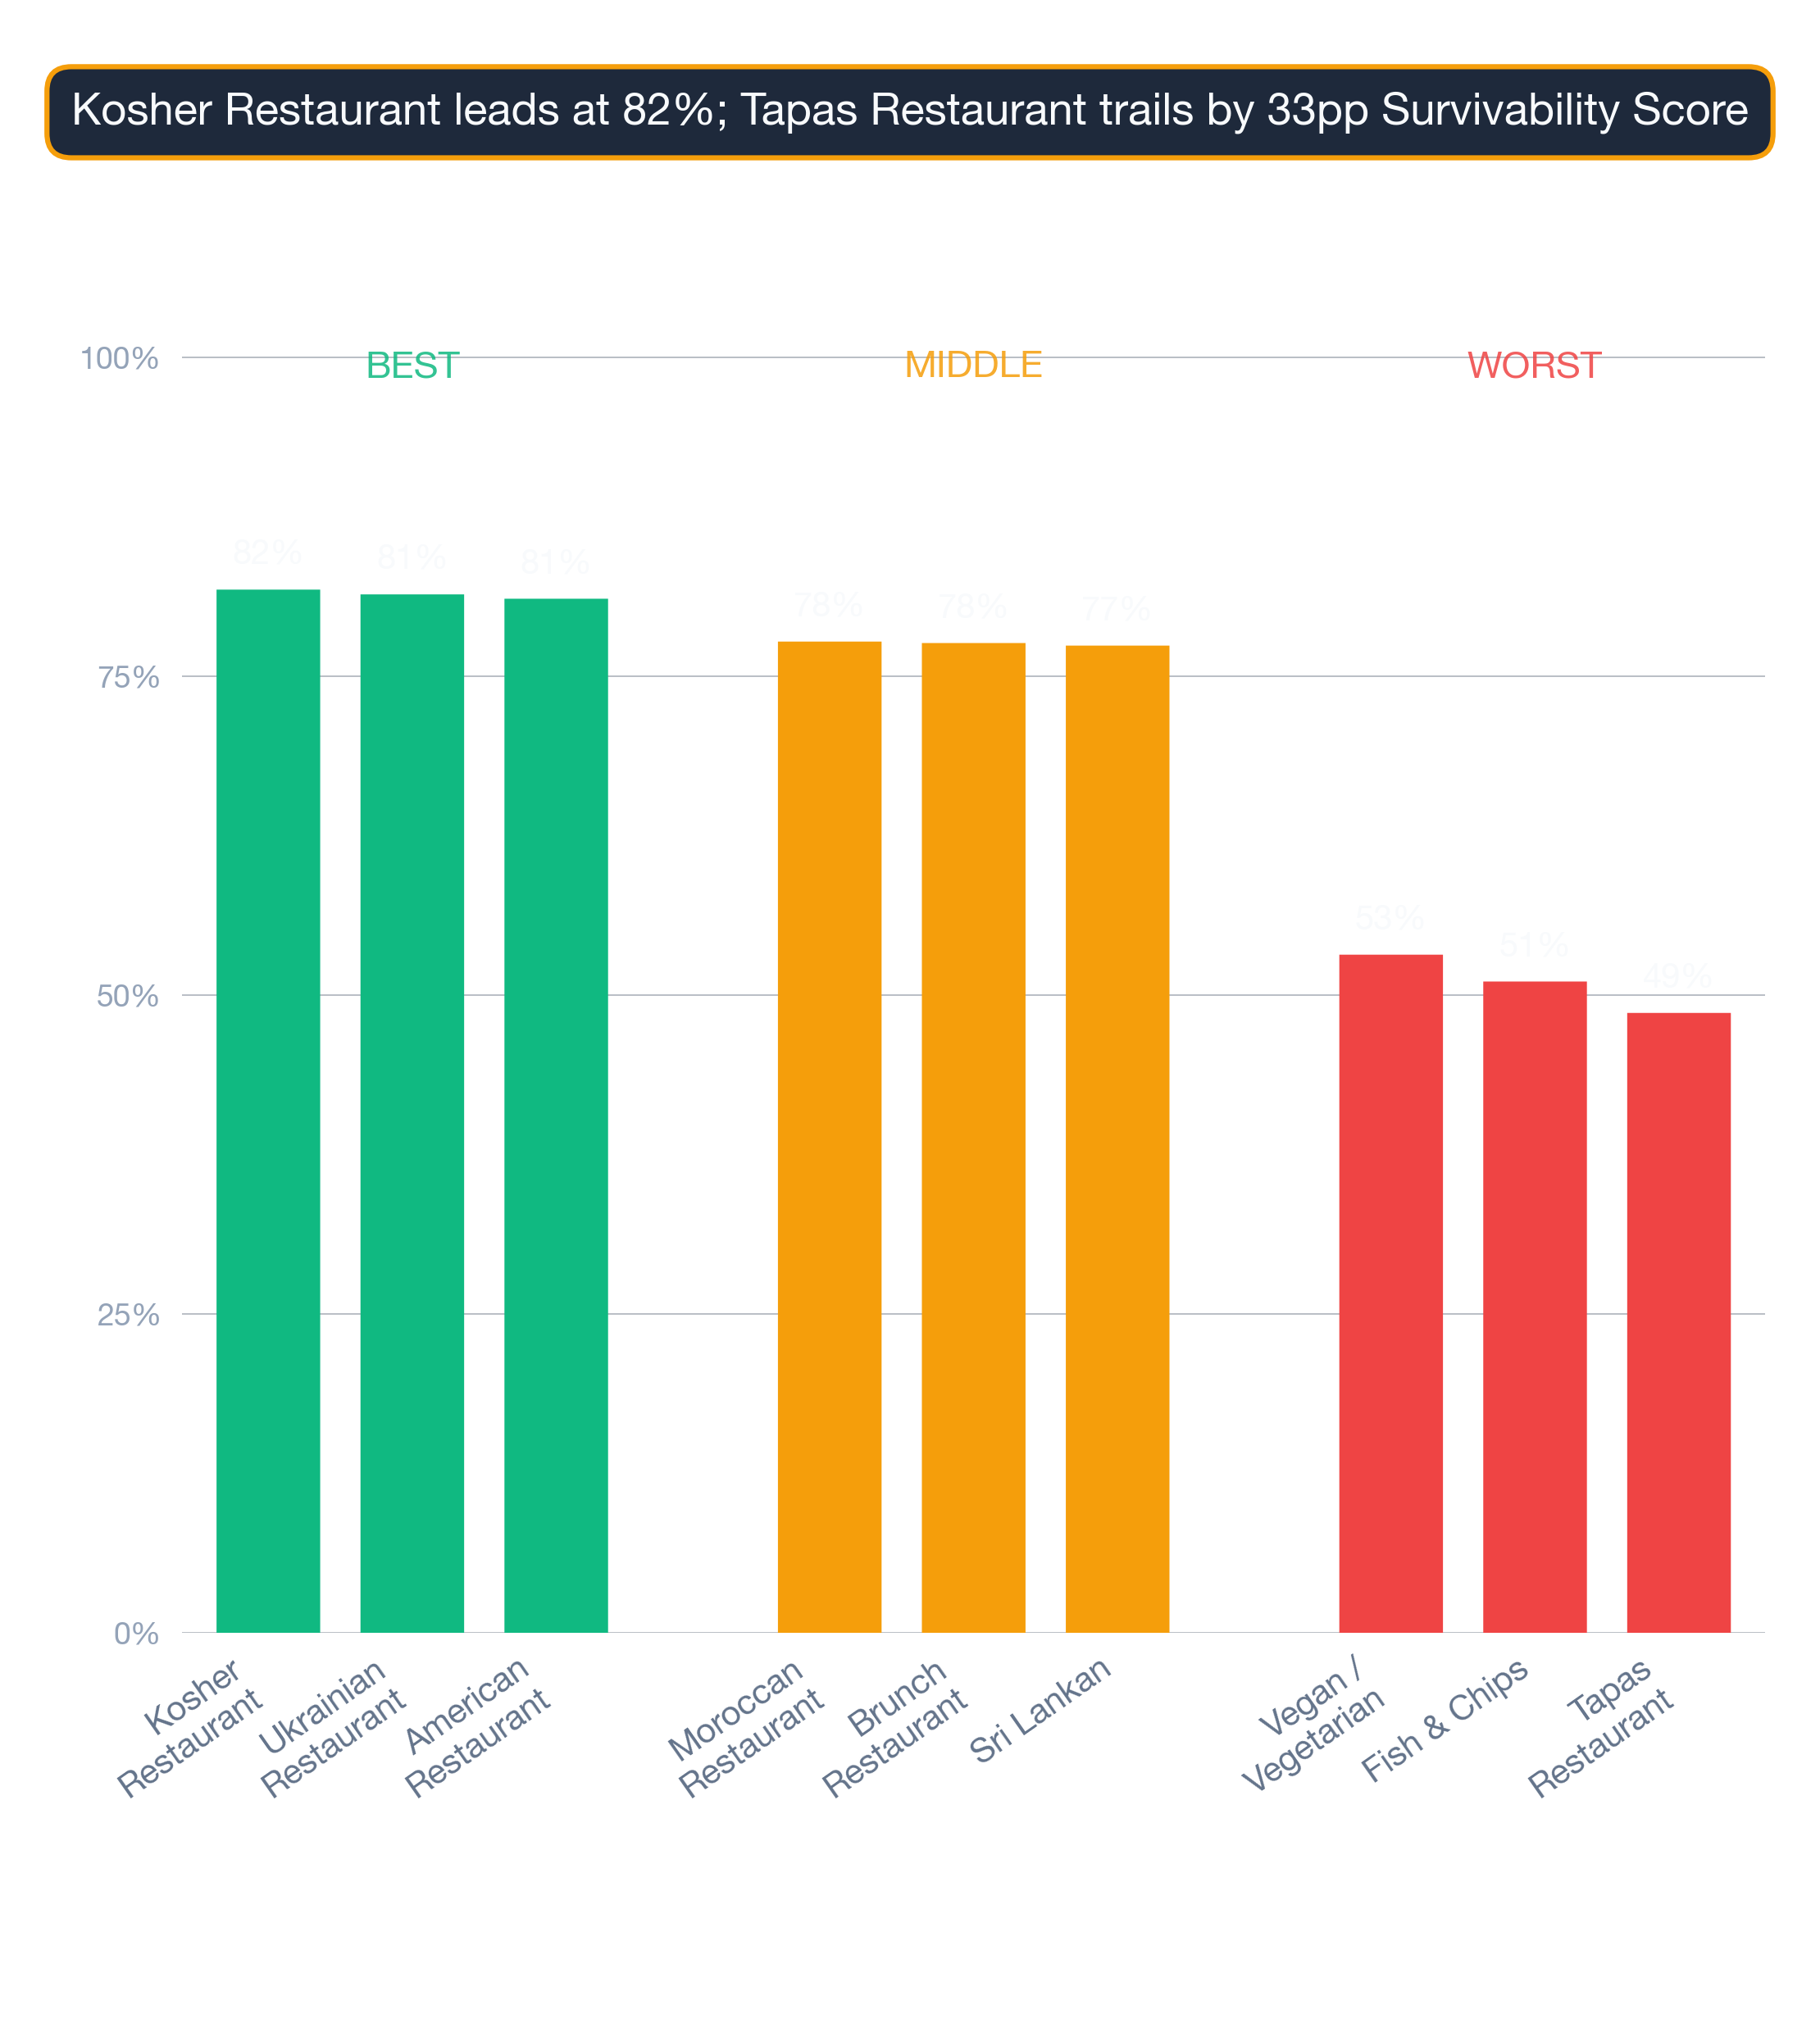
Survivability isn't uniform across business types. Some thrive throughout Philadelphia; others struggle citywide. Below are the strongest neighborhoods for subtypes at different points in the Philadelphia ranking:
Kosher Restaurant — ranked #1 citywide — the strongest subtype in Philadelphia
- Chestnut-Hill (89% survivability)
- Academy-Gardens (87% survivability)
- Roxborough-Park (87% survivability)
- Modena (86% survivability)
- Newbold (86% survivability)
Full Kosher Restaurants guide for Philadelphia →
Sri Lankan Restaurant — ranked #47 of 93 — a middle-of-the-pack Philadelphia subtype
- Chestnut-Hill (89% survivability)
- Wissahickon-Park (88% survivability)
- Port-Richmond (87% survivability)
- Richmond (86% survivability)
- Academy-Gardens (85% survivability)
Full Sri Lankan Restaurants guide for Philadelphia →
Tapas Restaurant — ranked #93 of 93 — among Philadelphia's lower-ranked subtypes
- Society-Hill (70% survivability)
- Old-City (69% survivability)
- Queen-Village (66% survivability)
- Fitler-Square (65% survivability)
- Hawthorne (64% survivability)
Full Tapas Restaurants guide for Philadelphia →
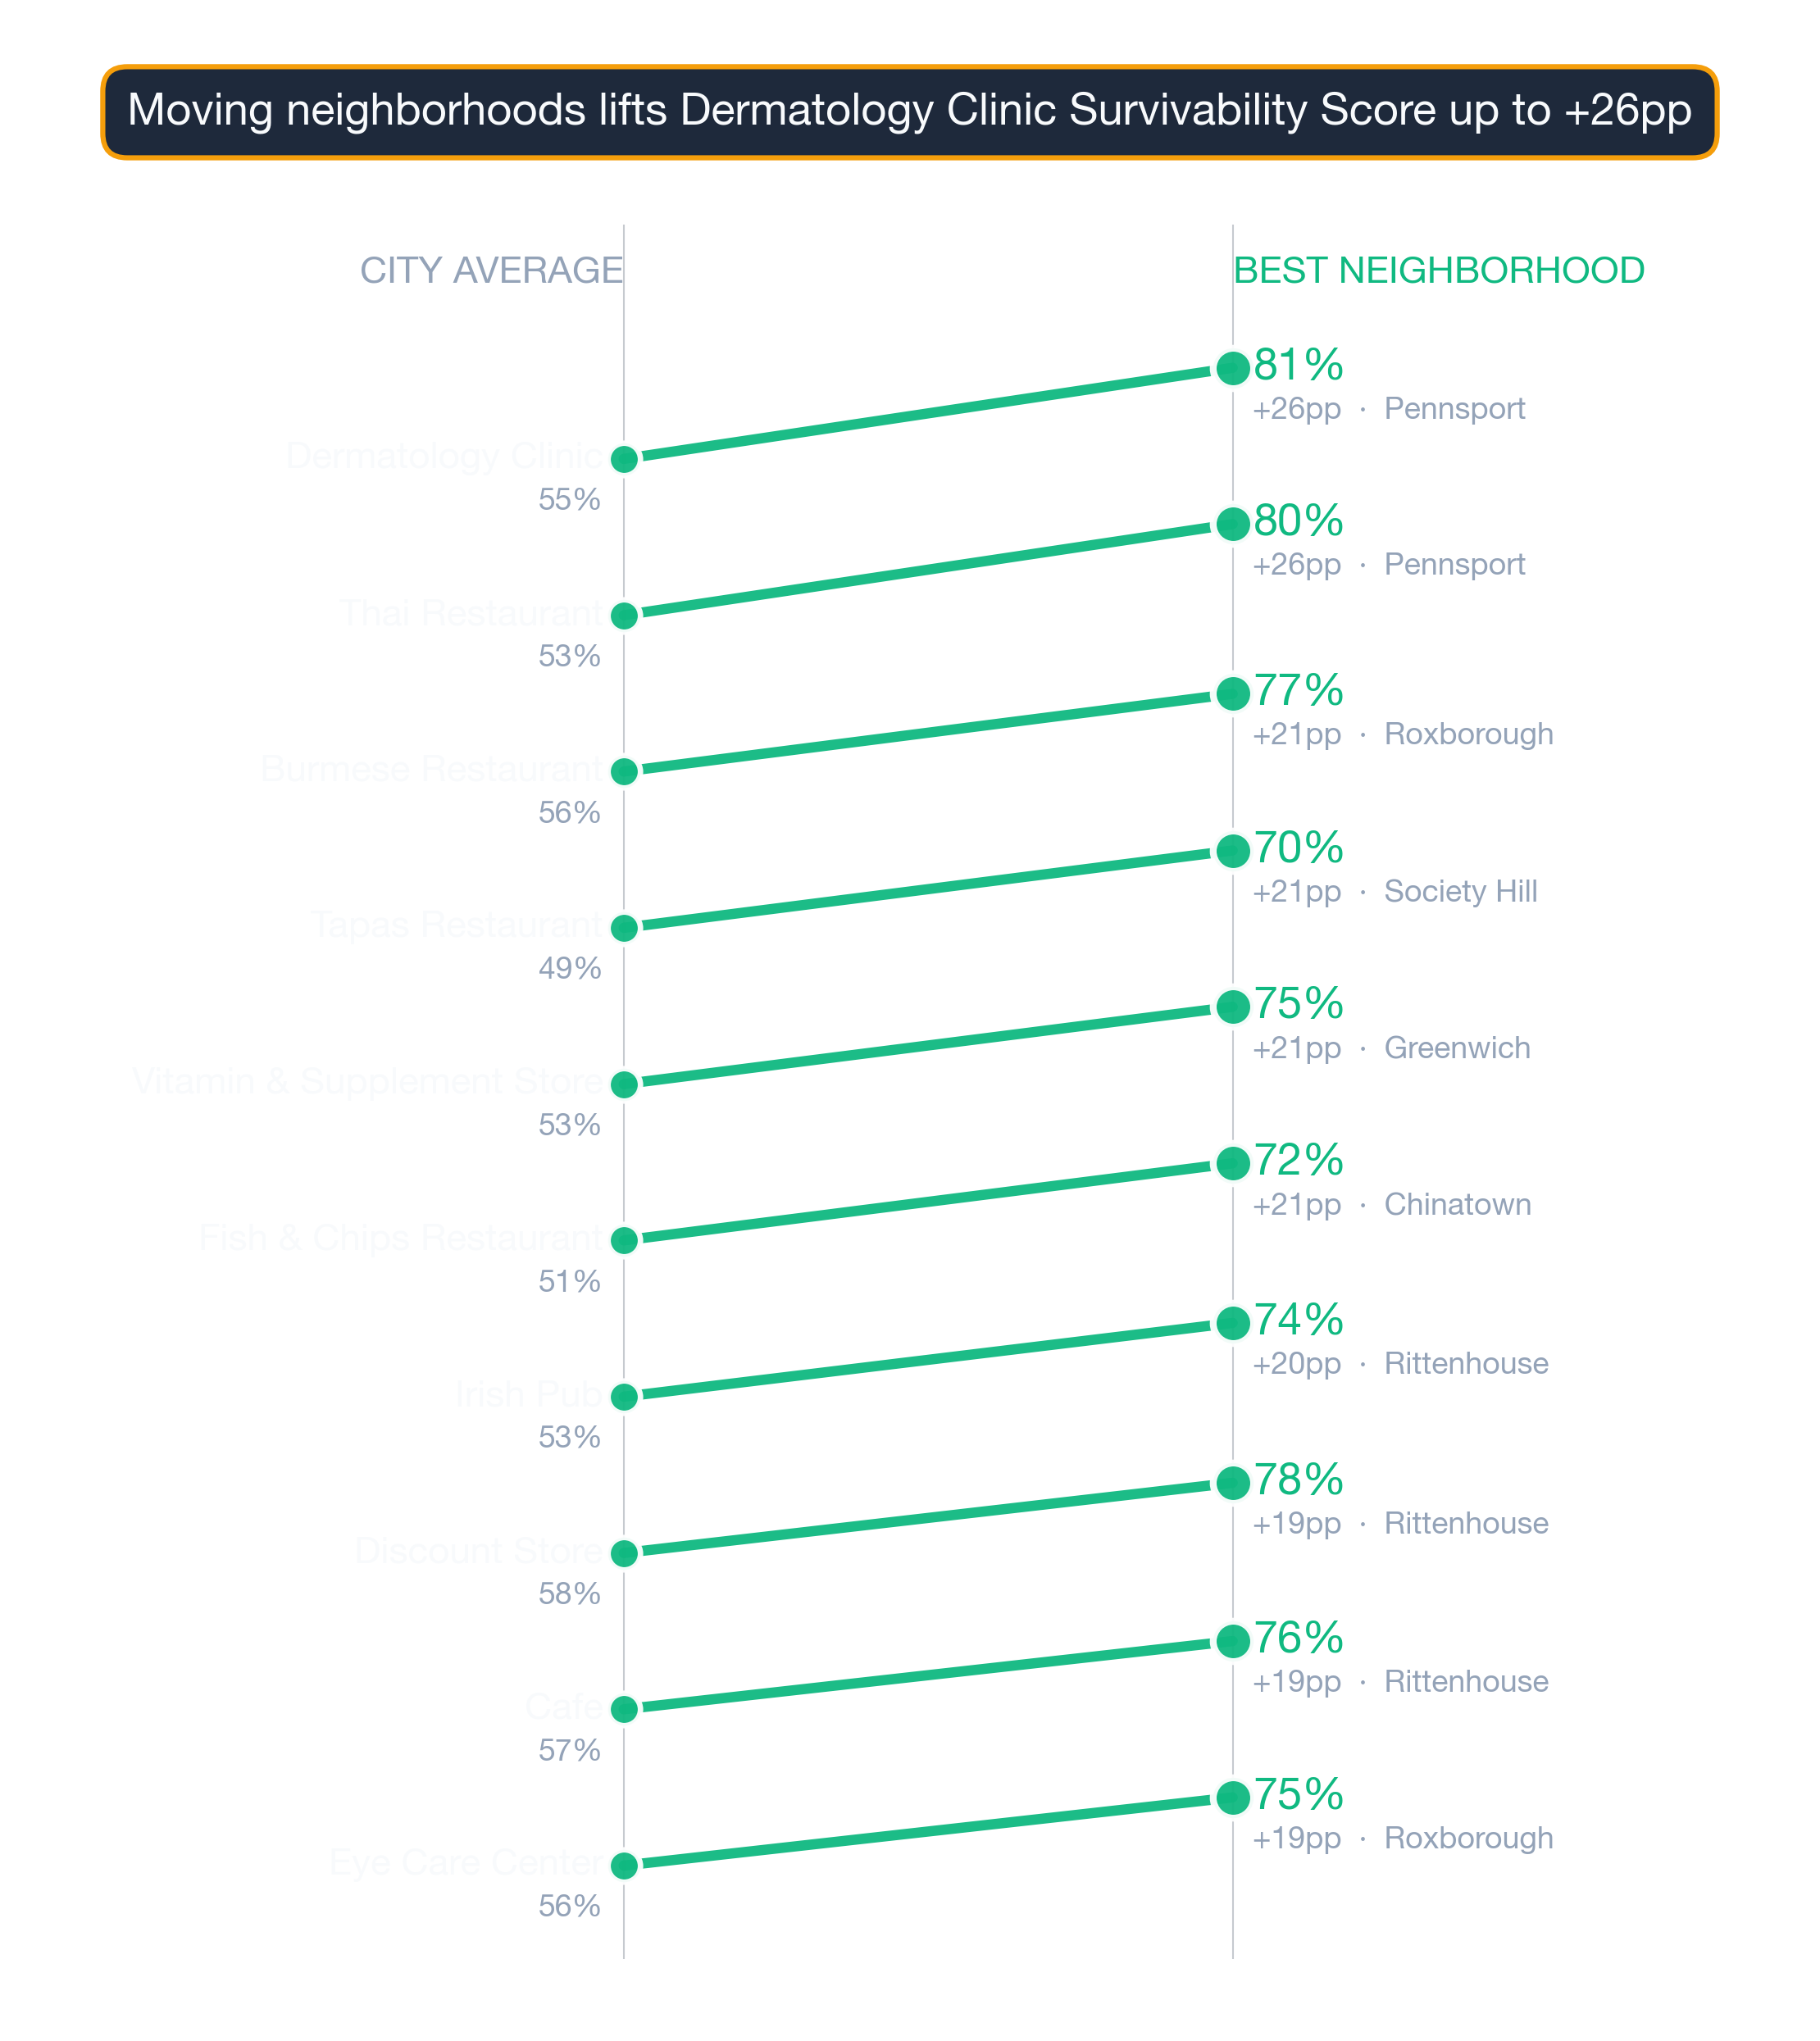
City-wide rankings tell you which subtypes are easiest on average. Neighborhood-level data tells you where each one actually wins.
Visual Data
Related Resources
- Neighborhood Survivability Rankings: Philadelphia
- Philadelphia Business Survivability Data 2026
- City Survivability Rankings for Pet Boarding Facility
- National Neighborhood Rankings for Pet Boarding Facility
- Pet Boarding Facility Survivability Rankings: Philadelphia
- Armenian Restaurant Survivability Rankings: Philadelphia
- Southern Food Restaurant Survivability Rankings: Philadelphia
- StreetSpring Methodology and Data Sources
Technical note: Aggregated survivability rankings for Philadelphia are available in machine-readable format for research and integration purposes.
View technical data for Philadelphia
StreetSpring recalculates survivability using the latest competitive, demographic, and walkability data, so the live score may differ from the static ranges shown here.