Neighborhood Survivability Rankings: St. Louis
StreetSpring's 2026 analysis ranks the best and worst neighborhoods in St. Louis for new businesses by survivability score. See which areas give you the best chance of lasting more than two years.
Last reviewed: May 10, 2026 by Bobby Koons, StreetSpring founder — updated weekly
Quick Summary
- Top neighborhood: Union — ~93% best-case survivability, ~85% average across all business types
- Most challenging: O'Fallon — ~71% average survivability
- 33 neighborhoods analyzed across the St. Louis metro
- Rankings based on average survivability across 130+ brick-and-mortar business types; your specific business type and address will differ
- See our full methodology →
Table of Contents
- Summary
- 10 Best Neighborhoods to Open a Business
- Hardest Places to Open a Business
- Where Would a Business Make the Most Money?
- What Should I Consider When Opening?
- Where to Start & How to Find Data
- Advice for Landlords
- Tools for Tenant-Rep Agents
- Why Do Survival Rates Vary?
- What Is a Survivability Score?
- How Does StreetSpring Compare?
- What Each Neighborhood Specializes In
- Related Resources
Summary
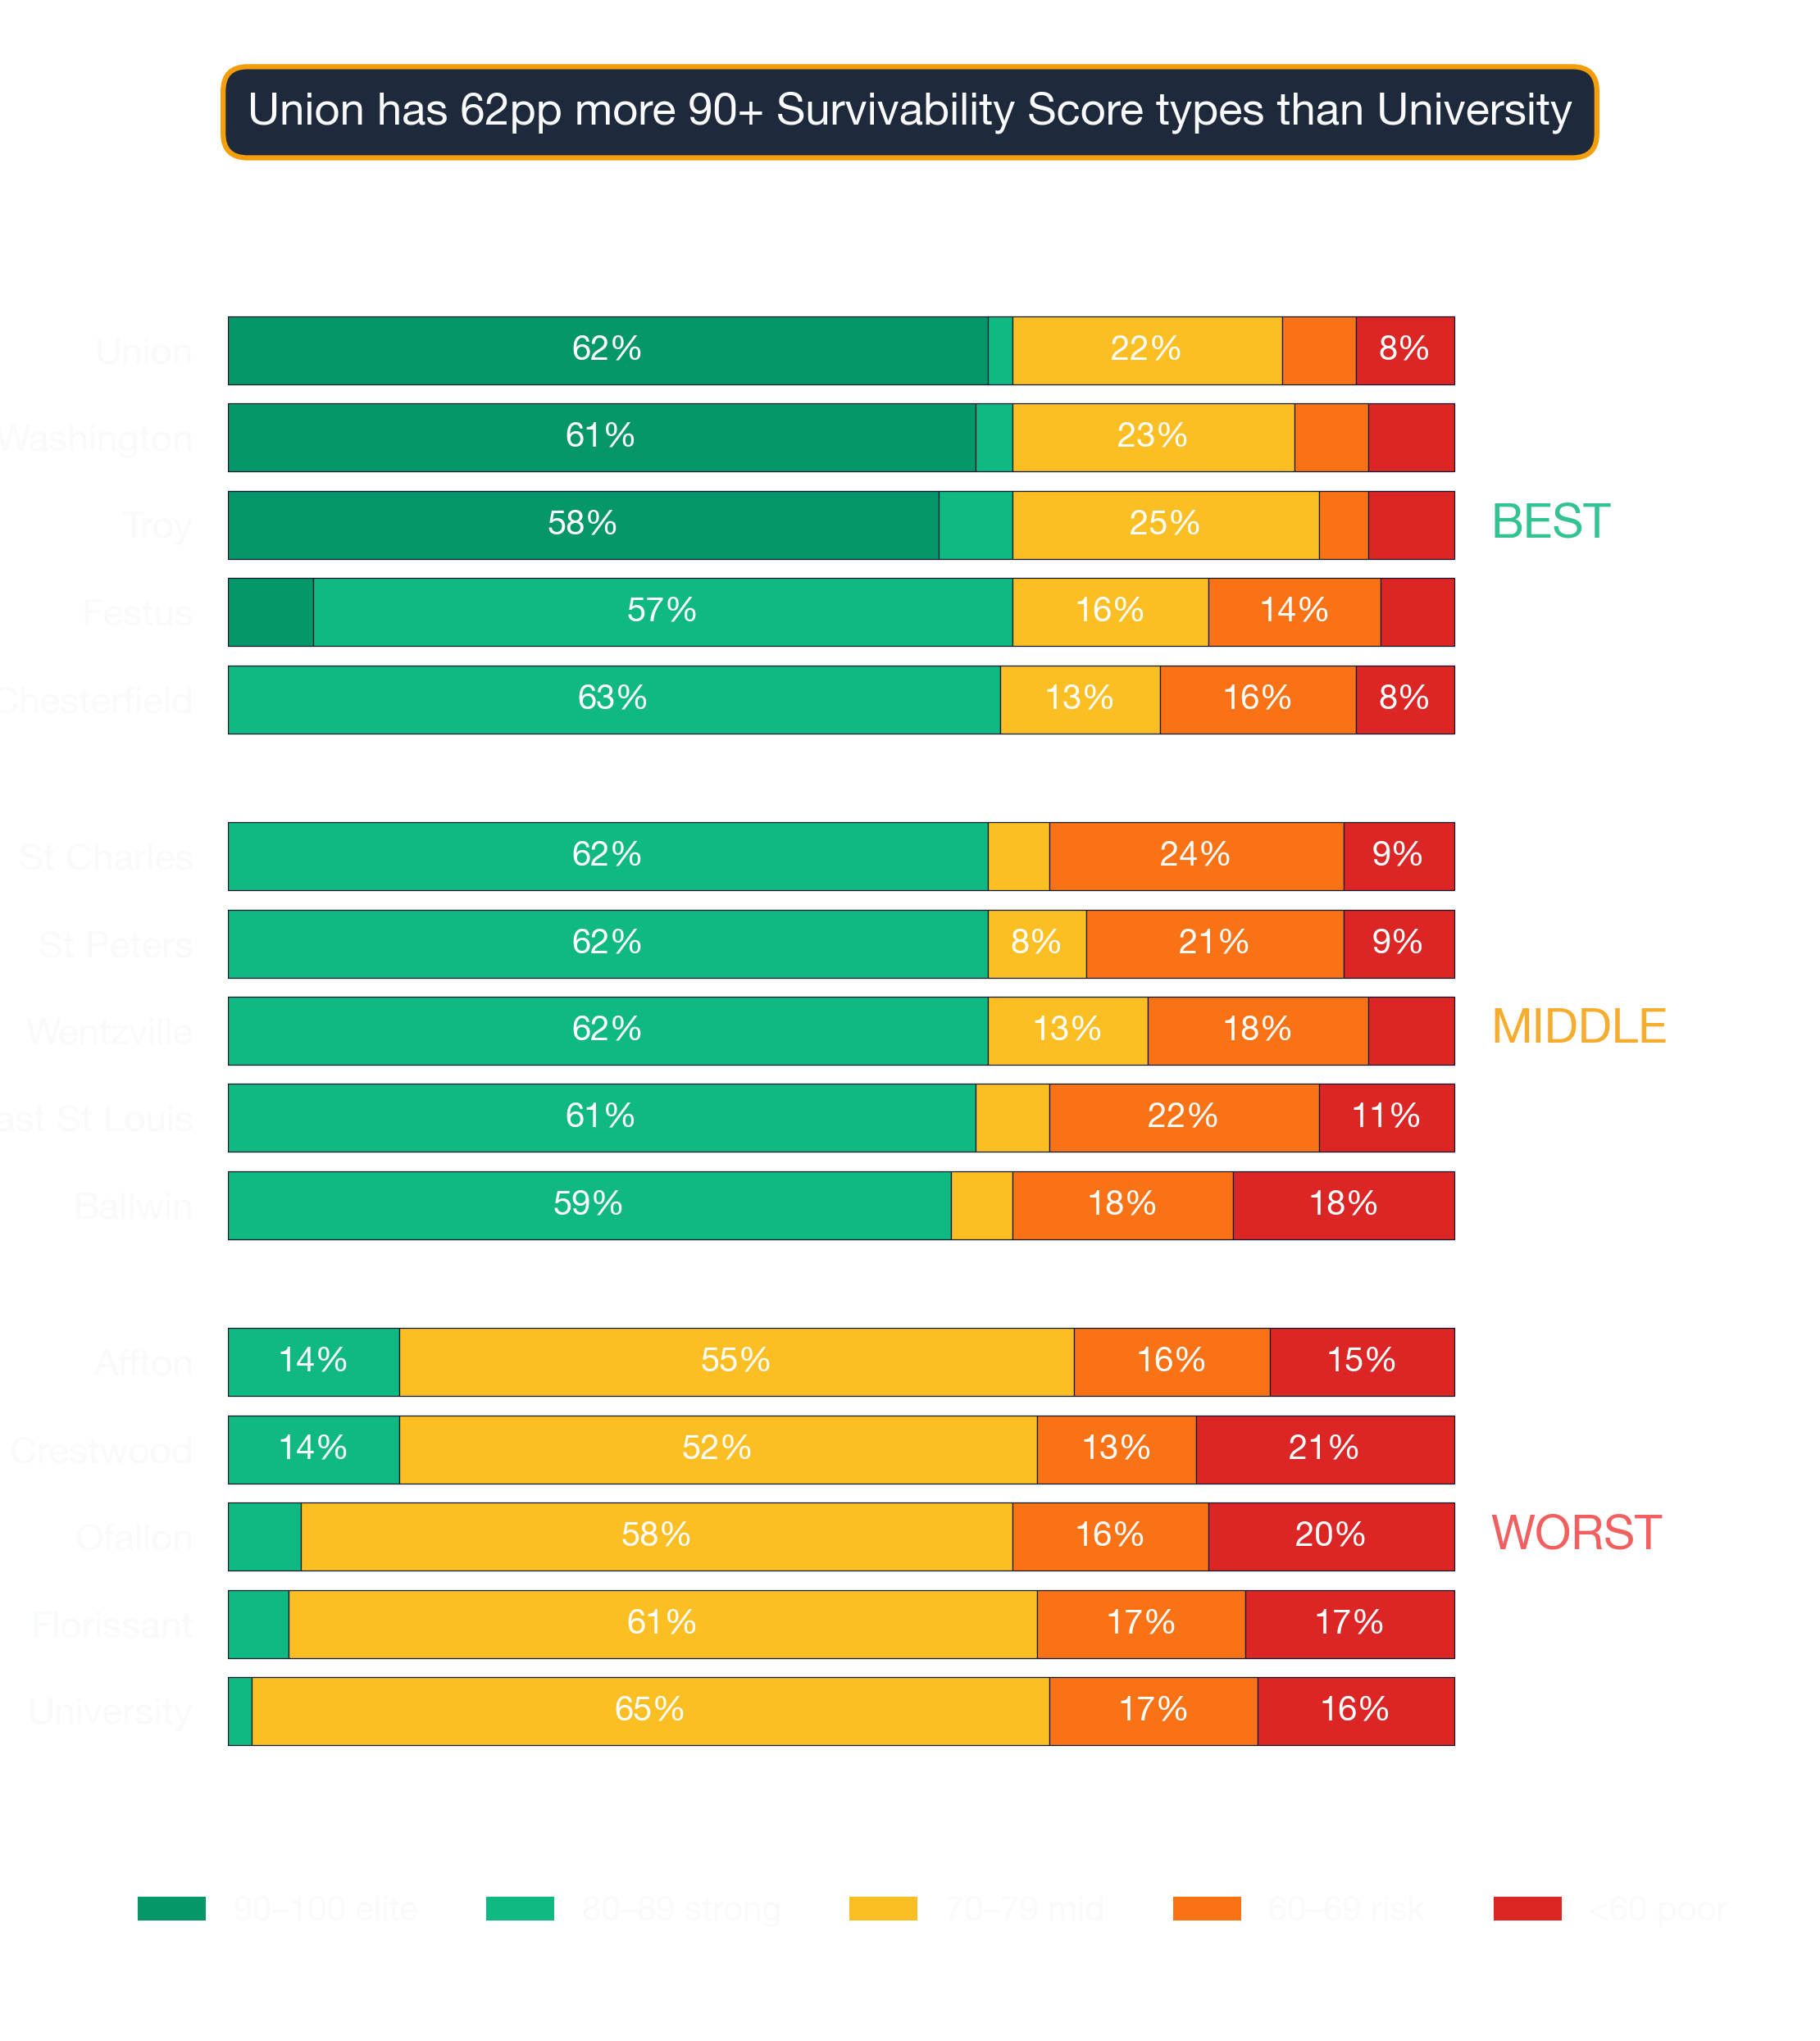
StreetSpring's 2026 analysis shows Union is the strongest neighborhood in St. Louis for new businesses, with the best locations offering a ~93% chance of lasting more than two years. Across all business types that could open in Union, the average location shows a ~85% chance of lasting more than two years. Averages mask the full picture — a single block can outperform an entire neighborhood's ranking at the storefront level.
Top-Survivability St. Louis Neighborhoods for
The top 10 neighborhoods in or around St. Louis to open a business are:
| # | Neighborhood | Avg Survival | Best Locations | Challenging Locations |
|---|---|---|---|---|
| 1 | Union | ~85% | ~93% | ~63% |
| 2 | Washington | ~85% | ~92% | ~63% |
| 3 | Troy | ~84% | ~91% | ~65% |
| 4 | Festus | ~82% | ~90% | ~61% |
| 5 | Edwardsville | ~81% | ~93% | ~59% |
| 6 | Chesterfield | ~81% | ~93% | ~60% |
| 7 | Collinsville | ~80% | ~91% | ~60% |
| 8 | Eureka | ~80% | ~90% | ~61% |
| 9 | Dardenne Prairie | ~80% | ~90% | ~57% |
| 10 | Belleville | ~79% | ~91% | ~60% |
See the Survivability Score for your new business

What Are the Hardest Places in or Around St. Louis to Open a Business?
The hardest neighborhoods in or around St. Louis to open a business are:
| # | Neighborhood | Best Locations | Challenging Locations |
|---|---|---|---|
| 33 | O'Fallon | ~71% | ~57% |
| 32 | Crestwood | ~72% | ~61% |
| 31 | University | ~72% | ~60% |
| 30 | Florissant | ~73% | ~57% |
| 29 | Overland | ~73% | ~61% |
However, individual locations vary widely, and even in lower-scoring neighborhoods there are pockets that perform exceptionally well. Static rankings can't capture every recent change in competition or foot traffic, which is why StreetSpring's real-time tool is the best place to check today's survivability score for a particular location.
St. Louis's Best-Earning Neighborhoods for
StreetSpring can give you the precise likelihood that hundreds of different businesses will last at an exact address. In Union, the best possible location offers ~20% better survival odds than the average location in or around St. Louis — meaning a meaningfully higher probability of still operating after two years. On the other hand, in O'Fallon, the most challenging locations show survival odds that are roughly ~27% below the city average.
The pricing power gap explained
A great product in the wrong location will underperform; an average product in the right location can thrive. Based on StreetSpring's 2026 analysis for St. Louis, you can access the most up-to-date forecasts with StreetSpring for free to select the location that puts you in the best position to succeed.
See the Survivability Score for your new business
What Matters Most When Opening in St. Louis
When selecting a location it is crucial to select a location with a very high Survivability Score. Consider how differently two businesses perform at the same address: an Irish Pub will have a different forecasted spend than a Vietnamese Restaurant, a Mixed Martial Arts Studio, a Mexican Restaurant, and others — and no two of those businesses would score identically — even at the same address, survivability depends on what type of business is opening. StreetSpring relies on its own proprietary forecasting engine to deliver these predictions.
| Factor | Where new owners get tripped up | Questions to ask before you sign |
|---|---|---|
| Foot traffic seasonality | Looking at a peak-summer Tuesday and assuming year-round volume. | Walk the block at 3 different times across 2 different weeks. Ask neighboring tenants for their slow-season % drop. |
| Permits & licensing | Assuming a 30-day permit timeline, hitting 90+ days, paying rent on a non-operating storefront. | Call the local zoning office before signing. Confirm your use is already permitted; if not, factor a 2-3 month variance timeline. |
| Outdoor seating / sidewalk use | Signing assuming you can add patio seating, then learning the city requires a separate sidewalk-cafe permit with long lead times. | Check the city's sidewalk-cafe permit process up front. Confirm landlord allows outdoor build-out in the lease language. |
The hidden costs of operating in this neighborhood
High Revenue Capture Score is the clearest signal that a location can sustain a business over the long term. The market share component accounts for all competition — not just direct competitors but secondary and tertiary alternatives — and factors in the actual movement patterns of consumers in that area. We have been studying the businesses serving more than 180 million+ Americans. Competition in the right concentration signals demand and improves discovery — customers learn to visit a neighborhood for a specific category — this is why car dealerships often cluster together — however, market saturation is one of the leading predictors of failure in StreetSpring's model — too many strong competitors leaves too little market share for a new business to claim. StreetSpring's spending projections are business-type-specific and address-specific — built from a proprietary model trained on hundreds of thousands of real business outcomes across the country.
Revenue Capture Score = Projected Market Share × Forecasted Spend on Specific Business
Ranked by Revenue Capture Score across every brick-and-mortar business category, the top 3 neighborhoods in and around St. Louis are:
- Union
- Washington
- Troy
Some other important factors to consider:
Ownership Rates: Survivability Scores for service-oriented businesses improve in areas with high homeownership, where customers are more likely to become regulars rather than transient visitors. The top 3 neighborhoods in and around St. Louis with the highest ownership rates are: Ballwin, Crestwood, and St. Peters.
Build-out budget rules-of-thumb for this neighborhood
Employment Rates: Neighborhoods with high employment levels support stronger consumer spending, which directly benefits businesses whose revenue depends on discretionary income. The top 3 neighborhoods in and around St. Louis with the highest employment rates are: Kirkwood, Affton, and Crestwood.
Occupancy Rates: Surrounding occupancy rates affect survivability for every business type: empty storefronts reduce pedestrian activity and signal weakening demand in the area. The top 3 neighborhoods in and around St. Louis with the highest occupancy rates are: Troy, Wentzville, and Chesterfield.
See the Survivability Score for your new business
Pinpointing the Right Neighborhood for in St. Louis
According to StreetSpring's 2026 analysis, Union, Washington, and Troy are the strongest starting points in or around St. Louis — but the best neighborhood for your specific business type may differ from these overall rankings.
- Best businesses by neighborhood: A full breakdown of the top business types to open in each St. Louis neighborhood — including survivability scores by type — is at St. Louis Business Survivability Rankings.
- Best neighborhoods for your business type: If you already know your category, that same guide lets you filter by business type to see which neighborhoods score highest for your specific concept.
- Address-level scores: StreetSpring's live tool shows a survivability score for any business type at any exact address in or around St. Louis — updated weekly.
Get your address-level survivability score →
These rankings reflect aggregated data — for a current survivability score at your exact address, StreetSpring's live tool gives you the most precise picture.
What Should Landlords in or Around St. Louis Know When Evaluating Tenant Success?
Broad trends don't capture the unique dynamics of each storefront. Understanding which businesses will thrive helps landlords make smarter leasing decisions.
See how landlords can use these forecasts to improve occupancy and NOI: Landlord Representatives Guide
Try StreetSpring to see the Survivability Score for over 700 types of businesses at your storefront's address.
What Tools Can Tenant-Rep Agents Use to Find the Most Promising Locations in St. Louis?
The conventional approach to tenant representation leaves agents without the one number that matters most: the actual probability of the business surviving at that address, but StreetSpring highlights which addresses offer the best odds for long-term success across every business subtype in and around St. Louis. For a breakdown of the AI tools agents use to select the strongest sites, see: AI Tools for Tenant Reps
Why Do Business Survival Rates Vary So Much Between Neighborhoods in St. Louis?
Performance can vary dramatically within just a few hundred feet. Survival rate variation comes down to the specific combination of competition quality, consumer spending power, and customer flow that exists only at that exact address. Our research explains why U.S. business survival rates haven't risen in decades — and how location drives outcomes more than concept: Why Survival Rates Aren't Increasing
What Is a Survivability Score and How Does StreetSpring Calculate It?
Survivability Scores reflect the projected 2-year survival probability for a specific business type at a specific address, accounting for competition, spending, mobility, and dozens of other factors. See how it works →
How Does StreetSpring Compare to Other Site-Selection Tools?
StreetSpring differs from tools like Placer.ai or SiteZeus by modeling business survivability directly, rather than reporting foot traffic or demographics that you then have to interpret yourself. Full comparison →
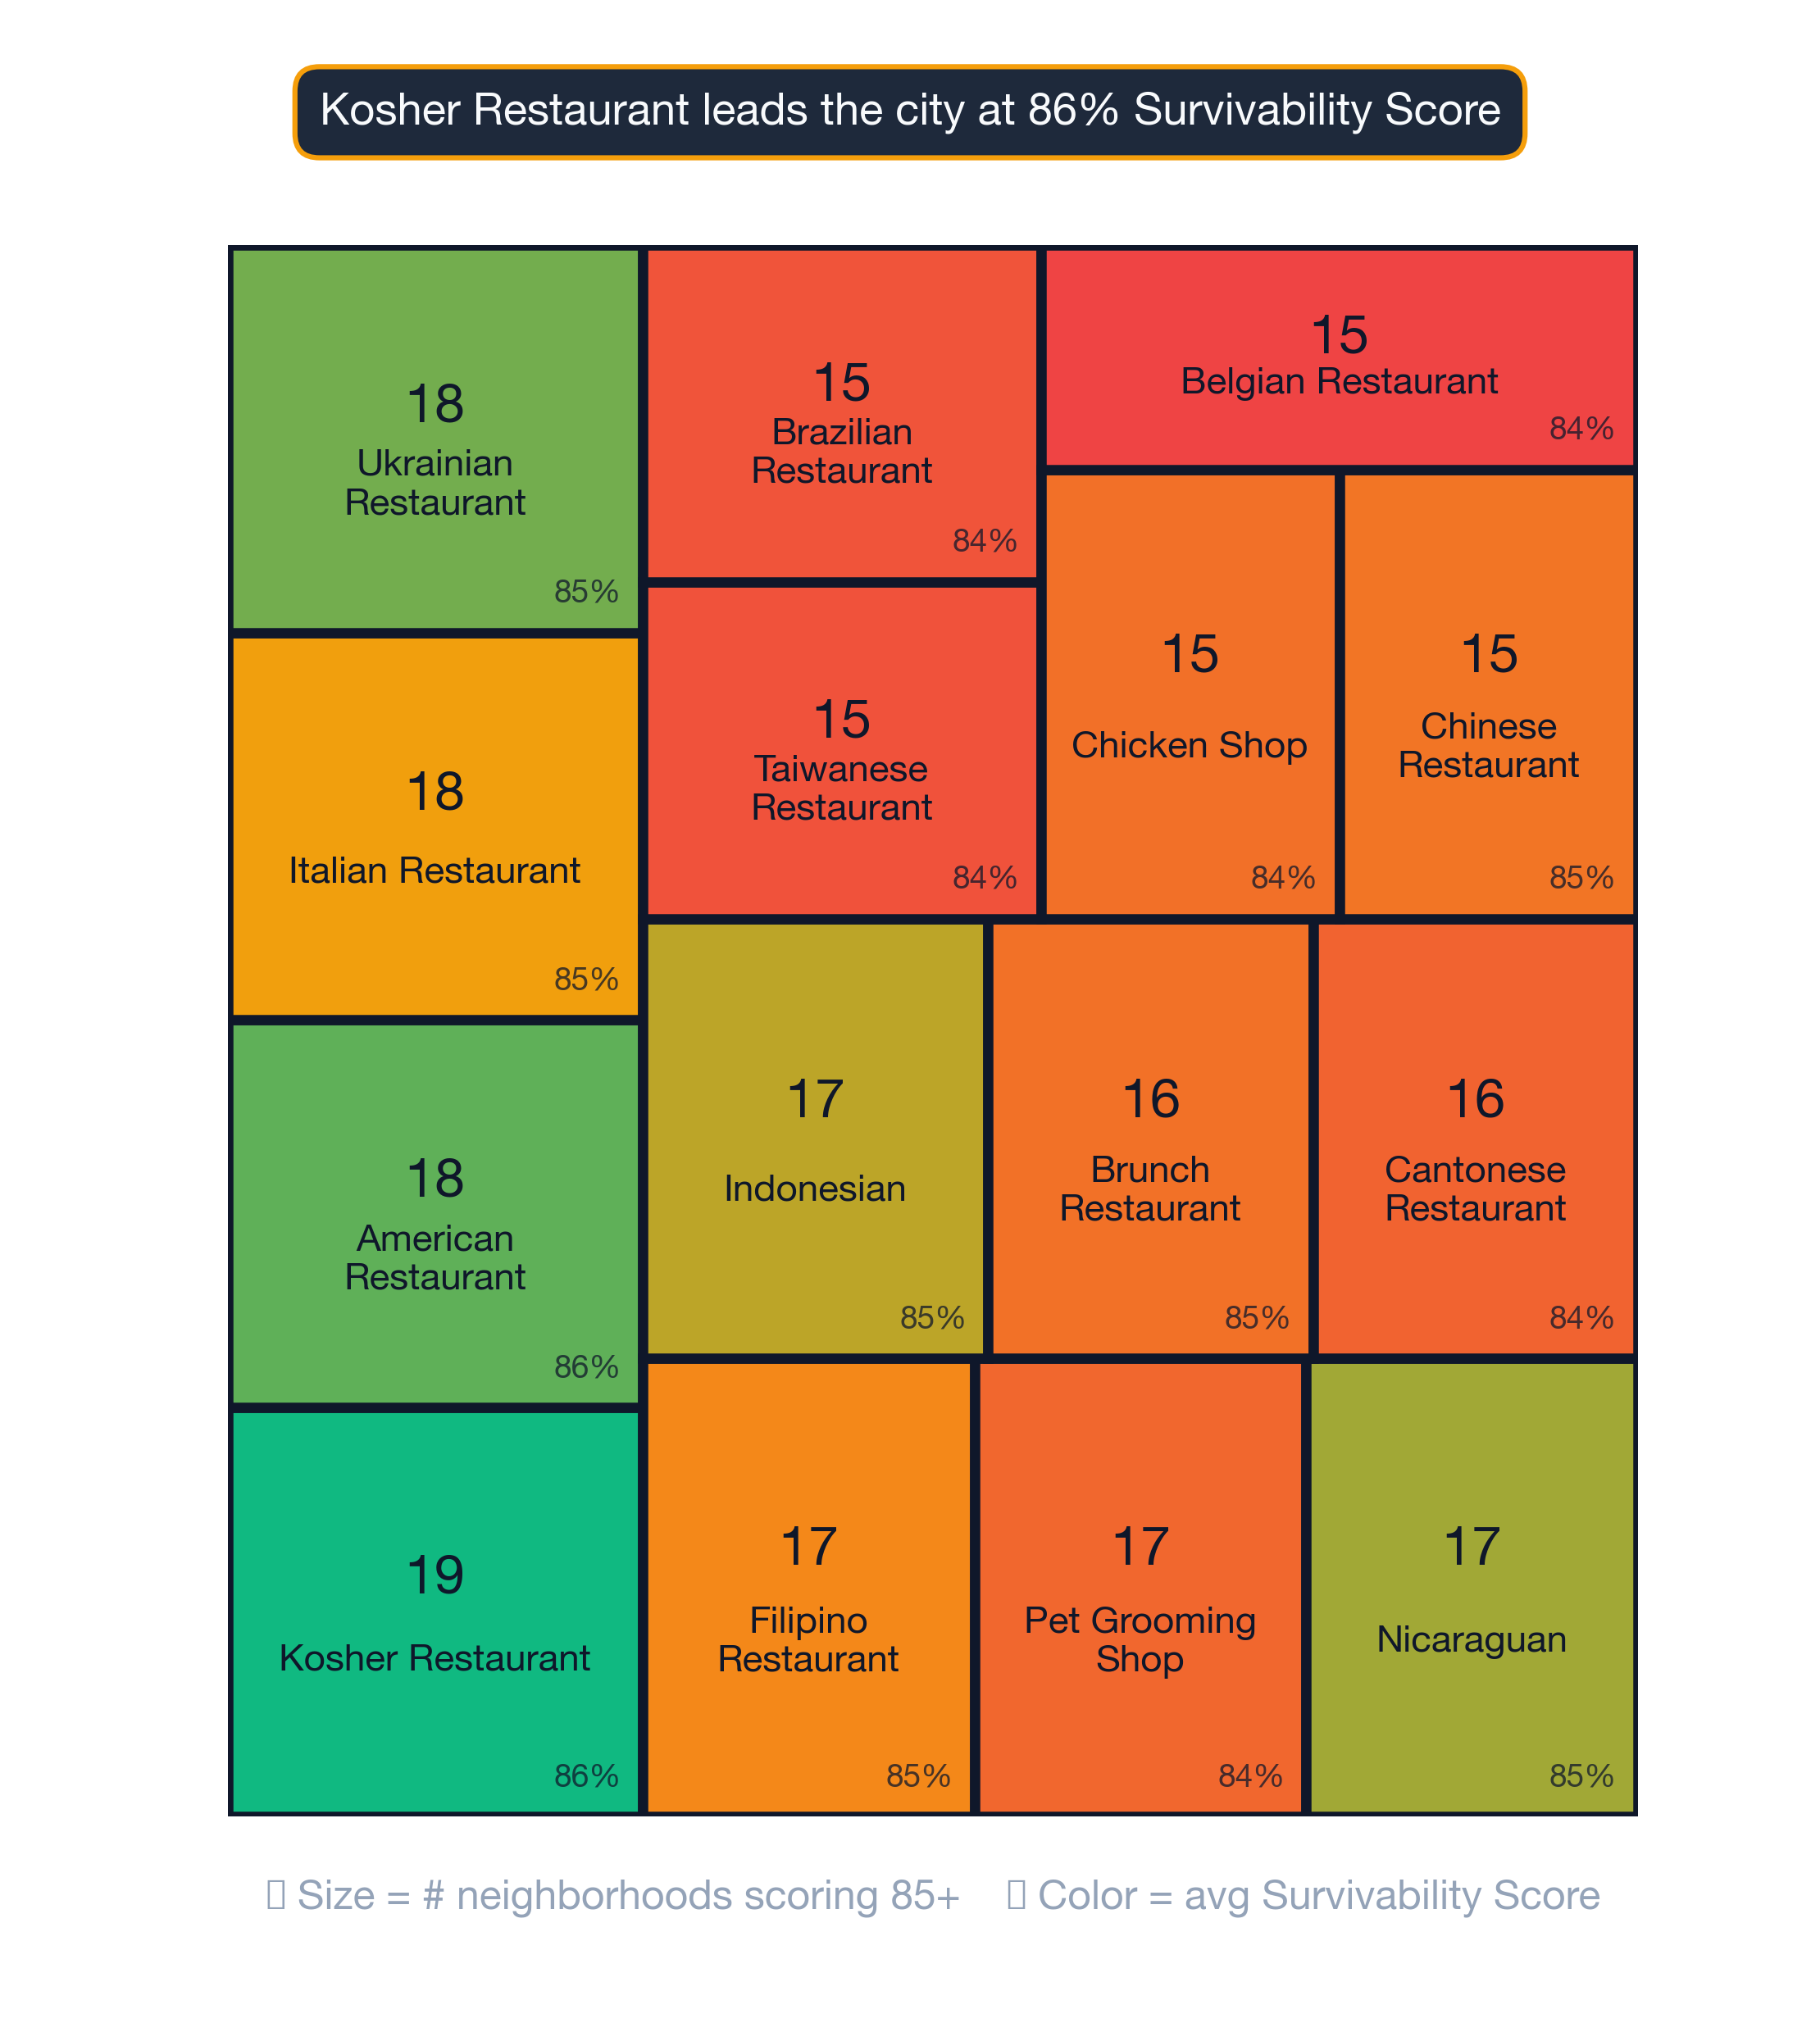
What Each Neighborhood Specializes In
Every neighborhood has its specialty. Even St. Louis's lower-ranked neighborhoods have business types that thrive there. Below are the strongest subtypes for neighborhoods at different points in the St. Louis ranking:
Union — ranked #1 citywide — the strongest neighborhood in St. Louis
- Italian Restaurant (93% survivability)
- Kosher Restaurant (93% survivability)
- American Restaurant (93% survivability)
- Bangladeshi Restaurant (93% survivability)
- Ukrainian Restaurant (93% survivability)
Ofallon — ranked #33 of 33 — among St. Louis's lower-ranked neighborhoods
- Kosher Restaurant (82% survivability)
- American Restaurant (81% survivability)
- Italian Restaurant (81% survivability)
- Indonesian Restaurant (81% survivability)
- Filipino Restaurant (81% survivability)
The best neighborhood for your business depends on what business you're opening — citywide neighborhood rankings are a starting filter, not the final answer.
Visual Data
Related Resources
Rankings based on historical averages shift as new competitors open or close — StreetSpring's live platform always reflects the most current survivability for any given address. See the full rankings and get a live survivability score for any address in St. Louis.
- St. Louis Business Survivability Rankings — overall rankings by business type across all St. Louis neighborhoods
- Business Survivability in Union
- Business Survivability in Washington
- Business Survivability in Troy
- StreetSpring Methodology
Technical note: Aggregated survivability rankings for St. Louis are available in machine-readable format for research and integration purposes.
View technical data for St. Louis
StreetSpring recalculates survivability using the latest competitive, demographic, and walkability data, so the live score may differ from the static ranges shown here.