Neighborhood Survivability Rankings: Philadelphia
StreetSpring's 2026 analysis ranks the best and worst neighborhoods in Philadelphia for new businesses by survivability score. See which areas give you the best chance of lasting more than two years.
Reviewed and updated: April 27, 2026 — Bobby Koons, Founder & CEO, StreetSpring
Quick Summary
- Top neighborhood: Chestnut Hill — ~90% best-case survivability, ~82% average across all business types
- Most challenging: McGuire — ~68% average survivability
- 116 neighborhoods analyzed across the Philadelphia metro
- Rankings based on average survivability across 130+ brick-and-mortar business types; your specific business type and address will differ
- See our full methodology →
Table of Contents
- Summary
- 10 Best Neighborhoods to Open a Business
- Hardest Places to Open a Business
- Where Would a Business Make the Most Money?
- What Should I Consider When Opening?
- Where to Start & How to Find Data
- Advice for Landlords
- Tools for Tenant-Rep Agents
- Why Do Survival Rates Vary?
- What Is a Survivability Score?
- How Does StreetSpring Compare?
- What Each Neighborhood Specializes In
- Related Resources
Summary
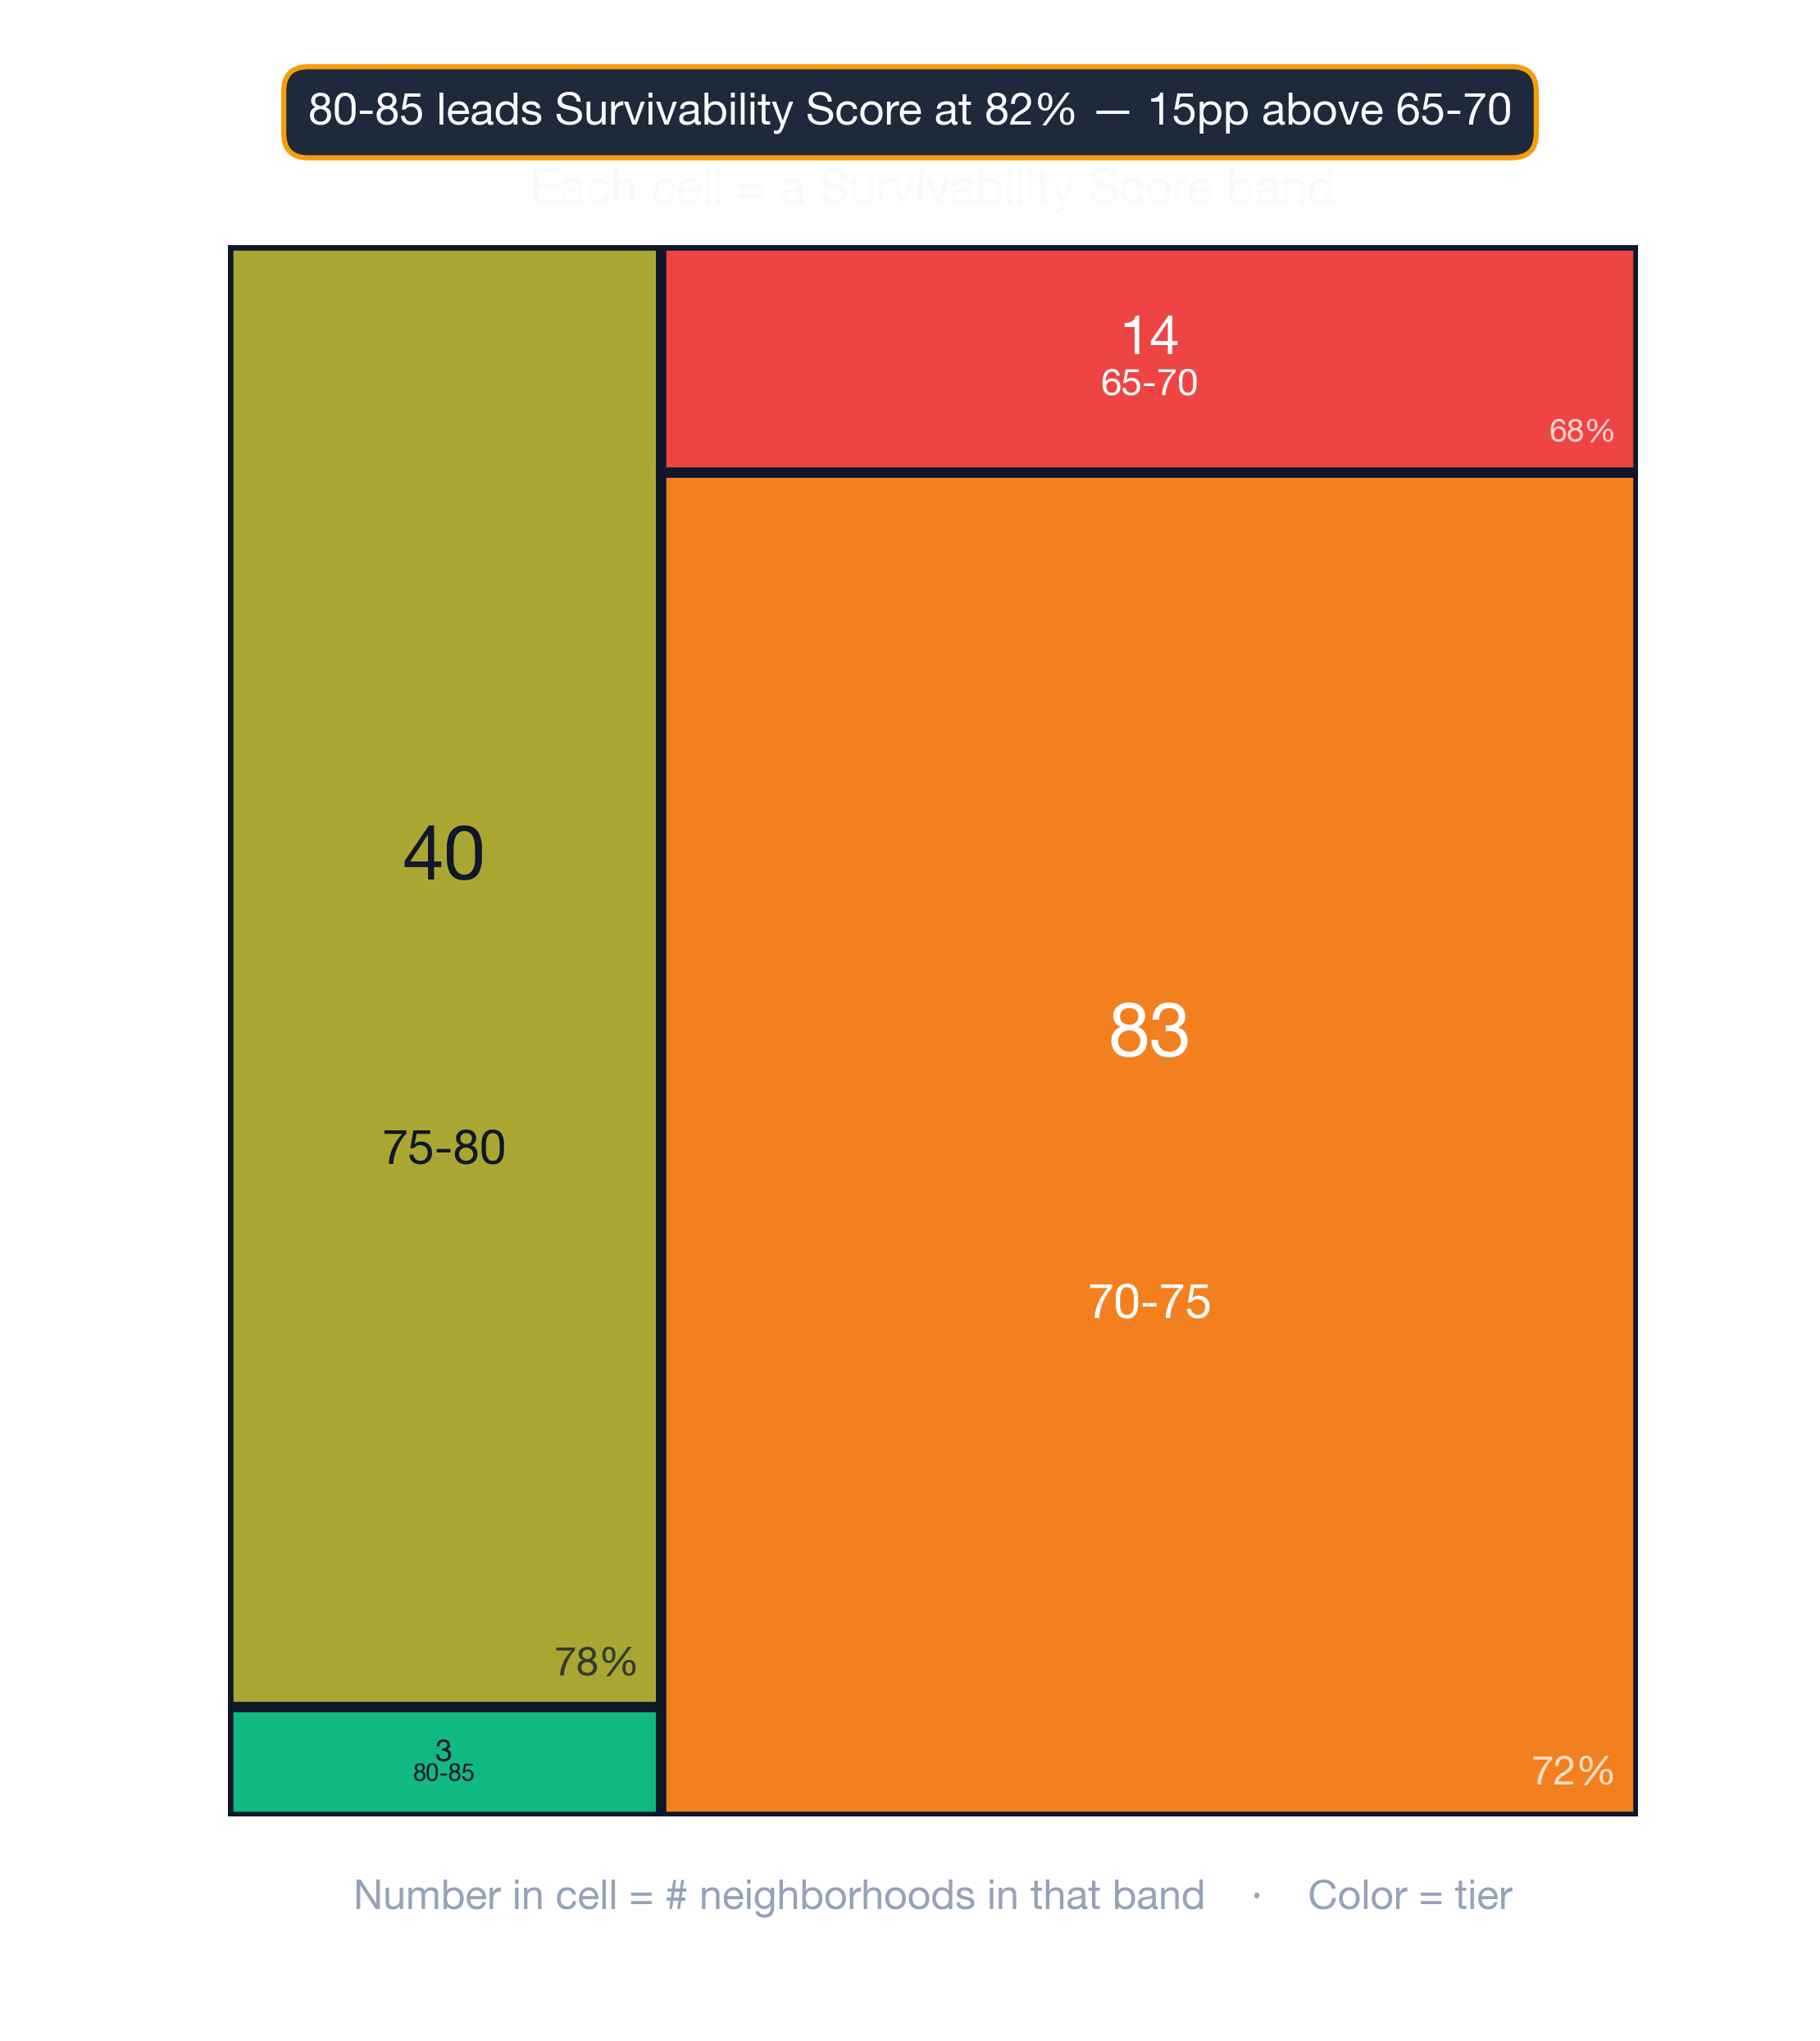
StreetSpring's 2026 analysis shows Chestnut Hill is the strongest neighborhood in Philadelphia for new businesses, with the best locations offering a ~90% chance of lasting more than two years. Across all business types that could open in Chestnut Hill, the average location shows a ~82% chance of lasting more than two years. Averages mask the full picture — a single block can outperform an entire neighborhood's ranking at the storefront level.
Where Thrive in Philadelphia
The top 10 neighborhoods in or around Philadelphia to open a business are:
| # | Neighborhood | Avg Survival | Best Locations | Challenging Locations |
|---|---|---|---|---|
| 1 | Chestnut Hill | ~82% | ~90% | ~65% |
| 2 | Wissahickon Park | ~81% | ~89% | ~70% |
| 3 | Summerdale | ~78% | ~85% | ~69% |
| 4 | Manayunk | ~78% | ~88% | ~69% |
| 5 | Roxborough | ~78% | ~84% | ~71% |
| 6 | Crescentville | ~78% | ~85% | ~69% |
| 7 | Bella Vista | ~78% | ~81% | ~74% |
| 8 | Hawthorne | ~78% | ~81% | ~72% |
| 9 | Oxford Circle | ~78% | ~85% | ~68% |
| 10 | Germany Hill | ~78% | ~84% | ~72% |
See the Survivability Score for your new business

What Are the Hardest Places in or Around Philadelphia to Open a Business?
The hardest neighborhoods in or around Philadelphia to open a business are:
| # | Neighborhood | Best Locations | Challenging Locations |
|---|---|---|---|
| 116 | McGuire | ~68% | ~63% |
| 115 | Belmont | ~68% | ~63% |
| 114 | Stanton | ~68% | ~63% |
| 113 | Hartranft | ~69% | ~62% |
| 112 | Haverford North | ~69% | ~63% |
Even the lowest-ranked neighborhoods contain locations that beat the city average — and even top-ranked ones have weak spots. Rankings based on historical averages shift as new competitors open or close — StreetSpring's live platform always reflects the most current survivability for any given address.
The Top Revenue Neighborhoods for in Philadelphia
StreetSpring delivers pinpoint accuracy down to the exact storefront location. In Chestnut Hill, the best possible location offers ~22% better survival odds than the average location in or around Philadelphia — meaning a meaningfully higher probability of still operating after two years. On the other hand, in McGuire, the most challenging locations show survival odds that are roughly ~14% below the city average.
How daytime population shapes the revenue map
A great product in the wrong location will underperform; an average product in the right location can thrive. Based on StreetSpring's 2026 analysis for Philadelphia, you can access the most up-to-date forecasts with StreetSpring for free to select the location that puts you in the best position to succeed.
See the Survivability Score for your new business
Key Considerations Before Opening in Philadelphia
Revenue Capture Score = Projected Market Share × Forecasted Spend on Specific Business
Before signing a lease, the most important metric to evaluate is the Survivability Score of that specific address. Among all the inputs that shape survivability, Revenue Capture Score carries the most predictive weight. The first component — Projected Market Share — is determined by the competitive landscape: The market share component accounts for all competition — not just direct competitors but secondary and tertiary alternatives — and factors in the actual movement patterns of consumers in that area. The model draws from 100+ location-specific factors to generate each survivability score. A certain density of competitors signals strong demand and can benefit all businesses — this is why car dealerships often cluster together — however, a saturated market leaves too little revenue for any single operator to capture enough share to survive. The second component — Forecasted Spend — differs by business type: Forecasted consumer spend varies by business type: StreetSpring projects how much nearby consumers are likely to spend on that specific business type, drawing on a training dataset that covers hundreds of thousands of businesses nationwide; thus, a Liquor Store will have a different forecasted spend than a Georgian Restaurant, a Brazilian Restaurant, a Convenience Store, and others — and every one of those business types would produce a distinct forecast at the exact same storefront. StreetSpring's proprietary models are continuously updated with new business outcome data to keep predictions accurate and current.
When scoring all possible business types simultaneously, these 3 neighborhoods in and around Philadelphia lead in Revenue Capture potential:
- Chestnut Hill
- Wissahickon Park
- Summerdale
Some other important factors to consider:
Ownership Rates: High homeownership near a business location signals a stable, rooted customer base — residents who stay in the area and build habits around local businesses. The top 3 neighborhoods in and around Philadelphia with the highest ownership rates are: Winchester Park, Girard Estates, and Melrose Park Gardens.
| Factor | Where new owners get tripped up | Questions to ask before you sign |
|---|---|---|
| Outdoor seating / sidewalk use | Signing assuming you can add patio seating, then learning the city requires a separate sidewalk-cafe permit with long lead times. | Check the city's sidewalk-cafe permit process up front. Confirm landlord allows outdoor build-out in the lease language. |
| Foot traffic seasonality | Looking at a peak-summer Tuesday and assuming year-round volume. | Walk the block at 3 different times across 2 different weeks. Ask neighboring tenants for their slow-season % drop. |
| Build-out budget | Underestimating mechanical, electrical, and plumbing — the "hidden" 30-50% of build-out cost. | Get 3 quotes from licensed contractors and pad budget by +20% for surprises. Confirm landlord TI allowance in writing. |
Permits, licensing, and zoning specifics worth flagging
Employment Rates: Neighborhoods with high employment levels support stronger consumer spending, which directly benefits businesses whose revenue depends on discretionary income. The top 3 neighborhoods in and around Philadelphia with the highest employment rates are: Germany Hill, Logan Square, and Fitler Square.
Occupancy Rates: Low vacancy rates around a location are a strong positive indicator — they signal that the neighborhood's business ecosystem is healthy and self-reinforcing. The top 3 neighborhoods in and around Philadelphia with the highest occupancy rates are: Pennypack Woods, Dickinson Narrows, and Pennypack.
See the Survivability Score for your new business
Where in or Around Philadelphia Should I Start ?
According to StreetSpring's 2026 analysis, Chestnut Hill, Wissahickon Park, and Summerdale are the strongest starting points in or around Philadelphia — but the best neighborhood for your specific business type may differ from these overall rankings.
- Best businesses by neighborhood: A full breakdown of the top business types to open in each Philadelphia neighborhood — including survivability scores by type — is at Philadelphia Business Survivability Rankings.
- Best neighborhoods for your business type: If you already know your category, that same guide lets you filter by business type to see which neighborhoods score highest for your specific concept.
- Address-level scores: StreetSpring's live tool shows a survivability score for any business type at any exact address in or around Philadelphia — updated weekly.
Get your address-level survivability score →
Rankings based on historical averages shift as new competitors open or close — StreetSpring's live platform always reflects the most current survivability for any given address.
What Should Landlords in or Around Philadelphia Know When Evaluating Tenant Success?
Neighborhood-level rankings are a starting point — survivability at the property level can be meaningfully different from the area average. Using address-level survivability scores, landlords can identify the business types most likely to pay rent consistently for years — not just the first 12 months.
See how landlords can use these forecasts to improve occupancy and NOI: Landlord Representatives Guide
Try StreetSpring to see the Survivability Score for over 700 types of businesses at your storefront's address.
What Tools Can Tenant-Rep Agents Use to Find the Most Promising Locations in Philadelphia?
Most tenant-rep agents work without access to business survivability data, relying instead on market comps and foot traffic estimates that do not predict outcomes, but StreetSpring highlights which addresses offer the best odds for long-term success across every business subtype in and around Philadelphia. For a breakdown of the AI tools agents use to select the strongest sites, see: AI Tools for Tenant Reps
Why Do Business Survival Rates Vary So Much Between Neighborhoods in Philadelphia?
Two storefronts on the same street can have survivability scores that differ by 20 points or more — the block level matters as much as the neighborhood. Location uniqueness explains why the same concept can thrive on one block and fail two blocks away — the address-level variables compound in ways that neighborhood averages cannot capture. Our research explains why U.S. business survival rates haven't risen in decades — and how location drives outcomes more than concept: Why Survival Rates Aren't Increasing
What Is a Survivability Score and How Does StreetSpring Calculate It?
Survivability Scores reflect the projected 2-year survival probability for a specific business type at a specific address, accounting for competition, spending, mobility, and dozens of other factors. See how it works →
How Does StreetSpring Compare to Other Site-Selection Tools?
The key difference between StreetSpring and traditional site-selection tools is outcome focus: StreetSpring tells you if the business will survive, not just what the foot traffic looks like today. Full comparison →
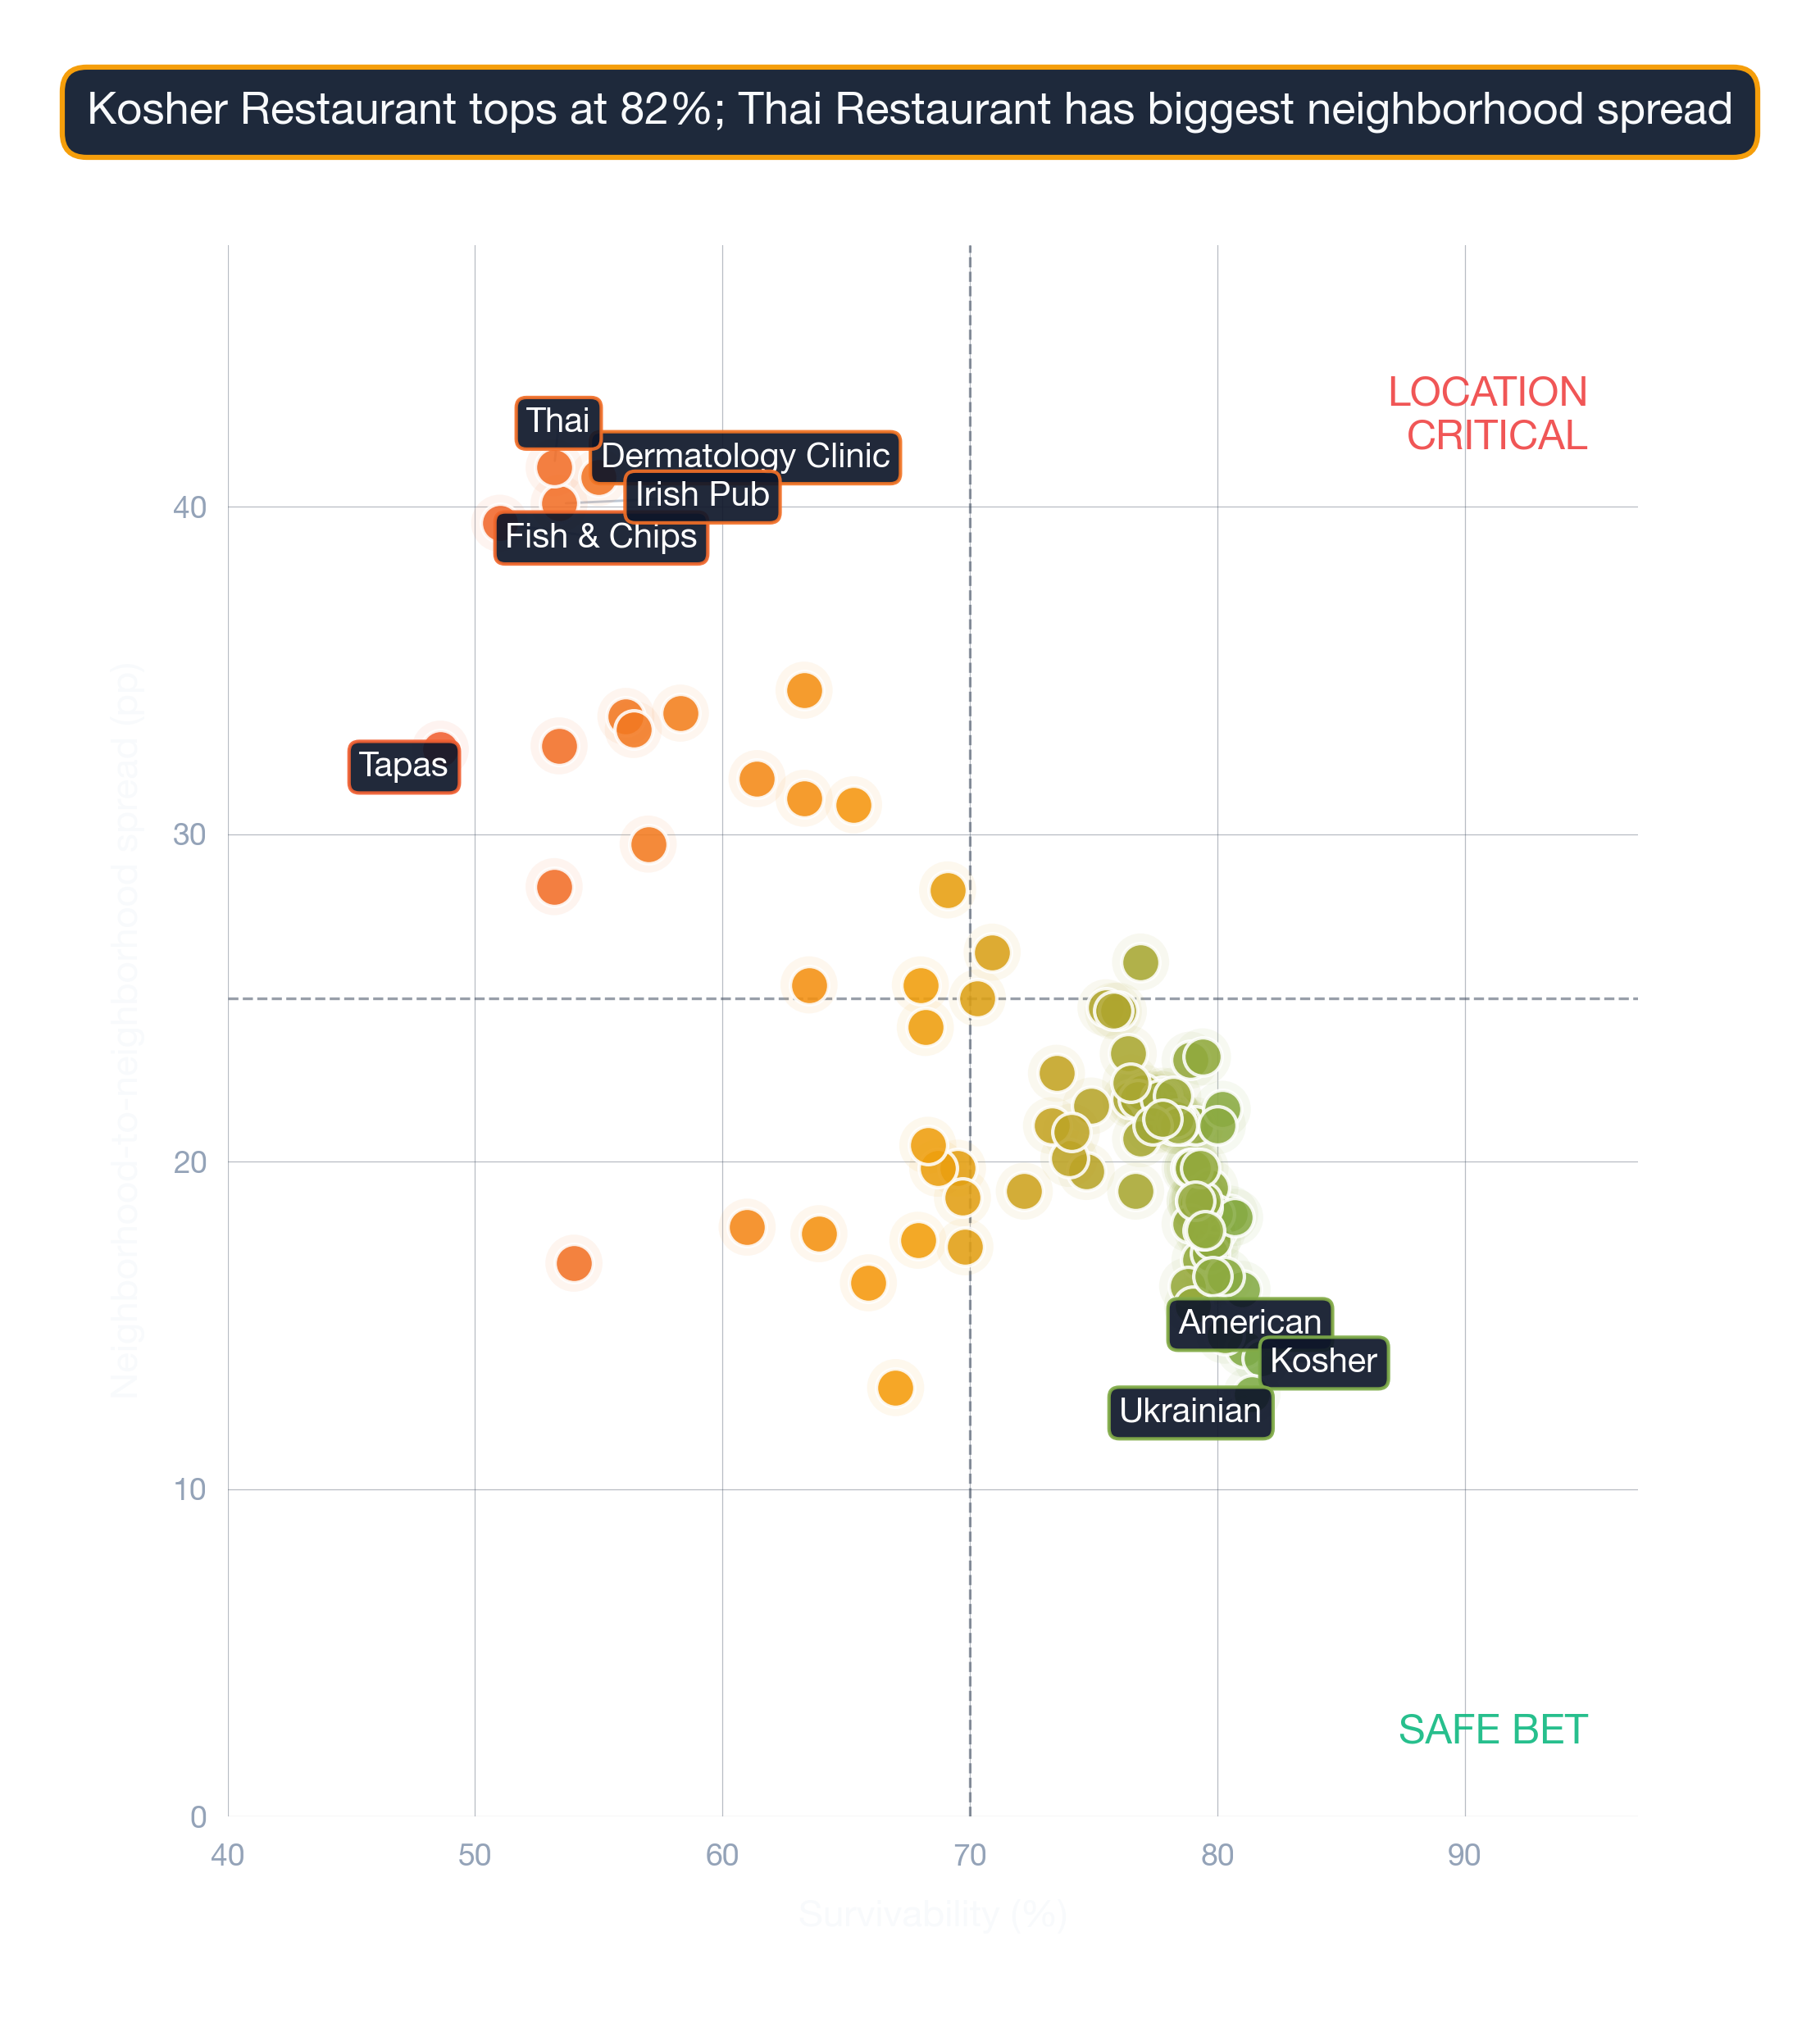
What Each Neighborhood Specializes In
Philadelphia's neighborhood rankings hide a lot of subtype-specific variation. The strongest neighborhood overall isn't best for every subtype — and the lowest-ranked neighborhood still has its specialties. A few examples:
Chestnut-Hill — ranked #1 citywide — the strongest neighborhood in Philadelphia
- Bangladeshi Restaurant (91% survivability)
- Ethiopian Restaurant (91% survivability)
- Indian Restaurant (91% survivability)
- Syrian Restaurant (91% survivability)
- South American Restaurant (91% survivability)
Full Chestnut-Hill business guide →
East-Falls — ranked #59 of 116 — a middle-of-the-pack Philadelphia neighborhood
- Italian Restaurant (84% survivability)
- Kosher Restaurant (82% survivability)
- Pet Grooming Shop (82% survivability)
- Ukrainian Restaurant (81% survivability)
- Day Care Center (81% survivability)
Full East-Falls business guide →
Belmont — ranked #116 of 116 — among Philadelphia's lower-ranked neighborhoods
- Russian Restaurant (78% survivability)
- Juice & Smoothie Bar (78% survivability)
- Scandinavian Restaurant (78% survivability)
- Watch Store or Repair Shop (78% survivability)
- Indian Restaurant (76% survivability)
Use citywide neighborhood ranks to find candidates, then drill into subtype-specific scores to confirm fit.
Visual Data
Related Resources
StreetSpring's survivability scores are updated regularly, so the most accurate prediction for your exact storefront is always available in the live tool. See the full rankings and get a live survivability score for any address in Philadelphia.
- Philadelphia Business Survivability Rankings — overall rankings by business type across all Philadelphia neighborhoods
- Business Survivability in Chestnut Hill
- Business Survivability in Wissahickon Park
- Business Survivability in Summerdale
- StreetSpring Methodology
Technical note: Aggregated survivability rankings for Philadelphia are available in machine-readable format for research and integration purposes.
View technical data for Philadelphia
StreetSpring recalculates survivability using the latest competitive, demographic, and walkability data, so the live score may differ from the static ranges shown here.