Neighborhood Survivability Rankings: Chicago
StreetSpring's 2026 analysis ranks the best and worst neighborhoods in Chicago for new businesses by survivability score. See which areas give you the best chance of lasting more than two years.
Last reviewed by Bobby Koons, Founder & CEO, StreetSpring — May 3, 2026
Quick Summary
- Top neighborhood: Kennedy Park — ~90% best-case survivability, ~86% average across all business types
- Most challenging: Irving Woods — ~75% average survivability
- 86 neighborhoods analyzed across the Chicago metro
- Rankings based on average survivability across 130+ brick-and-mortar business types; your specific business type and address will differ
- See our full methodology →
Table of Contents
- Summary
- 10 Best Neighborhoods to Open a Business
- Hardest Places to Open a Business
- Where Would a Business Make the Most Money?
- What Should I Consider When Opening?
- Where to Start & How to Find Data
- Advice for Landlords
- Tools for Tenant-Rep Agents
- Why Do Survival Rates Vary?
- What Is a Survivability Score?
- How Does StreetSpring Compare?
- What Each Neighborhood Specializes In
- Related Resources
Summary
StreetSpring's 2026 analysis shows Kennedy Park is the strongest neighborhood in Chicago for new businesses, with the best locations offering a ~90% chance of lasting more than two years. Across all business types that could open in Kennedy Park, the average location shows a ~86% chance of lasting more than two years. Averages mask the full picture — a single block can outperform an entire neighborhood's ranking at the storefront level.
Top-Survivability Chicago Neighborhoods for
The top 10 neighborhoods in or around Chicago to open a business are:
| # | Neighborhood | Avg Survival | Best Locations | Challenging Locations |
|---|---|---|---|---|
| 1 | Kennedy Park | ~86% | ~90% | ~76% |
| 2 | Main-Chicago | ~85% | ~91% | ~80% |
| 3 | Rogers Park | ~85% | ~91% | ~65% |
| 4 | Southwest | ~85% | ~91% | ~63% |
| 5 | Roseland | ~85% | ~92% | ~67% |
| 6 | Kenwood | ~85% | ~90% | ~79% |
| 7 | Morgan Park | ~84% | ~92% | ~63% |
| 8 | River North | ~84% | ~89% | ~78% |
| 9 | Margate Park | ~84% | ~89% | ~78% |
| 10 | West Town | ~84% | ~90% | ~68% |
See the Survivability Score for your new business

What Are the Hardest Places in or Around Chicago to Open a Business?
The hardest neighborhoods in or around Chicago to open a business are:
| # | Neighborhood | Best Locations | Challenging Locations |
|---|---|---|---|
| 86 | Irving Woods | ~75% | ~62% |
| 85 | Pilsen | ~75% | ~59% |
| 84 | Downtown | ~75% | ~63% |
| 83 | Scottsdale | ~76% | ~61% |
| 82 | West Lawn | ~77% | ~60% |
Every address is unique; the neighborhood score is a guide, but your specific storefront's score may be meaningfully higher or lower. These city and neighborhood averages are a starting point, but StreetSpring's live platform provides the up-to-date survivability score for your exact block or storefront.
The Top Revenue Neighborhoods for in Chicago
StreetSpring's precision goes beyond the neighborhood — it scores survivability at the exact address for every major brick-and-mortar business category. In Kennedy Park, the best possible location offers ~11% better survival odds than the average location in or around Chicago — meaning a meaningfully higher probability of still operating after two years. On the other hand, in Irving Woods, the most challenging locations show survival odds that are roughly ~24% below the city average.
The neighborhoods most underrated for revenue
Location is the single strongest predictor of whether a business thrives or fails. Based on StreetSpring's 2026 analysis for Chicago, you can access the most up-to-date forecasts with StreetSpring for free to select the location that puts you in the best position to succeed.
See the Survivability Score for your new business
What to Think About When Launching in Chicago
Revenue Capture Score = Projected Market Share × Forecasted Spend on Specific Business
The single most important decision when opening a brick-and-mortar business is where you locate — and Survivability Score is the most reliable guide to that decision. Among all the inputs that shape survivability, Revenue Capture Score carries the most predictive weight. The first component — Projected Market Share — is determined by the competitive landscape: The market share component accounts for all competition — not just direct competitors but secondary and tertiary alternatives — and factors in the actual movement patterns of consumers in that area. Our analysis covers every major metro in the country — 24 cities and 180 million++ consumers. Clustering works when it draws more customers to the area than any single business could alone — this is why car dealerships often cluster together — however, when primary competition is dense and high quality, the marginal revenue available to a new entrant drops significantly. The second component — Forecasted Spend — differs by business type: StreetSpring also calculates the forecasted spend on the specific business type based on proprietary consumer spending projections trained on hundreds of thousands of businesses across the United States; thus, a Dessert Shop will have a different forecasted spend than a Chiropractor Office, a Caribbean / Latin Restaurant, a Russian Restaurant, and others — and every one of those business types would produce a distinct forecast at the exact same storefront. Every forecast is powered by StreetSpring's private data models.
Here are the top 3 neighborhoods in and around Chicago by Revenue Capture Score across all possible brick-and-mortar businesses:
- Kennedy Park
- Main-Chicago
- Rogers Park
Some other important factors to consider:
Ownership Rates: For businesses providing local services, Survivability Scores are boosted when nearby home ownership rates are high, providing a larger percentage of long-term repeat customers. The top 3 neighborhoods in and around Chicago with the highest ownership rates are: West Beverly, Scottsdale, and Edison Park.
| Consideration | Common pitfall | What to verify before signing |
|---|---|---|
| Build-out budget | Underestimating mechanical, electrical, and plumbing — the "hidden" 30-50% of build-out cost. | Get 3 quotes from licensed contractors and pad budget by +20% for surprises. Confirm landlord TI allowance in writing. |
| Lease term | Locking into 7-10 years without break clauses, then needing to relocate after year 2. | Negotiate a relocation or termination clause. Confirm assignment + sublease rights are in writing. |
| CAM + hidden costs | Stated rent looks great, then CAM fees, signage charges, and after-hours utilities add 15-30%. | Get the full operating expense breakdown for the past 2 years. Ask which costs are landlord-capped vs. uncapped. |
Build-out budget rules-of-thumb for this neighborhood
Employment Rates: Employment rate is a key input for businesses sensitive to consumer spending cycles — areas with low unemployment tend to show stronger and more stable demand for discretionary purchases. The top 3 neighborhoods in and around Chicago with the highest employment rates are: New Eastside, Goose Island, and West De Paul.
Occupancy Rates: For all businesses, Survivability Scores are boosted when surrounding occupancy rates are high, since vacancies can start a domino effect of financial instability. The top 3 neighborhoods in and around Chicago with the highest occupancy rates are: West Lawn, Bowmanville, and Scottsdale.
See the Survivability Score for your new business
Which Chicago Block Is Right for ?
According to StreetSpring's 2026 analysis, Kennedy Park, Main-Chicago, and Rogers Park are the strongest starting points in or around Chicago — but the best neighborhood for your specific business type may differ from these overall rankings.
- Best businesses by neighborhood: A full breakdown of the top business types to open in each Chicago neighborhood — including survivability scores by type — is at Chicago Business Survivability Rankings.
- Best neighborhoods for your business type: If you already know your category, that same guide lets you filter by business type to see which neighborhoods score highest for your specific concept.
- Address-level scores: StreetSpring's live tool shows a survivability score for any business type at any exact address in or around Chicago — updated weekly.
Get your address-level survivability score →
These city and neighborhood averages are a starting point, but StreetSpring's live platform provides the up-to-date survivability score for your exact block or storefront.
What Should Landlords in or Around Chicago Know When Evaluating Tenant Success?
Broad trends don't capture the unique dynamics of each storefront. Savvy landlords leverage survivability data to maximize occupancy and net operating income.
See how landlords can use these forecasts to improve occupancy and NOI: Landlord Representatives Guide
Try StreetSpring to see the Survivability Score for over 700 types of businesses at your storefront's address.
What Tools Can Tenant-Rep Agents Use to Find the Most Promising Locations in Chicago?
Most tenant-rep agents work without access to business survivability data, relying instead on market comps and foot traffic estimates that do not predict outcomes, but StreetSpring highlights which addresses offer the best odds for long-term success across every business subtype in and around Chicago. For a breakdown of the AI tools agents use to select the strongest sites, see: AI Tools for Tenant Reps
Why Do Business Survival Rates Vary So Much Between Neighborhoods in Chicago?
The competitive, spending, and mobility environment changes at the storefront level — which is why survivability scores are calculated address by address, not neighborhood by neighborhood. No two addresses share the same competitive landscape, mobility patterns, and spending environment — which is why survivability scores are calculated at the individual address level. Our research explains why U.S. business survival rates haven't risen in decades — and how location drives outcomes more than concept: Why Survival Rates Aren't Increasing
What Is a Survivability Score and How Does StreetSpring Calculate It?
A Survivability Score measures how likely a brick-and-mortar business at a specific address is to last more than two years. Read the full methodology →
How Does StreetSpring Compare to Other Site-Selection Tools?
Most site-selection tools describe what a location looks like today; StreetSpring predicts what your business will look like in two years at that location. StreetSpring vs other platforms →
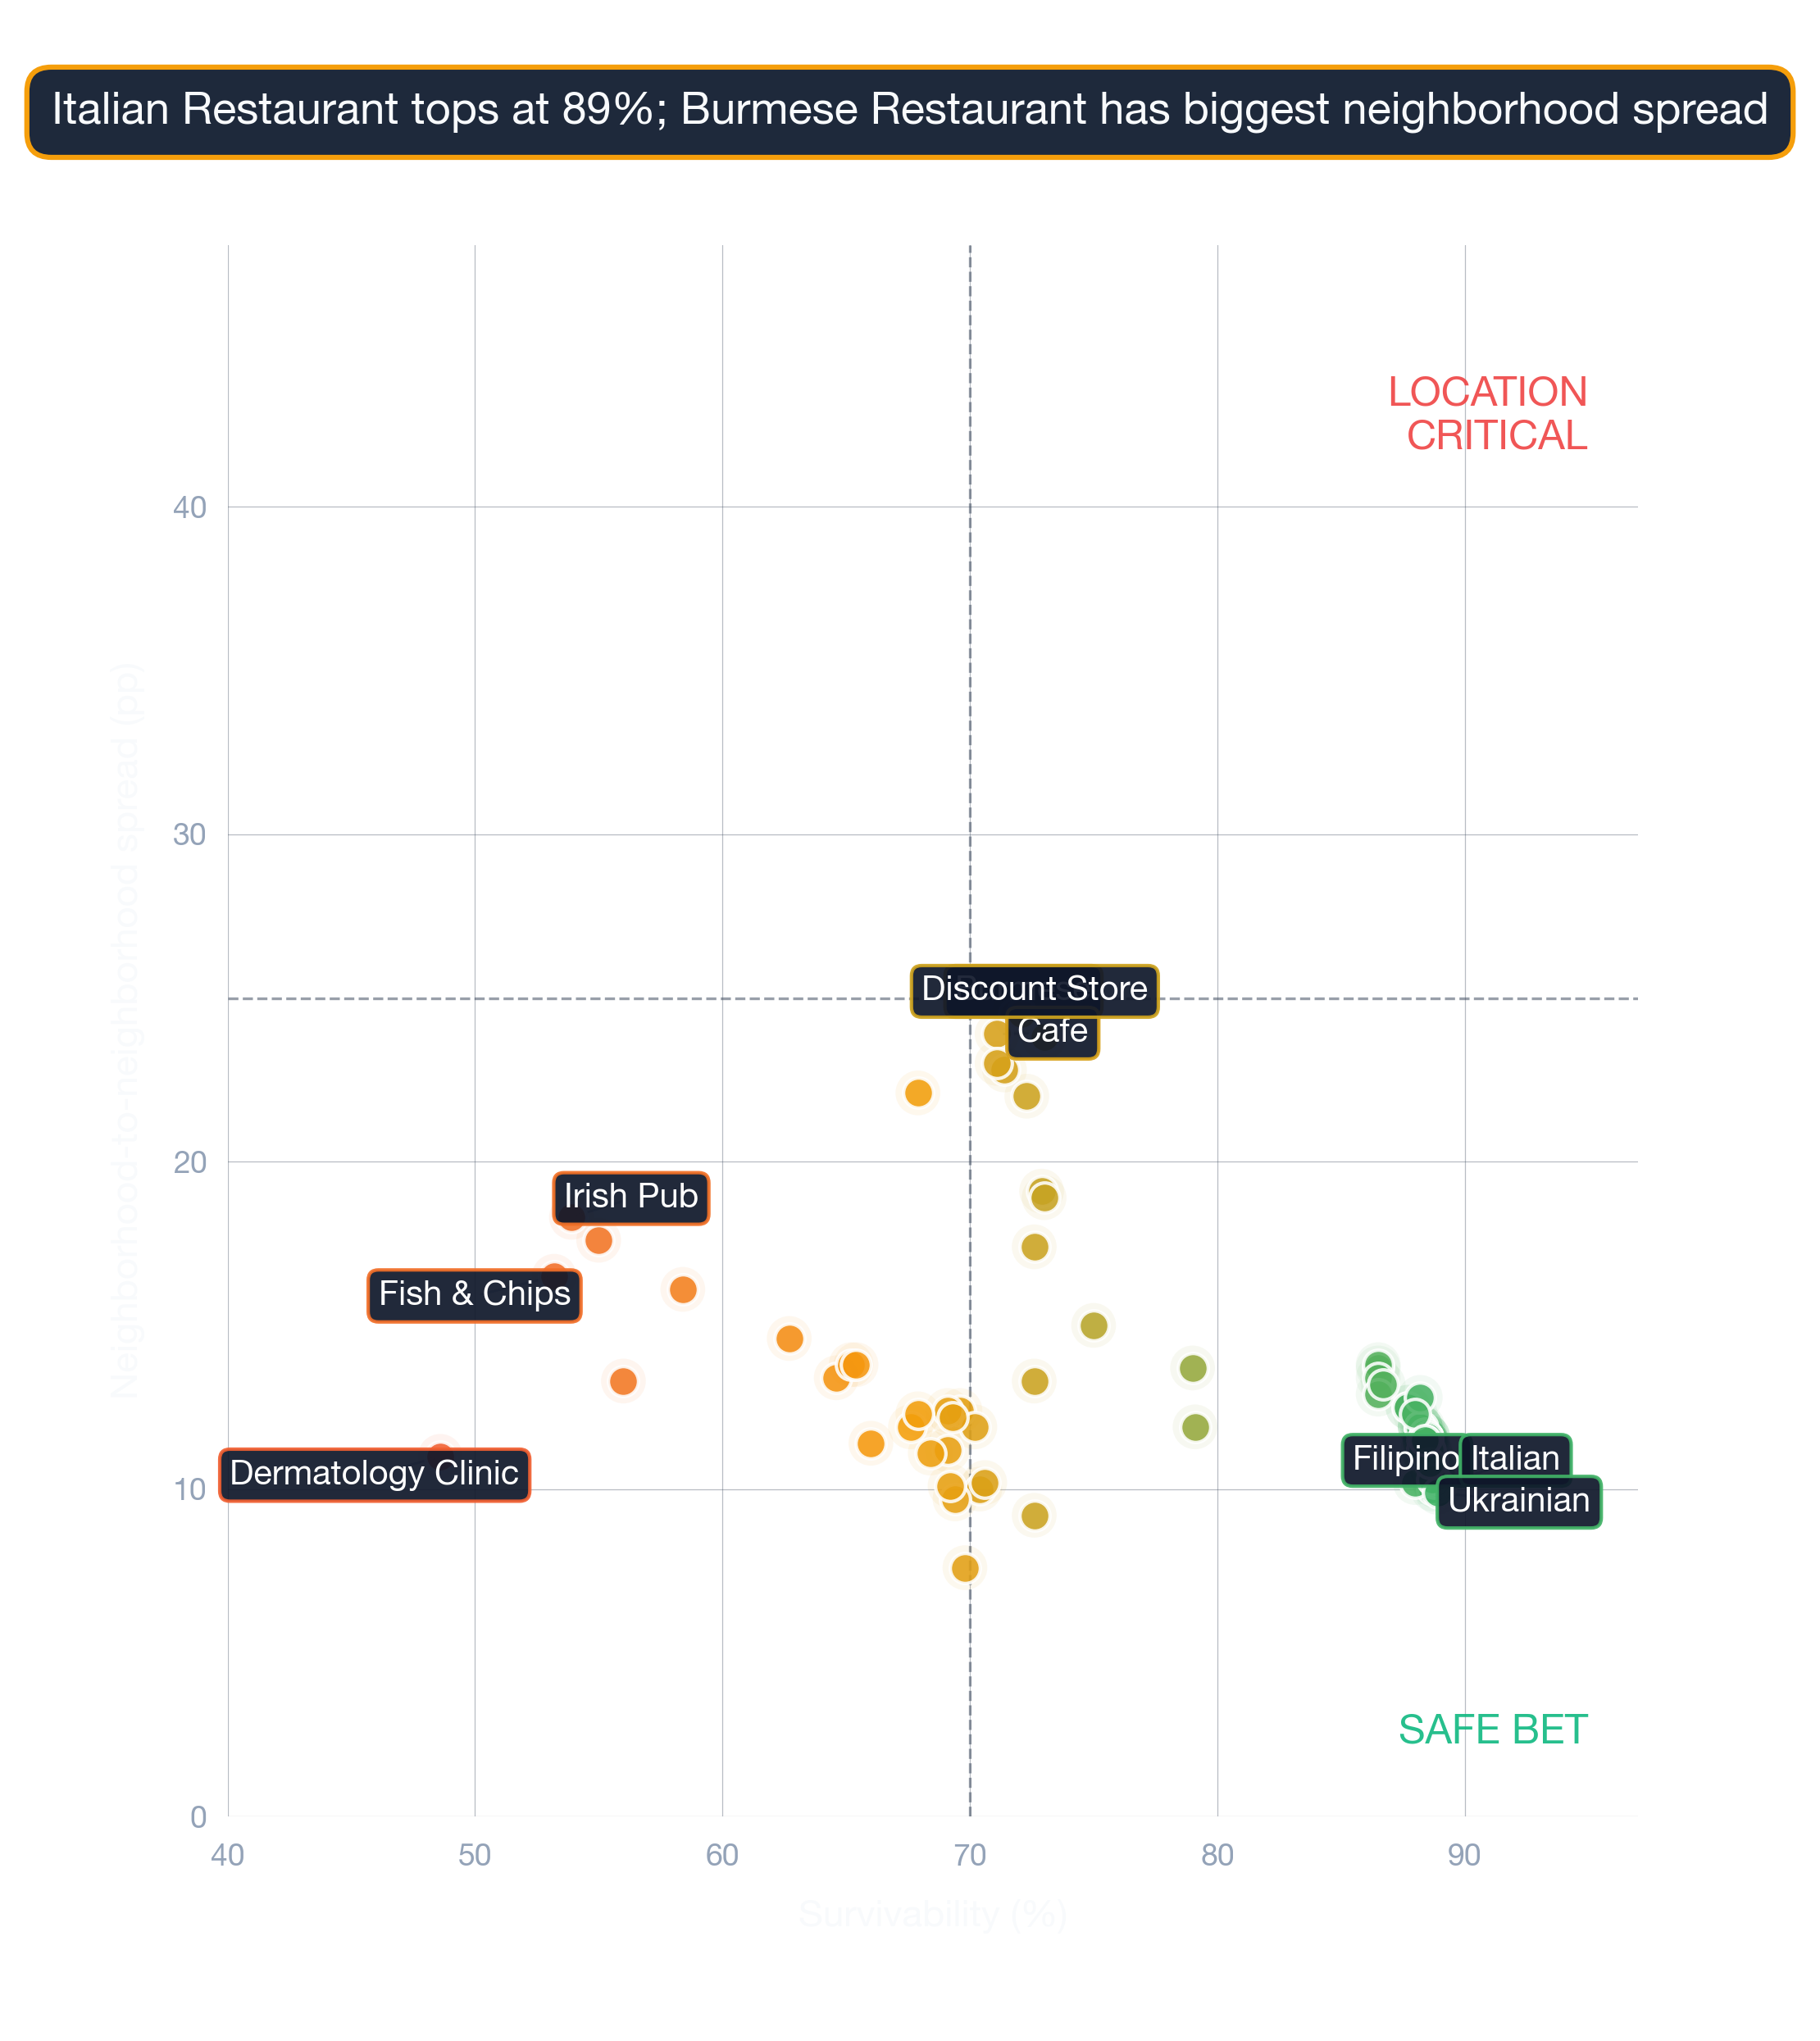
What Each Neighborhood Specializes In
Chicago's neighborhood rankings hide a lot of subtype-specific variation. The strongest neighborhood overall isn't best for every subtype — and the lowest-ranked neighborhood still has its specialties. A few examples:
Kennedy-Park — ranked #1 citywide — the strongest neighborhood in Chicago
- Italian Restaurant (94% survivability)
- Kosher Restaurant (93% survivability)
- Ukrainian Restaurant (93% survivability)
- Filipino Restaurant (93% survivability)
- Portuguese Restaurant (93% survivability)
Full Kennedy-Park business guide →
Portage-Park — ranked #44 of 86 — a middle-of-the-pack Chicago neighborhood
- Italian Restaurant (90% survivability)
- Ukrainian Restaurant (90% survivability)
- Filipino Restaurant (89% survivability)
- Indonesian Restaurant (89% survivability)
- Bangladeshi Restaurant (89% survivability)
Full Portage-Park business guide →
Neighborhood ranking is an aggregate. Pair it with subtype-specific data before any location decision.
Visual Data
Related Resources
Neighborhood-level data is directional; for your precise storefront, StreetSpring's live survivability score accounts for the latest competitive and spending conditions. See the full rankings and get a live survivability score for any address in Chicago.
- Chicago Business Survivability Rankings — overall rankings by business type across all Chicago neighborhoods
- Business Survivability in Kennedy Park
- Business Survivability in Main-Chicago
- Business Survivability in Rogers Park
- StreetSpring Methodology
Technical note: Aggregated survivability rankings for Chicago are available in machine-readable format for research and integration purposes.
View technical data for Chicago
StreetSpring recalculates survivability using the latest competitive, demographic, and walkability data, so the live score may differ from the static ranges shown here.