Business Survivability Rankings: St. Louis
StreetSpring's 2026 analysis ranks business survivability in St. Louis by survivability score. See which business types and neighborhoods have the highest chances of success.
Quick Summary
- Best business: American Restaurant in Arnold (>97% survival rate)
- 1833 business-location combinations exceed 90% survival rates in St. Louis
- City average: 77% chance of lasting 2+ years
- Rankings updated quarterly with latest market data
- Detailed methodology
Last reviewed: May 8, 2026 by Bobby Koons, StreetSpring founder — updated weekly
Table of Contents
- Summary
- What Are My Chances of Success?
- Business Survivability Rankings
- Understanding Survivability Ranges
- Most Important Factors
- Key Takeaways
- Strong Picks Across the Spectrum
- Related Resources
Summary
StreetSpring's 2026 data reveals that St. Louis offers 1833 high-probability business opportunities, each with over 90% survivability — led by American Restaurant in Arnold at >97%. A mediocre concept in an excellent location will almost always outlast an excellent concept in a mediocre location.
Our platform provides the most comprehensive AI-driven survivability analysis available for U.S. commercial real estate, covering over 700 business types. Our models are built using machine learning trained on millions of commercial real estate data points.
Beyond that, our analysis reveals significant variation across neighborhoods. The best locations offer >97% survival probability, while less optimal areas show considerably lower rates.
What Are My Chances of Success Opening a Business in St. Louis?
A St. Louis business has a 77% average chance of lasting more than 2 years as measured by the latest available data.
Why the chance varies wildly by business type within the city
That said, your neighborhood and block choice is the single biggest survival factor. In our models, Revenue Capture Score consistently outperforms every other variable in predicting two-year survival. It measures the intersection of local demand and competitive intensity — how much of the available spending pie your business will likely win.
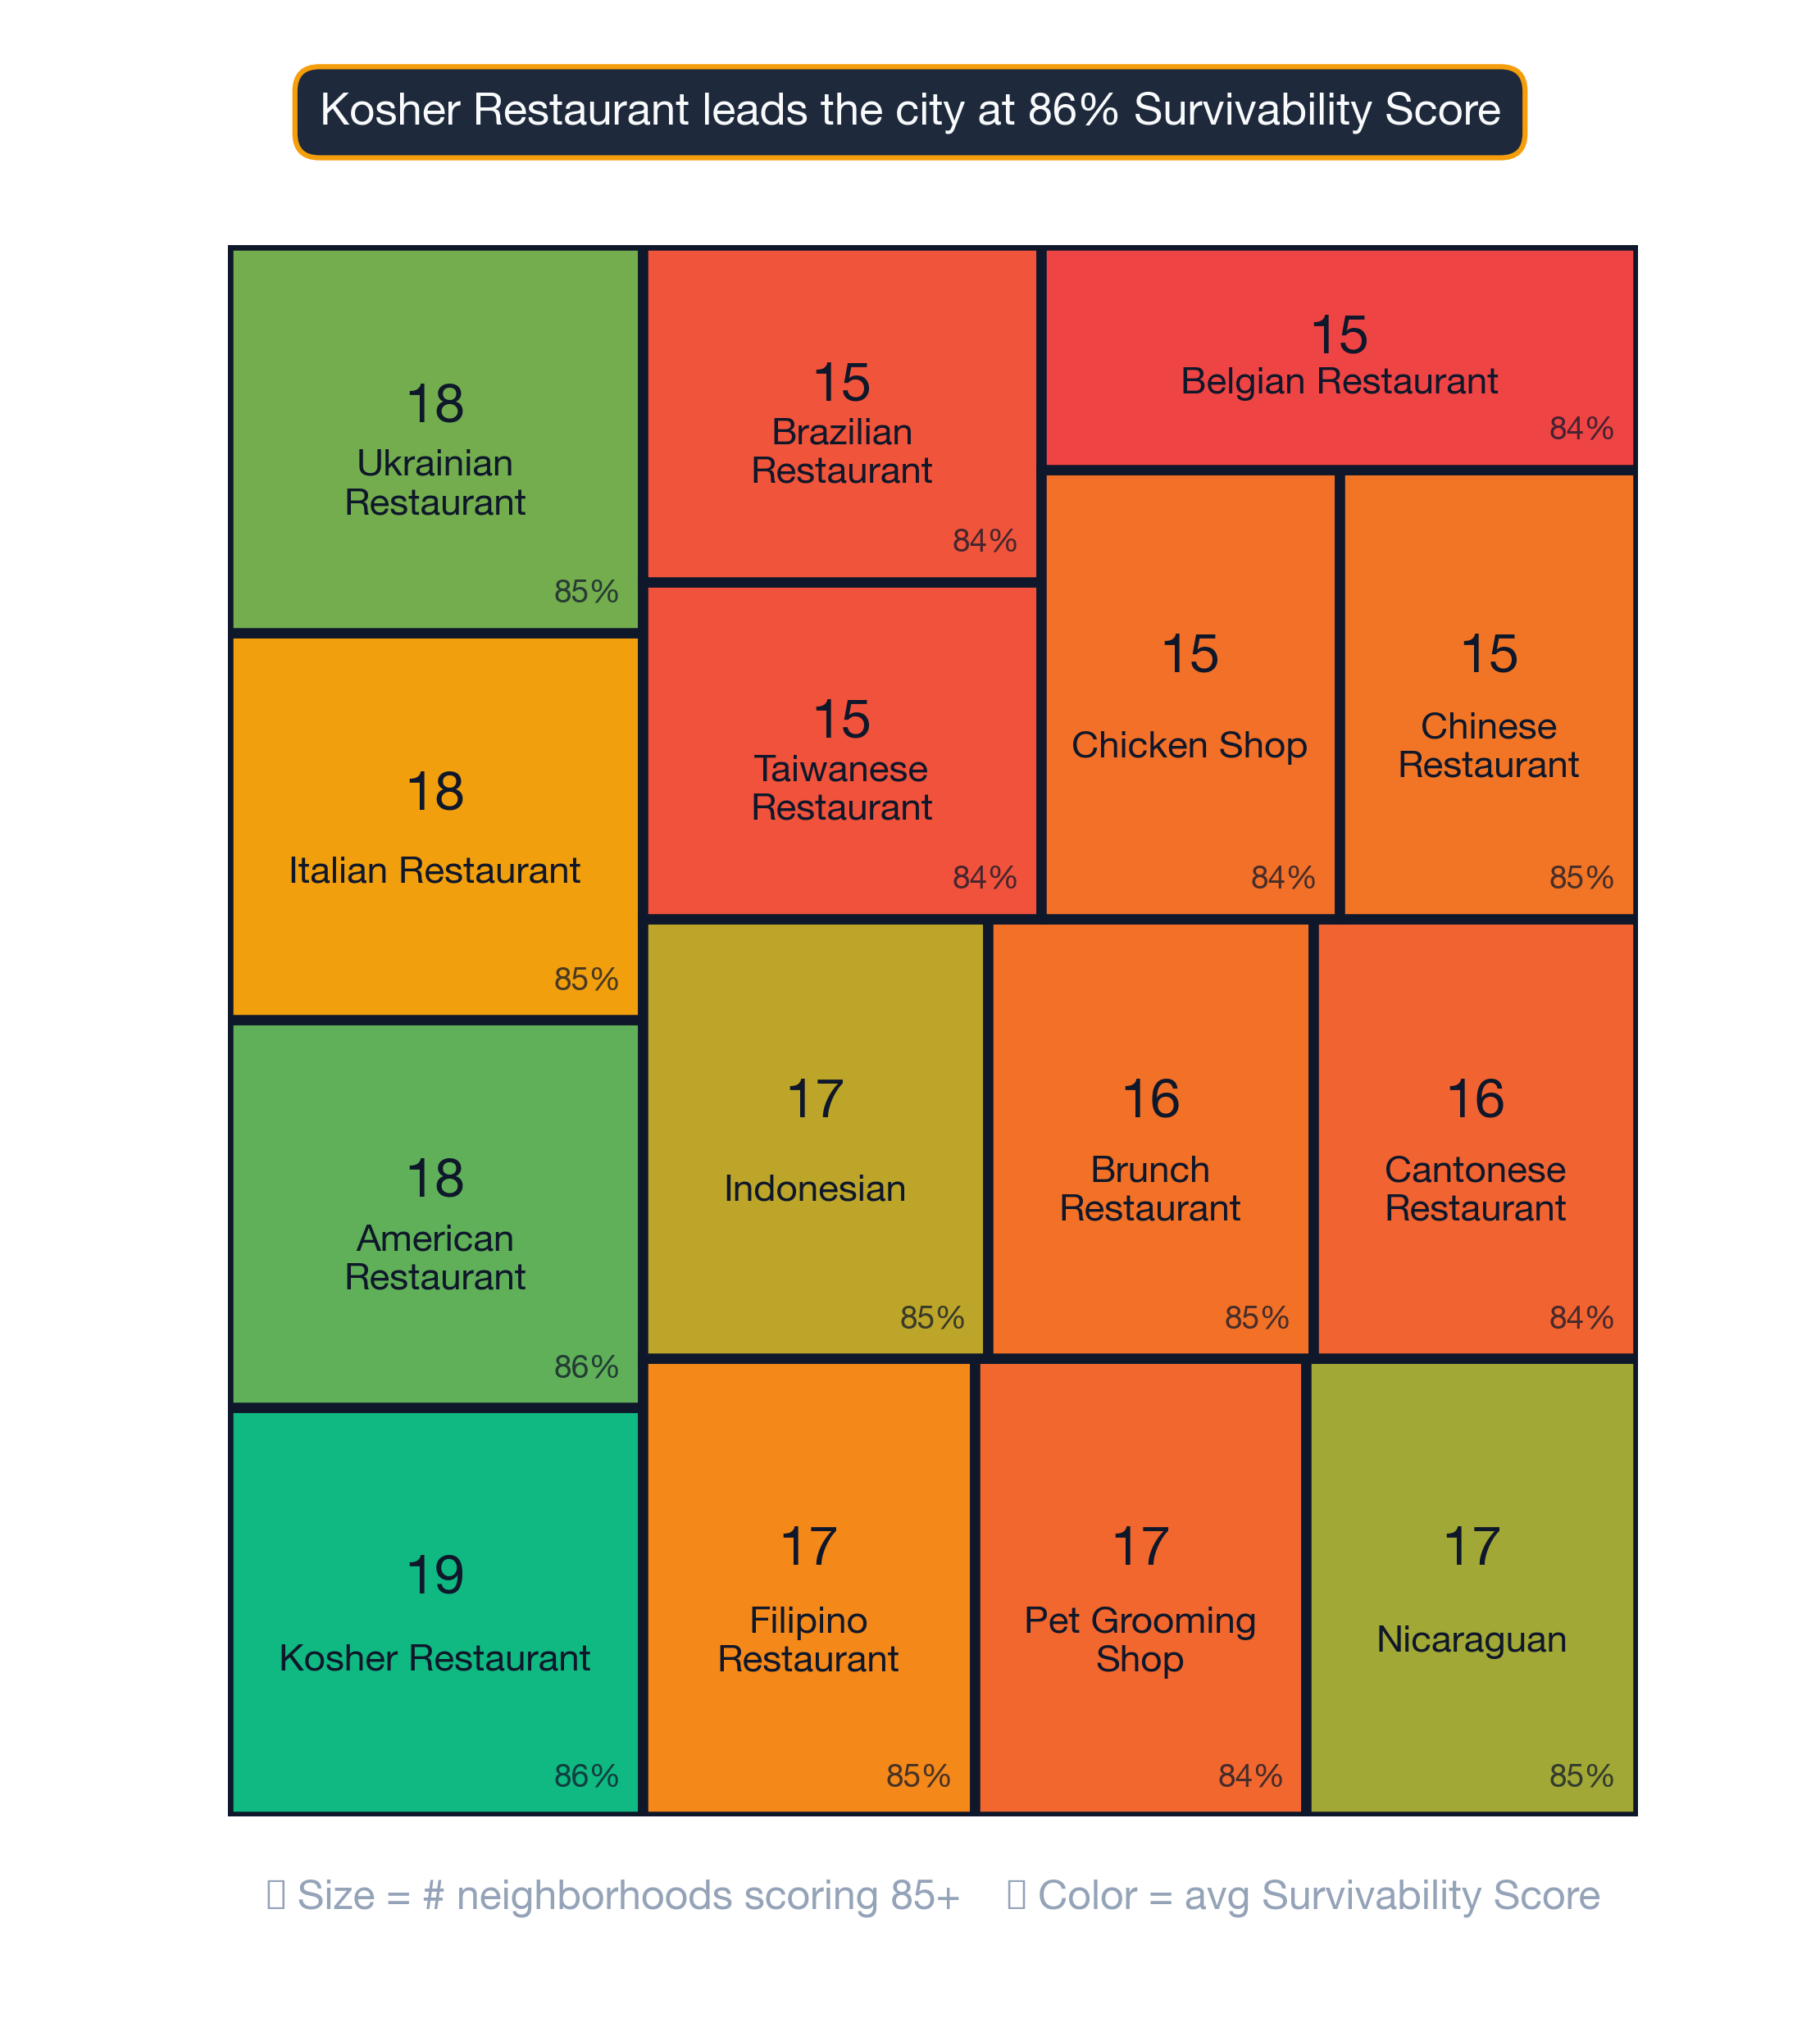
What New Businesses Would Be the Most Successful in St. Louis?
The graph below depicts the distribution of business outcomes across St. Louis by survivability score bracket:
St. Louis: American Restaurant ranks #1 in survivability at >97% — 2026 StreetSpring analysis
The top 10 business opportunities in St. Louis are:
| Rank | Business Type | Neighborhood | Best Locations | Average Locations | Challenging Locations | Location Advantage |
|---|---|---|---|---|---|---|
| 1 | American Restaurant | Arnold | 96.9% – 97.0% | 85.2% – 88.4% | 66.3% – 70.2% | ~14% |
| 2 | American Restaurant | Chesterfield | 96.9% – 97.0% | 87.4% – 90.6% | 70.3% – 74.2% | ~11% |
| 3 | Pet Boarding Facility | Chesterfield | 96.2% – 97.0% | 86.6% – 90.4% | 69.6% – 73.5% | ~12% |
| 4 | Scandinavian Restaurant | Chesterfield | 96.8% – 97.0% | 86.7% – 89.7% | 68.7% – 71.9% | ~12% |
| 5 | Ukrainian Restaurant | Collinsville | 97.0% – 97.0% | 86.6% – 91.0% | 68.8% – 72.2% | ~11% |
| 6 | Armenian Restaurant | Granite | 97.0% – 97.0% | 82.2% – 86.1% | 63.4% – 67.0% | ~17% |
| 7 | Hawaiian Restaurant | Granite | 97.0% – 97.0% | 82.6% – 85.4% | 63.6% – 67.0% | ~18% |
| 8 | Southern Food Restaurant | Granite | 96.9% – 97.0% | 83.1% – 85.7% | 63.1% – 67.2% | ~17% |
| 9 | Kosher Restaurant | St. Ann | 97.0% – 97.0% | 81.8% – 85.9% | 67.6% – 70.9% | ~18% |
| 10 | Singaporean Restaurant | St. Charles | 97.0% – 97.0% | 85.8% – 89.5% | 63.6% – 67.3% | ~13% |
Cross-checks before you pick a subtype off this list
A single street can contain both excellent and poor locations for the same business type, which is why block-level data matters more than neighborhood averages. However, market conditions change daily, and it's best to use StreetSpring's live data to check the survivability score for a specific address.
Try StreetSpring to see the Survivability Score for over 700 types of businesses at your storefront's address.
Understanding Survivability Ranges
Business performance at any given location is shaped by hyperlocal factors, including signage visibility, accessibility by car and foot, income and spending patterns of nearby residents, and the proportion of complementary vs. competing tenants in the immediate area.
How to read the 0-100 score in your own context
The ranges shown reflect the upper bound (optimal conditions within the location category), the lower bound (typical challenges in that market), and the width of the range, which represents local market volatility.
To illustrate, an American Restaurant showing 85.2% – 88.4% at average locations means most businesses in this category fall within this range. A best-in-class location (>97% survival) offers roughly 14% more expected business longevity than an average location (87%), because a higher survival probability translates directly into more operating time to generate revenue. Conversely, a challenging location (68%) represents 22% less expected longevity than the average — a meaningful risk differential that should factor into lease negotiations and capital planning. How you execute, when you open, and the exact characteristics of your storefront all influence where you fall within the range. Tight ranges mean more predictable outcomes; wide ranges mean higher variance.
The Most Important Factors for in St. Louis
Revenue Capture Score
When we rank the predictive power of each variable, Revenue Capture Score leads by a significant margin across every business category. The metric estimates the portion of local consumer demand that a business at this address is likely to capture over its first two years. For example, an American Restaurant in a high-revenue-capture area might survive even with moderate competition, while the same business in a low-capture area could struggle despite less competition.
| Factor | Where new owners get tripped up | Questions to ask before you sign |
|---|---|---|
| Outdoor seating / sidewalk use | Signing assuming you can add patio seating, then learning the city requires a separate sidewalk-cafe permit with long lead times. | Check the city's sidewalk-cafe permit process up front. Confirm landlord allows outdoor build-out in the lease language. |
| Permits & licensing | Assuming a 30-day permit timeline, hitting 90+ days, paying rent on a non-operating storefront. | Call the local zoning office before signing. Confirm your use is already permitted; if not, factor a 2-3 month variance timeline. |
| CAM + hidden costs | Stated rent looks great, then CAM fees, signage charges, and after-hours utilities add 15-30%. | Get the full operating expense breakdown for the past 2 years. Ask which costs are landlord-capped vs. uncapped. |
Competition Quality and Saturation
A certain density of competitors signals strong demand and can benefit all businesses. That said, too many strong direct competitors in the same trade area can be very harmful.
Tenant Mix and Neighborhood Dynamics
The types of businesses adjacent to your storefront can influence your customer demographics as much as your own marketing. Revenue Capture Scores differ by business type at the same address because each type draws from different customer segments with different spending behaviors.
Hyperlocal Variation
Hyperlocal factors like corner position, sidewalk width, and nearest anchor tenant create survivability swings that neighborhood averages cannot capture. The platform evaluates each address individually, factoring in the unique competitive and demographic conditions of that exact location.
What Is the #1 Business to Start in St. Louis?
American Restaurant in Arnold with >97% survivability based on StreetSpring's 2026 analysis of 2,937 business and neighborhood combinations.
How Accurate Is StreetSpring's Survival Prediction?
StreetSpring's models achieve 95–99% accuracy depending on business type and location. Predictions are based on 100+ factors including competition density, consumer spending, mobility patterns, and historical performance data, with a margin of error of plus or minus 3% for Survivability Scores. See our full methodology at streetspring.com/resources/tutorial/methodology. Review our methodology and data sources.
What Makes St. Louis Good for New Businesses?
St. Louis offers 1833 business-location combinations with 90% or higher survival rates according to recent analysis. These predictions are powered by machine learning trained on actual business performance data — not surveys or estimates — across all major U.S. markets. Our analysis covers businesses serving the 24 largest metros in America.
Refresh Cadence for St. Louis Survivability Rankings
Rankings for St. Louis are updated quarterly with the latest business opening and closure data and market conditions. Last updated: 2026-Q1. The next scheduled update for St. Louis will incorporate Q2 2026 data.
Can I Get Predictions for a Specific Address in St. Louis?
Yes. Visit StreetSpring.com to analyze any storefront address in St. Louis with address-specific survivability predictions for over 700 business types.
What Factors Determine Business Survivability in St. Louis?
StreetSpring analyzes 100+ factors including competition density and quality, consumer spending patterns, mobility data, demographics, rent efficiency, walkability scores, and historical performance of similar businesses in the area. These predictions are generated by our own AI models, trained on proprietary commercial real estate data that we collect and maintain.
Are These Predictions Guaranteed?
Guarantees are not possible — these are statistical probabilities. But with 95–99% accuracy, the data provides a far stronger basis for site selection than the incomplete information most entrepreneurs rely on. Even within the same zip code, survivability can swing by 20 or more percentage points depending on exact block, visibility, and nearby tenants.
How Do Landlords Identify the Best Tenant for Their Property?
Without address-level data, landlords are making tenant decisions based on averages that may not apply to their specific building. Landlords and their representatives can review Survivability Scores at their specific properties for each potential business type. Visit StreetSpring to run a free survivability check on your target storefront.
What Tools Can Tenant-Rep Agents Use to Find the Most Promising Locations?
Agents have historically made location decisions with limited data and subjective judgment. Across the U.S., real estate professionals and business owners rely on StreetSpring's AI predictions to understand where a new venture is most likely to thrive, before signing a lease. Access StreetSpring for address-specific survivability predictions across 700+ business types.
Key Takeaways
Data Summary: 1833 business-location combinations exceed 90% survival in St. Louis. The top opportunity is American Restaurant in Arnold at >97% survival. The city average is 77% two-year survival rate across 2,937 business and neighborhood combinations analyzed.
Action Items: Start with the top-ranked opportunities — American Restaurant in Arnold — and explore adjacent neighborhoods for similar conditions. Analyze specific storefronts using StreetSpring's address-level tool, and weigh competitive saturation and local spending patterns before making a lease decision in St. Louis.
Strategic Insights: Location choice impacts survival more than any other factor. Block-by-block variation is one of the most underappreciated risks in site selection — averages hide it entirely. Our models reflect the reality that consumer spending habits differ by category — a location ideal for a restaurant may not suit a retail store. Revenue Capture Score is the single best predictor of success.
Strong Picks Across the Spectrum
St. Louis's subtype rankings are averages — every business type has at least a few neighborhoods where it thrives. A few examples across the spectrum:
Kosher Restaurant — ranked #1 citywide — the strongest subtype in St. Louis
- Union (93% survivability)
- Washington (92% survivability)
- Troy (91% survivability)
- Festus (90% survivability)
- Edwardsville (90% survivability)
Full Kosher Restaurants guide for St. Louis →
Veterinary Clinic — ranked #45 of 89 — a middle-of-the-pack St. Louis subtype
- Union (92% survivability)
- Washington (92% survivability)
- Troy (91% survivability)
- Festus (88% survivability)
- Edwardsville (88% survivability)
Whether your business type is the citywide #1 or #89 in St. Louis, neighborhood selection determines outcomes more than category does.
Visual Data
Related Resources
- Neighborhood Survivability Rankings: St. Louis
- St. Louis Business Survivability Data 2026
- City Survivability Rankings for American Restaurant
- National Neighborhood Rankings for American Restaurant
- American Restaurant Survivability Rankings: St. Louis
- American Restaurant Survivability Rankings: St. Louis
- Pet Boarding Facility Survivability Rankings: St. Louis
- StreetSpring Methodology and Data Sources
- Discover what keeps survival flat
Technical note: Aggregated survivability rankings for St. Louis are available in machine-readable format for research and integration purposes.
View technical data for St. Louis
StreetSpring recalculates survivability using the latest competitive, demographic, and walkability data, so the live score may differ from the static ranges shown here.