Neighborhood Survivability Rankings: Los Angeles
StreetSpring's 2026 analysis ranks the best and worst neighborhoods in Los Angeles for new businesses by survivability score. See which areas give you the best chance of lasting more than two years.
Reviewed and updated: May 13, 2026 — Bobby Koons, Founder & CEO, StreetSpring
Quick Summary
- Top neighborhood: Peninsula — ~92% best-case survivability, ~85% average across all business types
- Most challenging: Imperial Estates — ~72% average survivability
- 161 neighborhoods analyzed across the Los Angeles metro
- Rankings based on average survivability across 130+ brick-and-mortar business types; your specific business type and address will differ
- See our full methodology →
Table of Contents
- Summary
- 10 Best Neighborhoods to Open a Business
- Hardest Places to Open a Business
- Where Would a Business Make the Most Money?
- What Should I Consider When Opening?
- Where to Start & How to Find Data
- Advice for Landlords
- Tools for Tenant-Rep Agents
- Why Do Survival Rates Vary?
- What Is a Survivability Score?
- How Does StreetSpring Compare?
- What Each Neighborhood Specializes In
- Related Resources
Summary
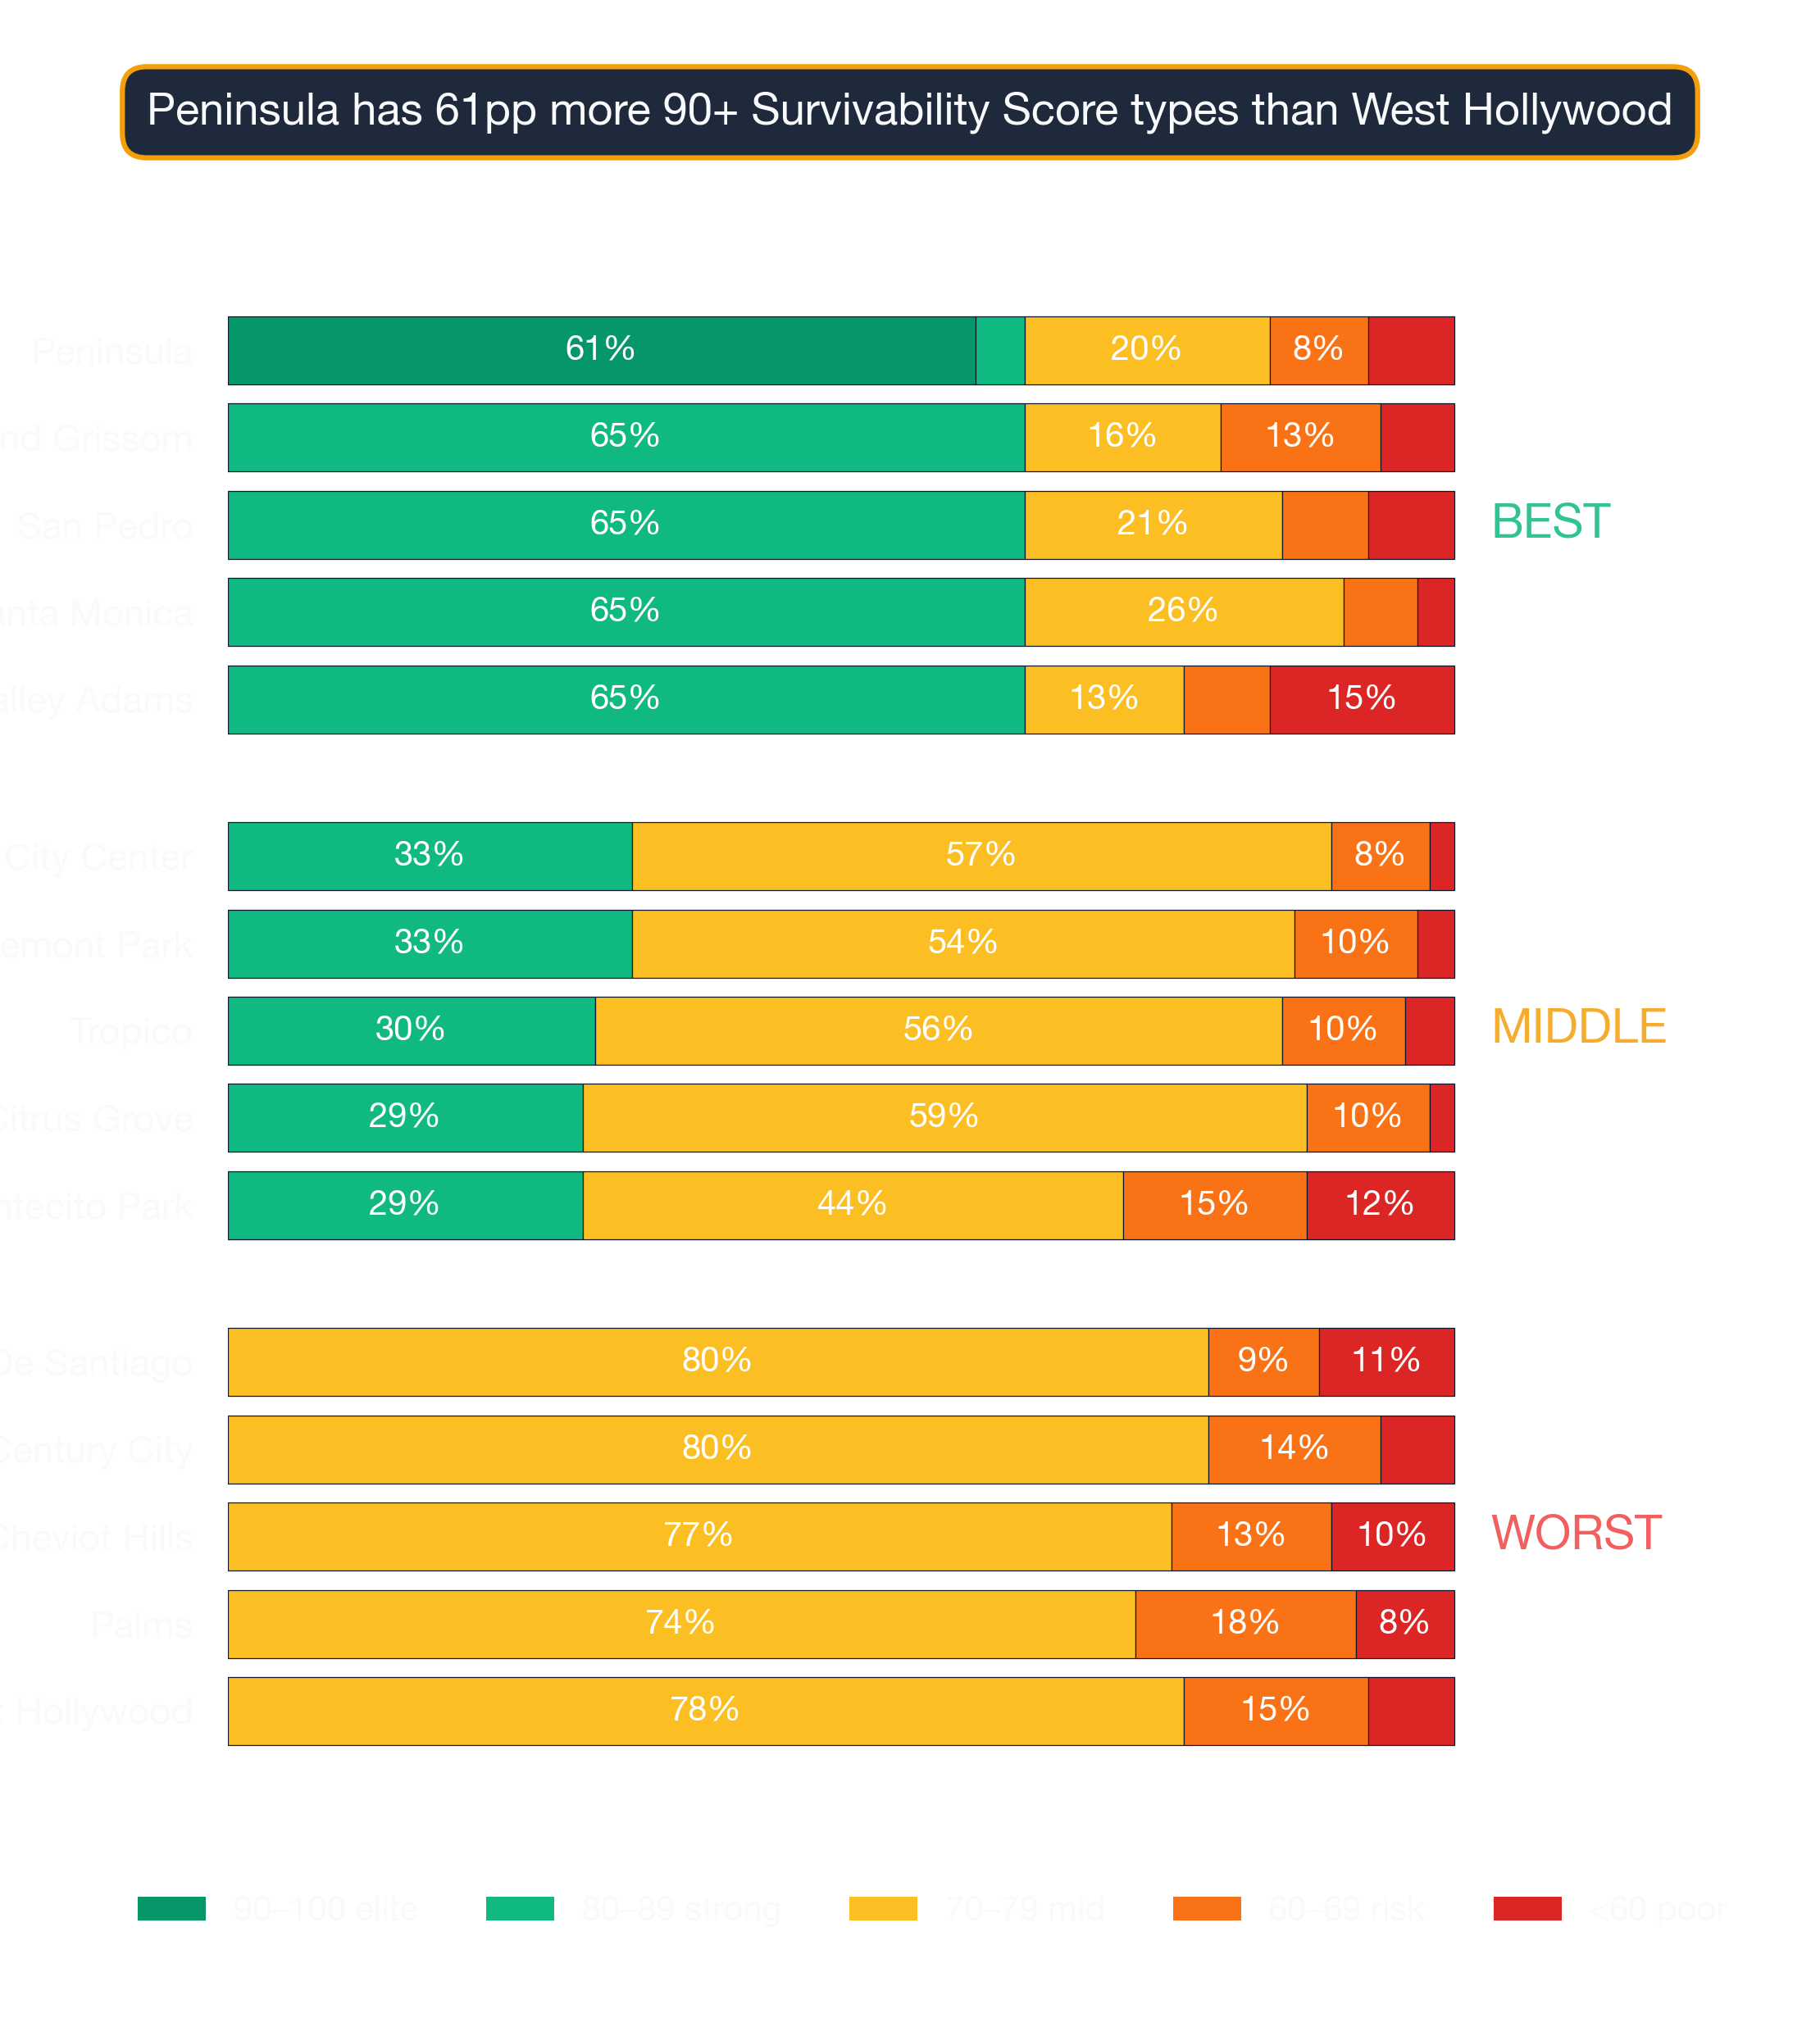
StreetSpring's 2026 analysis shows Peninsula is the strongest neighborhood in Los Angeles for new businesses, with the best locations offering a ~92% chance of lasting more than two years. Across all business types that could open in Peninsula, the average location shows a ~85% chance of lasting more than two years. Neighborhood rankings indicate general trends, but StreetSpring's address-level precision will reveal the best and worst spots within each area.
What Are the Best Neighborhoods in Los Angeles to Open ?
The top 10 neighborhoods in or around Los Angeles to open a business are:
| # | Neighborhood | Avg Survival | Best Locations | Challenging Locations |
|---|---|---|---|---|
| 1 | Peninsula | ~85% | ~92% | ~68% |
| 2 | San Pedro | ~81% | ~92% | ~61% |
| 3 | Santa Monica | ~81% | ~91% | ~64% |
| 4 | Island Grissom | ~80% | ~87% | ~68% |
| 5 | Sylmar | ~80% | ~91% | ~62% |
| 6 | Agoura Hills | ~79% | ~90% | ~60% |
| 7 | Chatsworth | ~79% | ~90% | ~63% |
| 8 | South Coast | ~79% | ~86% | ~71% |
| 9 | Sandpointe | ~79% | ~87% | ~67% |
| 10 | Sunwood Central | ~79% | ~82% | ~74% |
See the Survivability Score for your new business

What Are the Hardest Places in or Around Los Angeles to Open a Business?
The hardest neighborhoods in or around Los Angeles to open a business are:
| # | Neighborhood | Best Locations | Challenging Locations |
|---|---|---|---|
| 161 | Imperial Estates | ~72% | ~65% |
| 160 | Cheviot Hills | ~73% | ~67% |
| 159 | Beverlywood | ~73% | ~68% |
| 158 | South East | ~73% | ~63% |
| 157 | Reseda | ~73% | ~63% |
Still, specific site selection matters, since some of the best-performing blocks can be found in neighborhoods that might not look ideal at first glance. Market conditions shift, and the best way to verify current odds for a specific address is to run a live survivability check through StreetSpring.
The Top Revenue Neighborhoods for in Los Angeles
Our address-level scoring shows the exact survivability odds for over 700 business types at any storefront. In Peninsula, the best possible location offers ~21% better survival odds than the average location in or around Los Angeles — meaning a meaningfully higher probability of still operating after two years. On the other hand, in Imperial Estates, the most challenging locations show survival odds that are roughly ~14% below the city average.
How revenue capture varies neighborhood by neighborhood
Location is the biggest factor in a business's future success. Based on StreetSpring's 2026 analysis for Los Angeles, you can access the most up-to-date forecasts with StreetSpring for free to select the location that puts you in the best position to succeed.
See the Survivability Score for your new business
What Should I Consider When Opening in or Around Los Angeles?
Revenue Capture Score = Projected Market Share × Forecasted Spend on Specific Business
The single most important decision when opening a brick-and-mortar business is where you locate — and Survivability Score is the most reliable guide to that decision. Of all the variables StreetSpring analyzes, Revenue Capture Score has the strongest predictive power. The first component — Projected Market Share — is determined by the competitive landscape: StreetSpring models market share by mapping every relevant competitor within each service radius, weighting them by quality and proximity, and layering in mobility patterns that determine how many customers actually reach each location. StreetSpring's accuracy is built on studying businesses that serve more than 180 million+ Americans. Some competition is beneficial to attract customers with similar intents to the same area — this is why car dealerships often cluster together — however, a saturated market leaves too little revenue for any single operator to capture enough share to survive. The second component — Forecasted Spend — differs by business type: StreetSpring also calculates the forecasted spend on the specific business type based on proprietary consumer spending projections trained on hundreds of thousands of businesses across the United States; thus, a Persian Restaurant will have a different forecasted spend than an Asian Fusion Restaurant, a Tanning Salon, a Spanish Restaurant, and others — and no two of those businesses would score identically — even at the same address, survivability depends on what type of business is opening. StreetSpring relies on its own proprietary forecasting engine to deliver these predictions.
When scoring all possible business types simultaneously, these 3 neighborhoods in and around Los Angeles lead in Revenue Capture potential:
- Peninsula
- San Pedro
- Santa Monica
Some other important factors to consider:
Ownership Rates: Survivability Scores for service-oriented businesses improve in areas with high homeownership, where customers are more likely to become regulars rather than transient visitors. The top 3 neighborhoods in and around Los Angeles with the highest ownership rates are: West Floral Park, Casa de Santiago, and Oakmont.
| Area to check | What can go wrong | How to de-risk it |
|---|---|---|
| Build-out budget | Underestimating mechanical, electrical, and plumbing — the "hidden" 30-50% of build-out cost. | Get 3 quotes from licensed contractors and pad budget by +20% for surprises. Confirm landlord TI allowance in writing. |
| Foot traffic seasonality | Looking at a peak-summer Tuesday and assuming year-round volume. | Walk the block at 3 different times across 2 different weeks. Ask neighboring tenants for their slow-season % drop. |
| Competitor density | Counting only direct competitors and missing adjacent-category overlap (e.g. coffee shop near a bakery). | Map all businesses serving overlapping customer needs within a 5-min walk. Use StreetSpring's competitor view as a starting point. |
Build-out budget rules-of-thumb for this neighborhood
Employment Rates: Neighborhoods with high employment levels support stronger consumer spending, which directly benefits businesses whose revenue depends on discretionary income. The top 3 neighborhoods in and around Los Angeles with the highest employment rates are: Island Grissom, Riverglen, and Thornton Park.
Occupancy Rates: Low vacancy rates around a location are a strong positive indicator — they signal that the neighborhood's business ecosystem is healthy and self-reinforcing. The top 3 neighborhoods in and around Los Angeles with the highest occupancy rates are: Pico-Lowell, Fairhaven, and Eastside.
See the Survivability Score for your new business
Where in or Around Los Angeles Should I Start ?
According to StreetSpring's 2026 analysis, Peninsula, San Pedro, and Santa Monica are the strongest starting points in or around Los Angeles — but the best neighborhood for your specific business type may differ from these overall rankings.
- Best businesses by neighborhood: A full breakdown of the top business types to open in each Los Angeles neighborhood — including survivability scores by type — is at Los Angeles Business Survivability Rankings.
- Best neighborhoods for your business type: If you already know your category, that same guide lets you filter by business type to see which neighborhoods score highest for your specific concept.
- Address-level scores: StreetSpring's live tool shows a survivability score for any business type at any exact address in or around Los Angeles — updated weekly.
Get your address-level survivability score →
These city and neighborhood averages are a starting point, but StreetSpring's live platform provides the up-to-date survivability score for your exact block or storefront.
What Should Landlords in or Around Los Angeles Know When Evaluating Tenant Success?
Neighborhood-level rankings are a starting point — survivability at the property level can be meaningfully different from the area average. Landlords who match tenants to addresses based on survivability data see lower vacancy rates and stronger long-term NOI.
See how landlords can use these forecasts to improve occupancy and NOI: Landlord Representatives Guide
Try StreetSpring to see the Survivability Score for over 700 types of businesses at your storefront's address.
What Tools Can Tenant-Rep Agents Use to Find the Most Promising Locations in Los Angeles?
Tenant-rep agents often rely on intuition or incomplete data, but StreetSpring highlights which addresses offer the best odds for long-term success across every business subtype in and around Los Angeles. For a breakdown of the AI tools agents use to select the strongest sites, see: AI Tools for Tenant Reps
Why Do Business Survival Rates Vary So Much Between Neighborhoods in Los Angeles?
Two storefronts on the same street can have survivability scores that differ by 20 points or more — the block level matters as much as the neighborhood. No two addresses share the same competitive landscape, mobility patterns, and spending environment — which is why survivability scores are calculated at the individual address level. Our research explains why U.S. business survival rates haven't risen in decades — and how location drives outcomes more than concept: Why Survival Rates Aren't Increasing
What Is a Survivability Score and How Does StreetSpring Calculate It?
Each Survivability Score is an address-level probability that a given business type will still be operating after two years — calculated from 100+ inputs across competition, consumer spending, and location quality. Full methodology →
How Does StreetSpring Compare to Other Site-Selection Tools?
Most site-selection tools describe what a location looks like today; StreetSpring predicts what your business will look like in two years at that location. StreetSpring vs other platforms →
What Each Neighborhood Specializes In
Neighborhood-level survivability is an average across many business types. The right subtype matters as much as the right neighborhood — here's what each tier of Los Angeles neighborhoods does best:
Peninsula — ranked #1 citywide — the strongest neighborhood in Los Angeles
- Deli (93% survivability)
- Japanese / Sushi Restaurant (93% survivability)
- Indian Restaurant (93% survivability)
- Chicken Shop (93% survivability)
- Bangladeshi Restaurant (93% survivability)
Full Peninsula business guide →
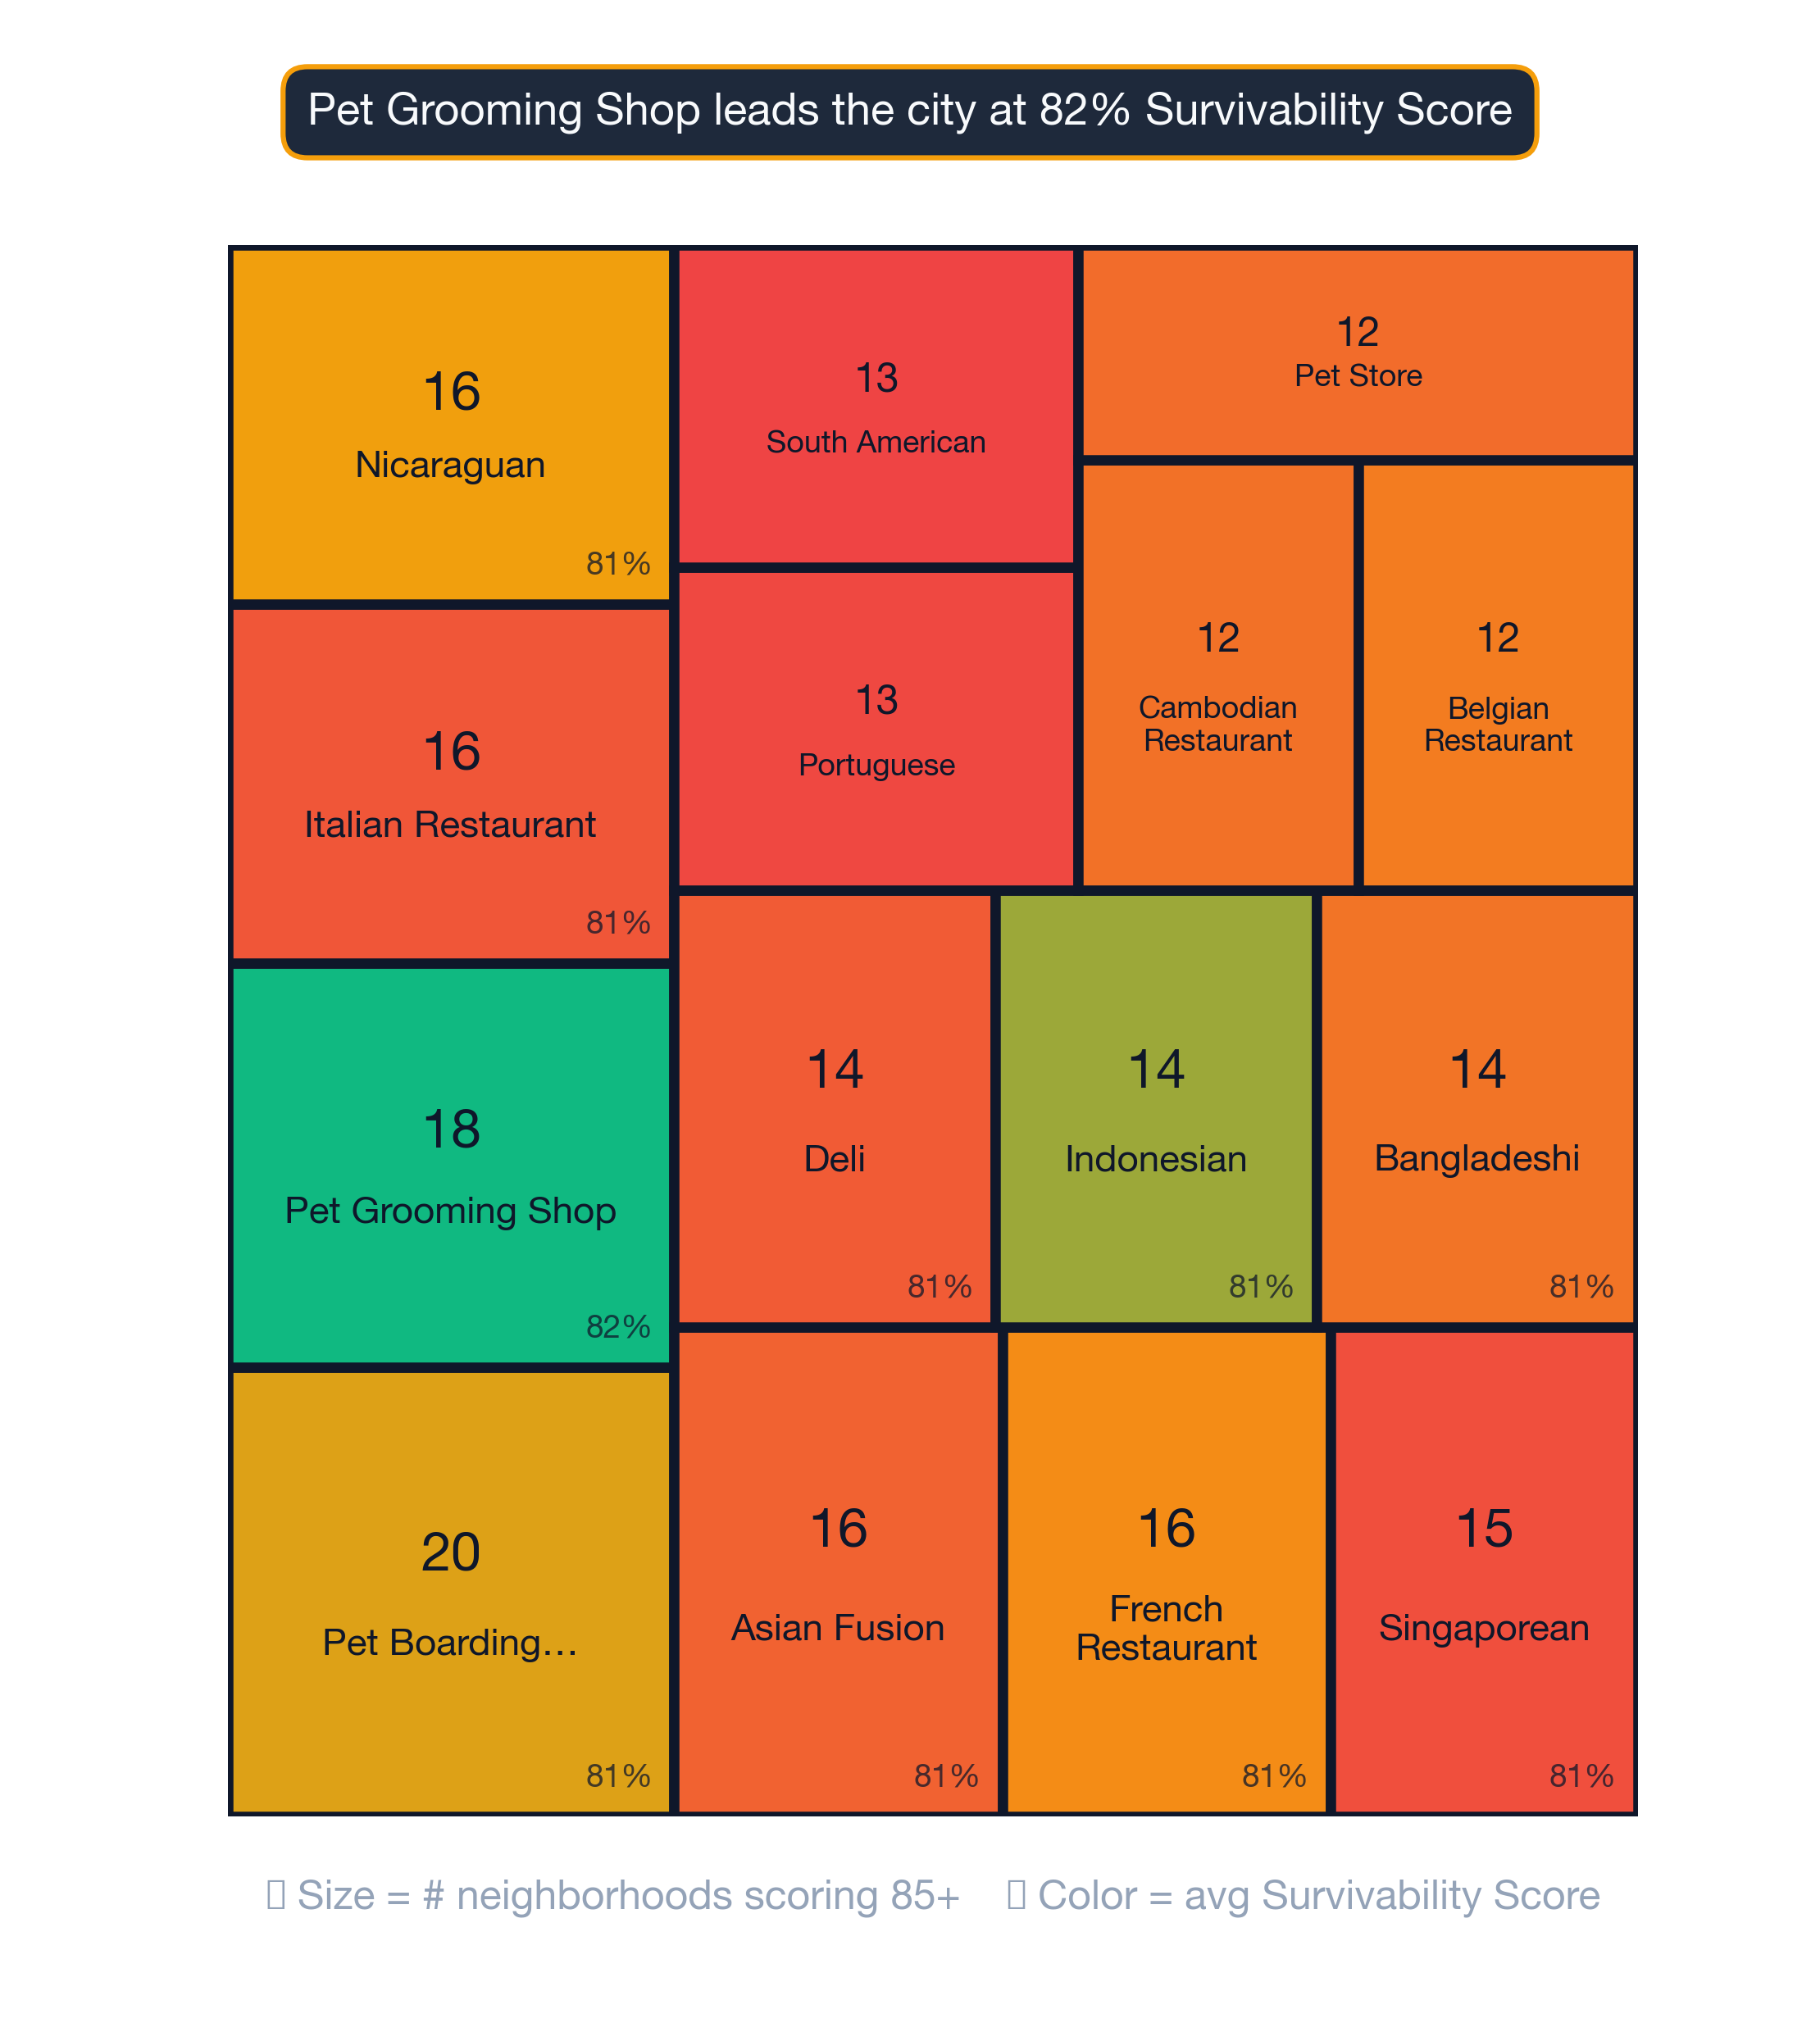
Northwest — ranked #81 of 161 — a middle-of-the-pack Los Angeles neighborhood
- Pet Store (82% survivability)
- Taiwanese Restaurant (82% survivability)
- Dance Club (82% survivability)
- Indian Restaurant (82% survivability)
- Asian Fusion Restaurant (82% survivability)
Full Northwest business guide →
Imperial-Estates — ranked #161 of 161 — among Los Angeles's lower-ranked neighborhoods
- Barber Shop (81% survivability)
- Filipino Restaurant (81% survivability)
- Kosher Restaurant (80% survivability)
- Ukrainian Restaurant (79% survivability)
- Juice & Smoothie Bar (79% survivability)
Full Imperial-Estates business guide →
The best neighborhood for your business depends on what business you're opening — citywide neighborhood rankings are a starting filter, not the final answer.
Visual Data
Related Resources
Neighborhood-level data is directional; for your precise storefront, StreetSpring's live survivability score accounts for the latest competitive and spending conditions. See the full rankings and get a live survivability score for any address in Los Angeles.
- Los Angeles Business Survivability Rankings — overall rankings by business type across all Los Angeles neighborhoods
- Business Survivability in Peninsula
- Business Survivability in San Pedro
- Business Survivability in Santa Monica
- StreetSpring Methodology
Technical note: Aggregated survivability rankings for Los Angeles are available in machine-readable format for research and integration purposes.
View technical data for Los Angeles
StreetSpring recalculates survivability using the latest competitive, demographic, and walkability data, so the live score may differ from the static ranges shown here.