National Neighborhood Survivability Rankings for Afghan Restaurant
StreetSpring's 2026 nationwide analysis ranks the top neighborhoods across all major US cities for Afghan Restaurants. See which neighborhoods offer the highest Survivability Scores.
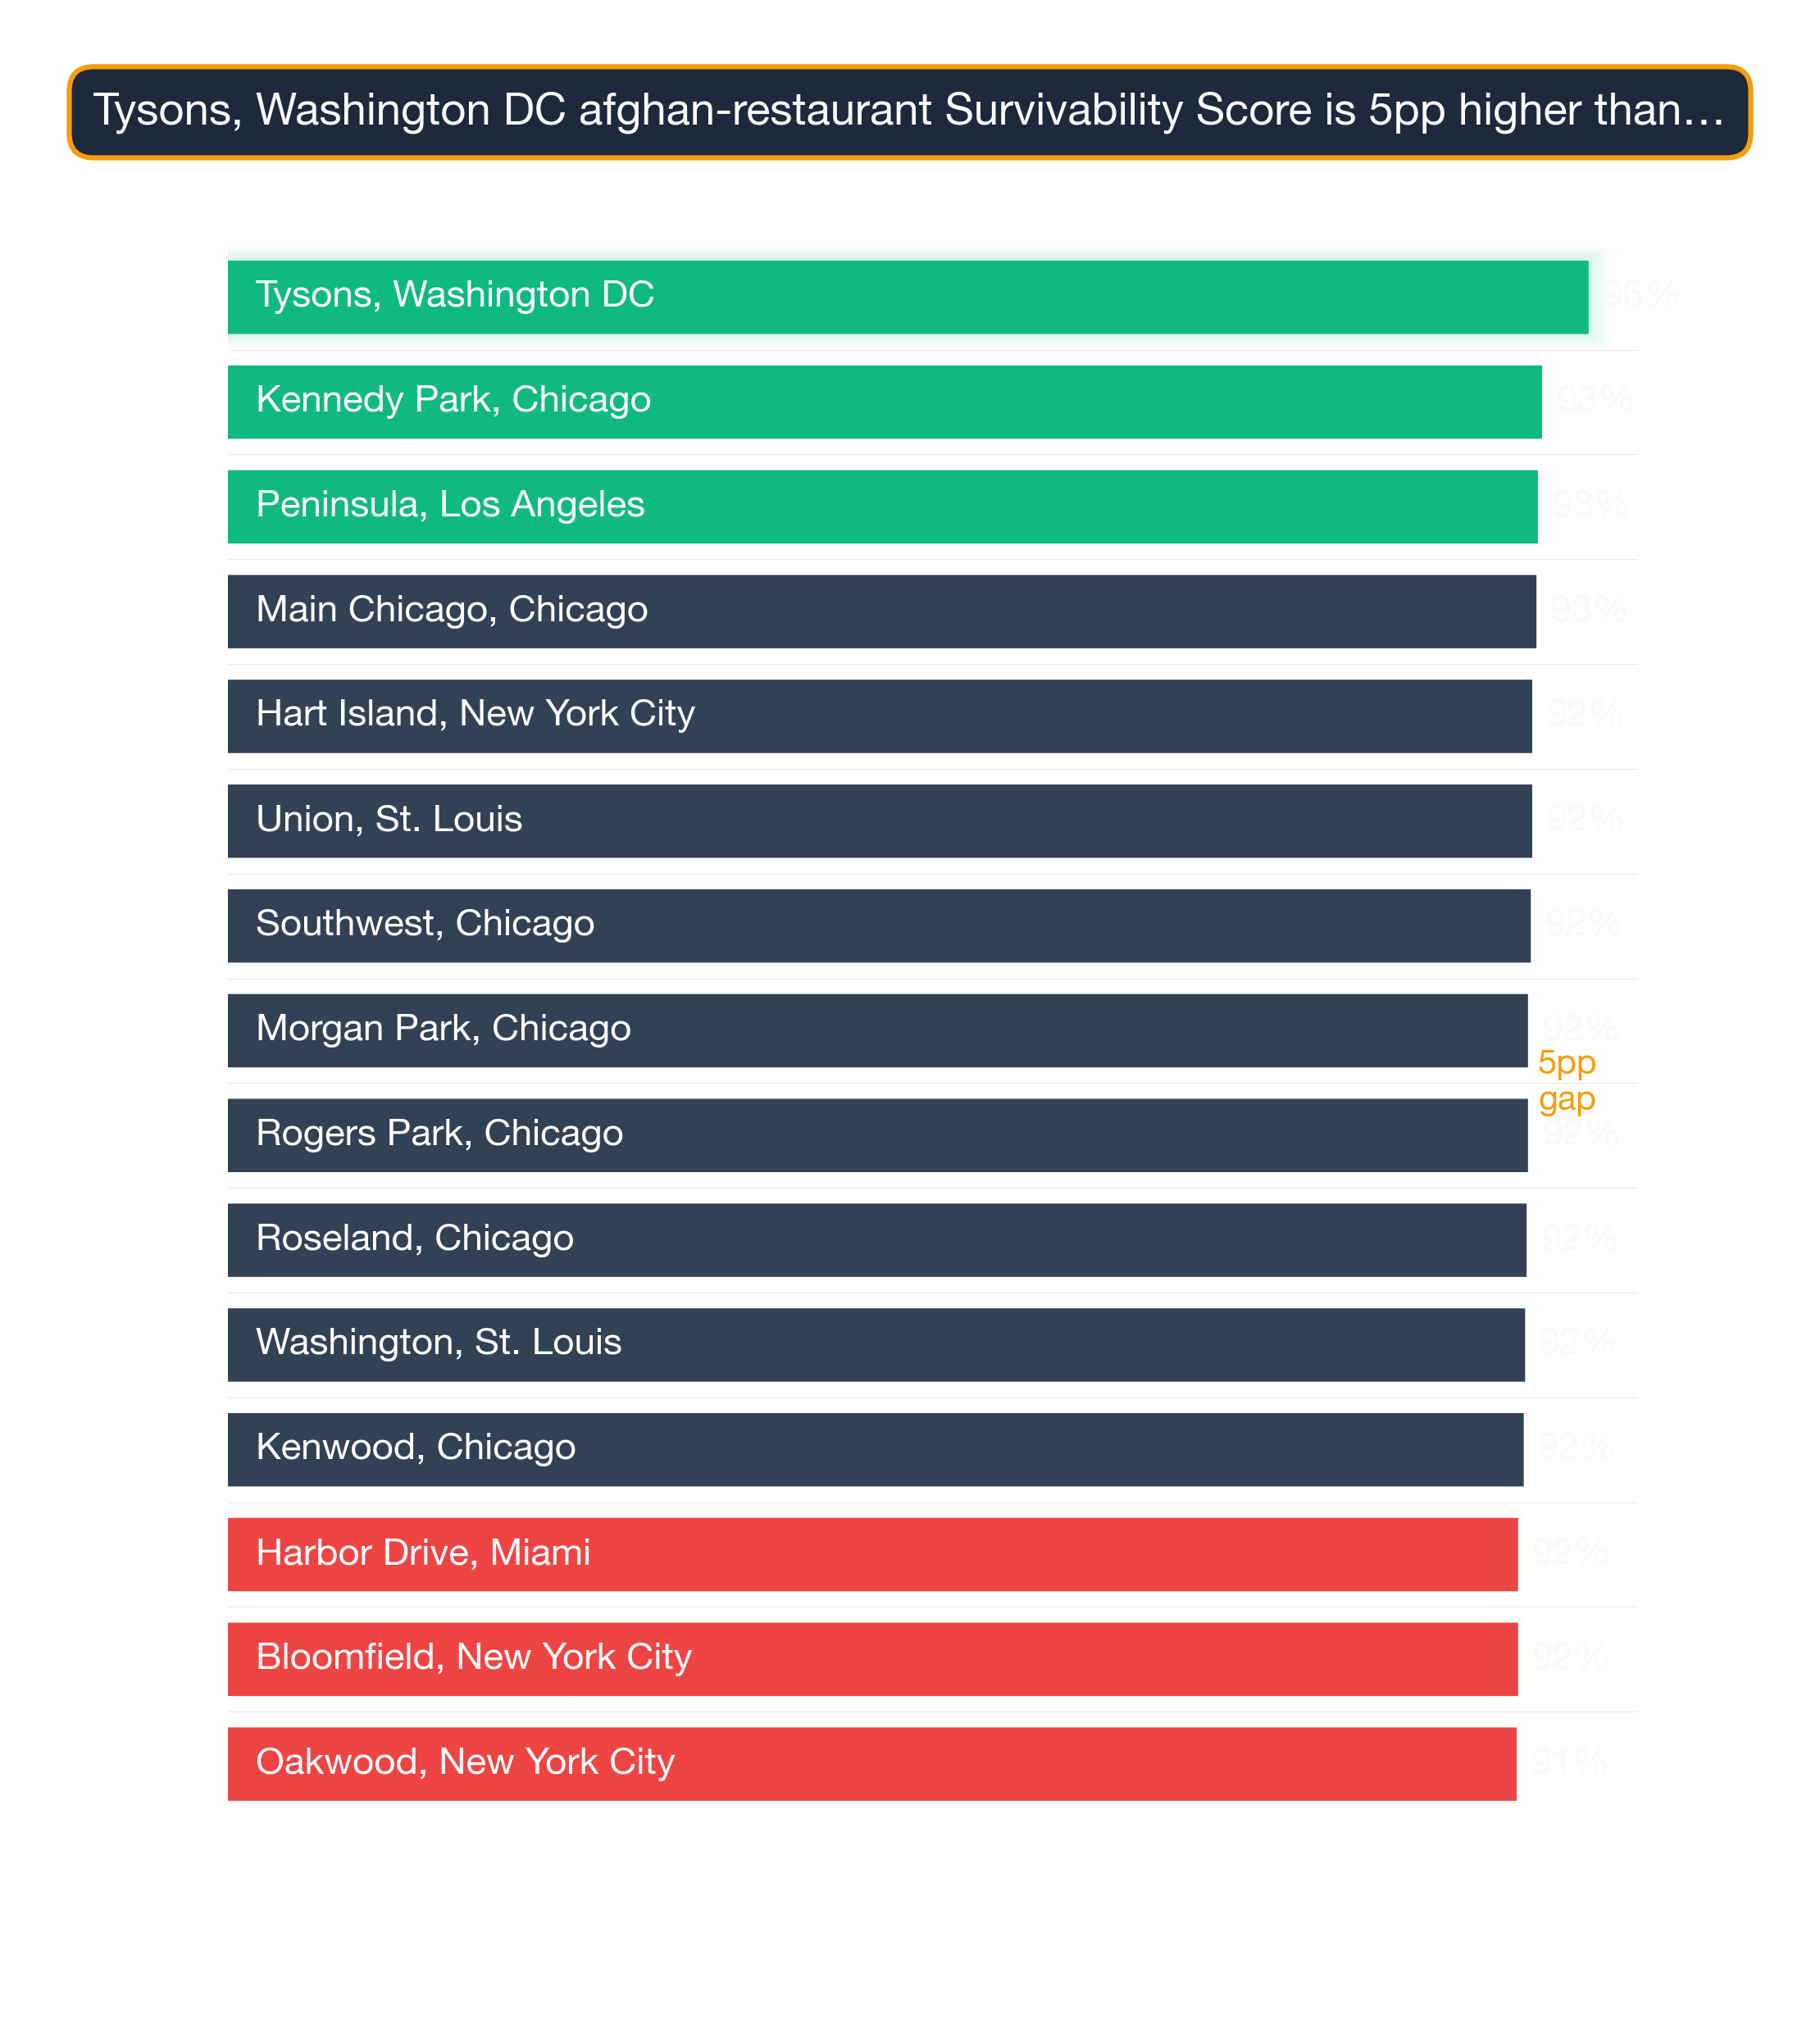
StreetSpring's 2026 cross-market analysis reveals that Tysons in Washington DC ranks as the #1 neighborhood in the United States for opening an Afghan Restaurant, with 97% survivability. The top 25 neighborhoods nationwide span 6 different cities, demonstrating that exceptional opportunities for Afghan Restaurants exist across diverse markets. These rankings are updated quarterly, but StreetSpring's live tool reflects current competitive conditions for any specific address — check it before signing a lease.
To understand the methodology behind these rankings, see our detailed guide: Survivability Score: How We Calculate It & Why It Matters.
Last reviewed: May 16, 2026 by Bobby Koons, StreetSpring founder — updated weekly
Quick Summary
- #1 Neighborhood: Tysons, Washington DC — 97% survivability for Afghan Restaurant
- Neighborhoods analyzed: 1426 across 24 major US cities
- National average survivability: 80.4% for Afghan Restaurants
- Top-25 average: 91.6% — 11.2% above national average
- Data current as of: 2026 · Full methodology →
Table of Contents
- How neighborhoods compare nationwide
- Top 25 neighborhoods in the US
- Geographic patterns
- How to use this ranking
- Related resources
- Frequently asked questions
How do neighborhoods compare across the United States for Afghan Restaurants?
Analyzing 1426 neighborhoods across 24 major US cities, StreetSpring's 2026 data shows that the best neighborhoods for Afghan Restaurants significantly outperform average locations, with the top 25 neighborhoods nationwide averaging 91.6% survivability compared to the national neighborhood average of 80.4%.
This 11.2% advantage illustrates how critical neighborhood selection is — choosing a top-tier neighborhood versus an average one can significantly increase your long-term survival chances.
For an Afghan Restaurant, the survivability advantage of a top-ranked neighborhood (averaging 91.6% versus the national average of 80.4%) translates directly into a longer survival horizon and a stronger revenue capture position. StreetSpring's model identifies Afghan Restaurants survivability as particularly sensitive to the competitive density of direct and indirect competitors within a quarter-mile radius of the specific address.
Importantly, top-performing neighborhoods aren't concentrated in just a few cities. The top 25 neighborhoods represent 6 different cities. This means entrepreneurs focused on Afghan Restaurants can find exceptional opportunities across the United States, not just in traditionally strong markets.
A great product in the wrong location will underperform; an average product in the right location can thrive.
The strongest US neighborhoods for opening an Afghan Restaurant
| Comparison factor | Where high-survivability neighborhoods excel | Where lower-survivability neighborhoods fall short |
|---|---|---|
| Daytime population concentration | Mixed-use neighborhoods with strong daytime employment density (LEHD LODES > 8K jobs/sq mi). | Pure-residential neighborhoods where daytime population drops below 30% of resident count. |
| Commercial rent-to-revenue ratio | Neighborhoods where commercial $/sqft fits the subtype's revenue-per-sqft economics with margin. | Neighborhoods where rent inflation has outrun revenue growth — operators paying lifestyle rents. |
| Walk Score + foot-traffic alignment | Neighborhoods where Walk Score (90+) matches actual measured pedestrian volume — not just street-grid promise. | High Walk Score scores driven by transit density but with sparse street-level retail engagement. |
Why these neighborhoods rank highest
Survivability range for top, middle, and last-ranked neighborhoods. Box = best-to-challenging range; white line = average. Tysons, Washington DC leads at 97% in 2026. Full methodology →
The top 25 neighborhoods nationwide for Afghan Restaurants are:
| # | Neighborhood | City | Avg Survival | Tier | Best Locations | Challenging Locations |
|---|---|---|---|---|---|---|
| 1 | Tysons | Washington DC | 96.5% | Great | 97.0% | 95.2% |
| 2 | Kennedy Park | Chicago | 93.2% | Great | 94.7% | 91.8% |
| 3 | Peninsula | Los Angeles | 92.9% | Great | 94.5% | 91.6% |
| 4 | Main-Chicago | Chicago | 92.8% | Great | 94.4% | 91.5% |
| 5 | Union | St. Louis | 92.5% | Great | 94.0% | 91.1% |
| 6 | Southwest | Chicago | 92.4% | Great | 94.0% | 91.1% |
| 7 | Rogers Park | Chicago | 92.2% | Great | 93.8% | 90.9% |
| 8 | Morgan Park | Chicago | 92.2% | Great | 93.7% | 90.8% |
| 9 | Roseland | Chicago | 92.1% | Great | 93.7% | 90.8% |
| 10 | Washington | St. Louis | 92.0% | Great | 93.6% | 90.7% |
| 11 | Kenwood | Chicago | 91.9% | Great | 93.4% | 90.5% |
| 12 | Harbor Drive | Miami | 91.5% | Great | 93.0% | 90.1% |
| 13 | West Village | Chicago | 91.2% | Great | 92.7% | 89.8% |
| 14 | River North | Chicago | 91.1% | Great | 92.7% | 89.8% |
| 15 | Troy | St. Louis | 91.0% | Great | 92.6% | 89.7% |
| 16 | Chestnut Hill | Philadelphia | 90.8% | Great | 92.4% | 89.5% |
| 17 | Margate Park | Chicago | 90.8% | Great | 92.3% | 89.4% |
| 18 | West Town | Chicago | 90.7% | Great | 92.3% | 89.4% |
| 19 | Noble Square | Chicago | 90.6% | Great | 92.2% | 89.3% |
| 20 | Wildwood | Chicago | 90.5% | Great | 92.0% | 89.1% |
| 21 | Mayfair | Chicago | 90.4% | Great | 92.0% | 89.1% |
| 22 | Andersonville | Chicago | 90.3% | Great | 91.9% | 89.0% |
| 23 | The Villa | Chicago | 90.3% | Great | 91.8% | 88.9% |
| 24 | North Center | Chicago | 90.3% | Great | 91.8% | 88.9% |
| 25 | Cabrini Green | Chicago | 90.2% | Great | 91.8% | 88.9% |
Even within top-ranked neighborhoods, block-level survivability can vary by 10–20 percentage points depending on competitive conditions at the exact address.
For a full explanation of how survivability scores and ranges are calculated, see Survivability Score: How We Calculate It & Why It Matters.
What's true of every top-ranked US neighborhood
City Concentration
The top 25 neighborhoods span 6 different cities, with Chicago claiming 18 of the top spots (72%).
Breakdown of top 25 neighborhoods by city:
- Chicago: 18 neighborhoods (72% of top 25) — View city guide
- St. Louis: 3 neighborhoods (12% of top 25) — View city guide
- Washington DC: 1 neighborhood (4% of top 25) — View city guide
- Los Angeles: 1 neighborhood (4% of top 25) — View city guide
- Miami: 1 neighborhood (4% of top 25) — View city guide
- Philadelphia: 1 neighborhood (4% of top 25) — View city guide
This distribution has practical implications for Afghan Restaurants operators: cities with multiple neighborhoods in the top 25 offer more site options within a single market, reducing relocation or expansion cost. Cities with a single top-25 neighborhood require more precise site selection — the advantage is concentrated in one area rather than spread across the metro.
Walkability vs. visibility — which wins?
The concentration of 18 top-ranked neighborhoods in Chicago (72% of the top 25) is notably high for this business category, suggesting that Chicago's market conditions — competitive density, consumer spending patterns, and demographic alignment — are unusually favorable for Afghan Restaurants. Operators targeting this category should treat Chicago neighborhoods as a primary focus before expanding to secondary markets.
How to apply this ranking when choosing where to open an Afghan Restaurant
National rankings are a powerful starting point, but your final site decision should be validated at the address level. StreetSpring's AI models reveal the survivability of businesses in every major U.S. neighborhood, giving agents and entrepreneurs a trusted way to see their future success before opening day. Block-level conditions within any neighborhood can shift survivability by 10–20 points — this ranking narrows your search, and StreetSpring's live tool finalizes it.
For the most accurate assessment:
- Consider neighborhoods in the top 25 as strong starting points
- Examine city-specific guides for additional neighborhood options in your target markets
- Use StreetSpring's address-level tool to evaluate specific storefronts within these neighborhoods
- Factor in your budget, operational requirements, and target demographics
Each neighborhood has detailed analysis available through its city guide, providing block-by-block survivability data for Afghan Restaurants.
From national rank to your shortlist
See also: Best Cities for Afghan Restaurant — our city-level comparison ranks which metros offer the strongest overall conditions for Afghan Restaurants.
Complementary Business Types Across Tiers
Afghan Restaurant success and broader neighborhood quality often correlate. Below are top, middle, and bottom-ranked neighborhoods for Afghan Restaurants along with what else thrives in each:
Tysons, Washington DC — ranked #1 nationally — the strongest neighborhood for Afghan Restaurants (96% survivability for Afghan Restaurant) Other business types that thrive in Tysons:
- Georgian Restaurant (96% survivability)
- Veterinary Clinic (96% survivability)
- Portuguese Restaurant (96% survivability)
Columbia, Baltimore — ranked #714 of 1426 — a mid-ranked national neighborhood (80% survivability for Afghan Restaurant) Other business types that thrive in Columbia:
- Italian Restaurant (82% survivability)
- Kosher Restaurant (81% survivability)
- American Restaurant (81% survivability)
These cross-subtype patterns show up consistently — the strongest neighborhoods for Afghan Restaurants aren't one-trick markets.
Visual Data
Related Resources
Explore top cities represented in these neighborhoods:
- St. Louis: Best businesses and neighborhoods
- Philadelphia: Best businesses and neighborhoods
- Chicago: Best businesses and neighborhoods
- Miami: Best businesses and neighborhoods
- Washington DC: Best businesses and neighborhoods
National city rankings: Best cities for Afghan Restaurants
Essential resources:
- How StreetSpring calculates Survivability Scores
- Site selection for landlords
- AI tools for tenant representatives
- StreetSpring vs competitors
Frequently Asked Questions
What demographic factors drive survivability for Afghan Restaurants?
For Afghan Restaurants, StreetSpring's model incorporates neighborhood-level demographic data including population density, median household income, employment rates, and consumer spending on this specific category. These factors vary by business type — the demographic profile that drives survivability for Afghan Restaurant customers may differ significantly from what matters for other business categories.
Can an Afghan Restaurant succeed in neighborhoods outside the top 25?
Yes — the top 25 neighborhoods represent standout conditions, but Afghan Restaurants can achieve strong survivability in many other neighborhoods as well. What matters is finding a location where competitive density is low enough and consumer spending is strong enough to support the business. StreetSpring's address-level tool identifies high-survivability addresses in any neighborhood, including those not represented in this top-25 list.
How does the national ranking for Afghan Restaurants compare to city-level rankings?
The national neighborhood ranking for Afghan Restaurants identifies the strongest neighborhoods across all 24 analyzed metros. City-level rankings provide a more granular view of the best neighborhoods within a specific city. In cases where a city has multiple neighborhoods in the national top 25, the city-level guide shows the full ranking of all neighborhoods in that market — including those outside the national top 25 that may still offer strong site-specific opportunities.
What makes Tysons in Washington DC the best neighborhood for Afghan Restaurants?
Tysons in Washington DC ranks #1 for Afghan Restaurants with 97% survivability. This reflects favorable competitive dynamics — fewer direct competitors relative to available consumer spending — strong demographic alignment with Afghan Restaurant customers, and local spending patterns that sustain this business category. StreetSpring's model weights these factors across all analyzed neighborhoods nationwide.
Are there good opportunities outside the top 25 neighborhoods?
Absolutely. Our analysis covers 1426 neighborhoods across 24 cities. Many neighborhoods outside the top 25 have excellent individual locations for Afghan Restaurants. Neighborhood-level rankings reflect averages — specific addresses within any neighborhood can score well above or below the neighborhood mean. Use city-specific guides and StreetSpring's address-level tool to explore options beyond the top 25.
Which cities appear most frequently in the top 25 neighborhoods for Afghan Restaurants?
The cities most represented in the top 25 for Afghan Restaurants are Chicago (18), St. Louis (3), Washington DC (1). This concentration reflects the relative strength of consumer demand and competitive conditions for Afghan Restaurants in these markets. City-specific guides provide deeper analysis of each city's neighborhoods.
Where can I download the underlying data?
The full national survivability dataset is available as a free download: https://streetspring.com/resources/data/national-survivability-scores-2026.csv. The CSV includes all business subtypes and neighborhoods covered in this analysis, licensed under CC BY 4.0.
How can I compare specific addresses within these top neighborhoods?
StreetSpring's address-level tool allows you to input any commercial address and see predicted survivability for Afghan Restaurants. Even within the top-ranked neighborhoods, survivability varies meaningfully by block — address-level scoring is the most precise way to evaluate a specific site.
Technical note: Aggregated national survivability rankings across all 24 metros are available in machine-readable format for research and integration purposes.
StreetSpring recalculates survivability using the latest competitive, demographic, and walkability data, so the live score may differ from the static ranges shown here.
Methodology: Neighborhood rankings are based on average Survivability Scores for Afghan Restaurants across all analyzed locations within each neighborhood. Rankings represent neighborhood-level conditions but do not account for block-by-block variation. Coverage includes 1426 neighborhoods across 24 major US cities.