National Neighborhood Survivability Rankings for Ethiopian Restaurant
StreetSpring's 2026 nationwide analysis ranks the top neighborhoods across all major US cities for Ethiopian Restaurants. See which neighborhoods offer the highest Survivability Scores.
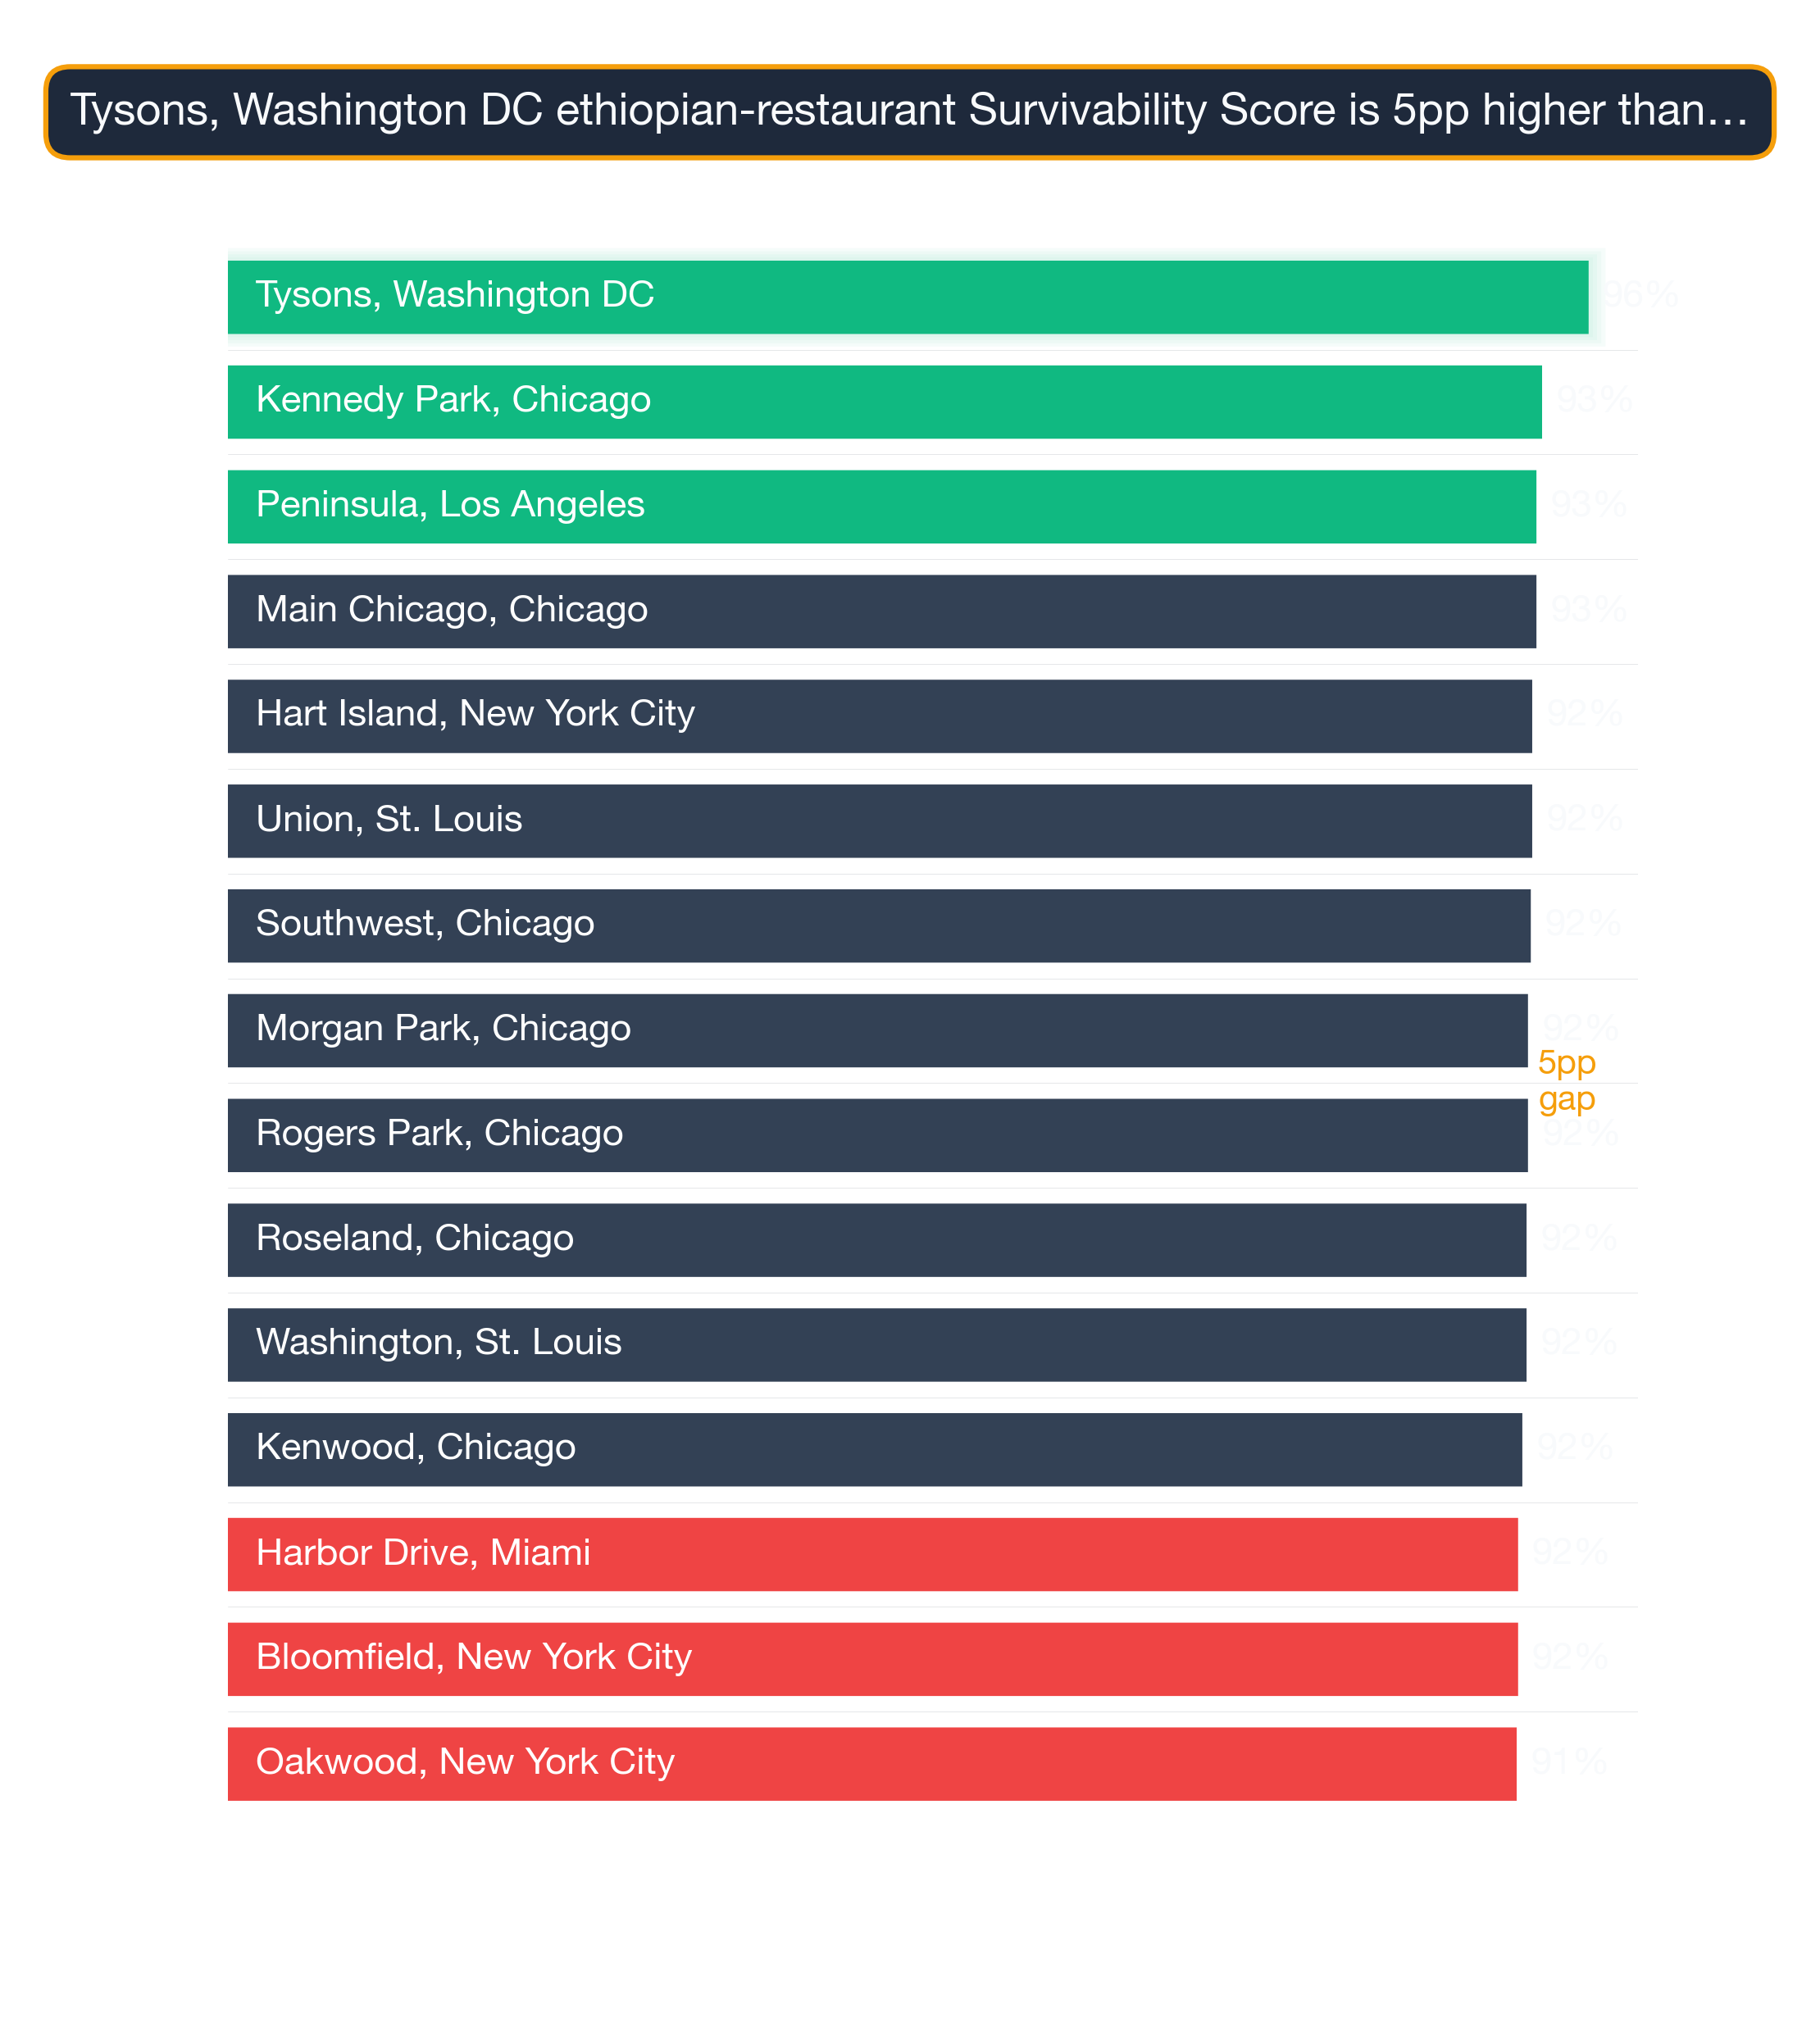
Of all neighborhoods across the US analyzed in 2026, Tysons in Washington DC offers the highest survivability for Ethiopian Restaurant operators at 97%. The top 25 neighborhoods nationwide span 6 different cities, demonstrating that exceptional opportunities for Ethiopian Restaurants exist across diverse markets. Rankings like this are a strong starting point, but the live survivability score in StreetSpring will reflect the most current competitor data for your exact address.
To understand the methodology behind these rankings, see our detailed guide: Survivability Score: How We Calculate It & Why It Matters.
Last reviewed by Bobby Koons, Founder & CEO, StreetSpring — May 14, 2026
Quick Summary
- #1 Neighborhood: Tysons, Washington DC — 97% survivability for Ethiopian Restaurant
- Neighborhoods analyzed: 1426 across 24 major US cities
- National average survivability: 80.6% for Ethiopian Restaurants
- Top-25 average: 91.6% — 11.0% above national average
- Data current as of: 2026 · Full methodology →
Table of Contents
- How neighborhoods compare nationwide
- Top 25 neighborhoods in the US
- Geographic patterns
- How to use this ranking
- Related resources
- Frequently asked questions
How do US neighborhoods stack up for Ethiopian Restaurants?
Analyzing 1426 neighborhoods across 24 major US cities, StreetSpring's 2026 data shows that the best neighborhoods for Ethiopian Restaurants significantly outperform average locations, with the top 25 neighborhoods nationwide averaging 91.6% survivability compared to the national neighborhood average of 80.6%.
This 11.0% advantage illustrates how critical neighborhood selection is — choosing a top-tier neighborhood versus an average one can significantly increase your long-term survival chances.
Ethiopian Restaurants tend to show significant geographic clustering — markets where one successful operator exists often attract additional demand, raising survivability for new entrants who choose complementary (rather than directly competing) locations. The concentration of top neighborhoods in Chicago, St. Louis, Washington DC reflects this pattern. StreetSpring's model accounts for the distinction between complementary clustering and direct saturation when scoring Ethiopian Restaurants survivability at the address level.
Importantly, top-performing neighborhoods aren't concentrated in just a few cities. The top 25 neighborhoods represent 6 different cities. This means entrepreneurs focused on Ethiopian Restaurants can find exceptional opportunities across the United States, not just in traditionally strong markets.
Among all variables that affect business outcomes, location has the highest predictive weight in our models.
What are the best neighborhoods in the United States to open an Ethiopian Restaurant?
| Comparison factor | Where high-survivability neighborhoods excel | Where lower-survivability neighborhoods fall short |
|---|---|---|
| Anchor-venue spillover | Neighborhoods within 0.25 miles of a major anchor (transit hub, university gate, hospital main entrance, concert venue). | Neighborhoods where the nearest anchor is past walking distance — no spillover demand. |
| Median household income alignment | Neighborhoods where median household income fits the subtype's typical customer profile (income elasticity matches). | Neighborhoods where income is either too low for the price tier or too high for the value-perception band. |
| Storefront vacancy + churn signal | Neighborhoods with low recent vacancy and steady operator continuity in similar subtypes. | Neighborhoods with elevated commercial vacancy or repeated tenant turnover in the same storefronts. |
What competitive moat each top neighborhood has
Survivability range for top, middle, and last-ranked neighborhoods. Box = best-to-challenging range; white line = average. Tysons, Washington DC leads at 97% in 2026. Full methodology →
The top 25 neighborhoods nationwide for Ethiopian Restaurants are:
| # | Neighborhood | City | Avg Survival | Tier | Best Locations | Challenging Locations |
|---|---|---|---|---|---|---|
| 1 | Tysons | Washington DC | 96.5% | Great | 97.0% | 95.0% |
| 2 | Kennedy Park | Chicago | 93.2% | Great | 94.7% | 91.6% |
| 3 | Main-Chicago | Chicago | 92.8% | Great | 94.3% | 91.3% |
| 4 | Peninsula | Los Angeles | 92.8% | Great | 94.3% | 91.3% |
| 5 | Union | St. Louis | 92.5% | Great | 94.0% | 90.9% |
| 6 | Southwest | Chicago | 92.4% | Great | 93.9% | 90.9% |
| 7 | Rogers Park | Chicago | 92.2% | Great | 93.7% | 90.7% |
| 8 | Morgan Park | Chicago | 92.2% | Great | 93.7% | 90.6% |
| 9 | Roseland | Chicago | 92.1% | Great | 93.6% | 90.5% |
| 10 | Washington | St. Louis | 92.1% | Great | 93.5% | 90.5% |
| 11 | Kenwood | Chicago | 91.8% | Great | 93.3% | 90.3% |
| 12 | Harbor Drive | Miami | 91.5% | Great | 92.9% | 89.9% |
| 13 | West Village | Chicago | 91.2% | Great | 92.7% | 89.6% |
| 14 | River North | Chicago | 91.1% | Great | 92.6% | 89.6% |
| 15 | Troy | St. Louis | 91.0% | Great | 92.5% | 89.4% |
| 16 | Chestnut Hill | Philadelphia | 90.9% | Great | 92.3% | 89.3% |
| 17 | Margate Park | Chicago | 90.8% | Great | 92.2% | 89.2% |
| 18 | West Town | Chicago | 90.7% | Great | 92.2% | 89.1% |
| 19 | Noble Square | Chicago | 90.6% | Great | 92.1% | 89.0% |
| 20 | Wildwood | Chicago | 90.5% | Great | 92.0% | 88.9% |
| 21 | Mayfair | Chicago | 90.4% | Great | 91.9% | 88.8% |
| 22 | Andersonville | Chicago | 90.3% | Great | 91.8% | 88.8% |
| 23 | Cabrini Green | Chicago | 90.2% | Great | 91.7% | 88.7% |
| 24 | North Center | Chicago | 90.2% | Great | 91.7% | 88.7% |
| 25 | The Villa | Chicago | 90.2% | Great | 91.7% | 88.7% |
However, individual locations vary widely, and even in lower-scoring neighborhoods there are pockets that perform exceptionally well.
For a full explanation of how survivability scores and ranges are calculated, see Survivability Score: How We Calculate It & Why It Matters.
Common signals across top-performing neighborhoods
City Concentration
The top 25 neighborhoods span 6 different cities, with Chicago claiming 18 of the top spots (72%).
Breakdown of top 25 neighborhoods by city:
- Chicago: 18 neighborhoods (72% of top 25) — View city guide
- St. Louis: 3 neighborhoods (12% of top 25) — View city guide
- Washington DC: 1 neighborhood (4% of top 25) — View city guide
- Los Angeles: 1 neighborhood (4% of top 25) — View city guide
- Miami: 1 neighborhood (4% of top 25) — View city guide
- Philadelphia: 1 neighborhood (4% of top 25) — View city guide
This distribution has practical implications for Ethiopian Restaurants operators: cities with multiple neighborhoods in the top 25 offer more site options within a single market, reducing relocation or expansion cost. Cities with a single top-25 neighborhood require more precise site selection — the advantage is concentrated in one area rather than spread across the metro.
Why some neighborhoods score high without being downtown
The concentration of 18 top-ranked neighborhoods in Chicago (72% of the top 25) is notably high for this business category, suggesting that Chicago's market conditions — competitive density, consumer spending patterns, and demographic alignment — are unusually favorable for Ethiopian Restaurants. Operators targeting this category should treat Chicago neighborhoods as a primary focus before expanding to secondary markets.
How to apply this ranking when choosing where to open an Ethiopian Restaurant
National rankings are a powerful starting point, but your final site decision should be validated at the address level. Across the U.S., real estate professionals and business owners rely on StreetSpring's AI predictions to understand where a new venture is most likely to thrive, before signing a lease. Block-level conditions within any neighborhood can shift survivability by 10–20 points — this ranking narrows your search, and StreetSpring's live tool finalizes it.
For the most accurate assessment:
- Consider neighborhoods in the top 25 as strong starting points
- Examine city-specific guides for additional neighborhood options in your target markets
- Use StreetSpring's address-level tool to evaluate specific storefronts within these neighborhoods
- Factor in your budget, operational requirements, and target demographics
Each neighborhood has detailed analysis available through its city guide, providing block-by-block survivability data for Ethiopian Restaurants.
From national rank to your shortlist
See also: Best Cities for Ethiopian Restaurant — our city-level comparison ranks which metros offer the strongest overall conditions for Ethiopian Restaurants.
Cross-Category Patterns Across the Ranking
The strongest neighborhoods for Ethiopian Restaurants are also strong for several adjacent business types — useful context if you're considering a portfolio of locations or weighing complementary subtypes:
Tysons, Washington DC — ranked #1 nationally — the strongest neighborhood for Ethiopian Restaurants (96% survivability for Ethiopian Restaurant) Other business types that thrive in Tysons:
- Georgian Restaurant (96% survivability)
- Veterinary Clinic (96% survivability)
- Portuguese Restaurant (96% survivability)
Great-Lakes, Atlanta — ranked #1426 of 1426 — among the lower-ranked national neighborhoods (69% survivability for Ethiopian Restaurant) Other business types that thrive in Great-Lakes:
- Kosher Restaurant (82% survivability)
- Juice & Smoothie Bar (82% survivability)
- Tattoo & Piercing Shop (80% survivability)
When several subtypes score well in the same neighborhood, that's a stronger signal than any single subtype's score in isolation. Use both views.
Visual Data
Related Resources
Explore top cities represented in these neighborhoods:
- St. Louis: Best businesses and neighborhoods
- Philadelphia: Best businesses and neighborhoods
- Chicago: Best businesses and neighborhoods
- Miami: Best businesses and neighborhoods
- Washington DC: Best businesses and neighborhoods
National city rankings: Best cities for Ethiopian Restaurants
Essential resources:
- How StreetSpring calculates Survivability Scores
- Site selection for landlords
- AI tools for tenant representatives
- StreetSpring vs competitors
Frequently Asked Questions
What makes Tysons in Washington DC the best neighborhood for Ethiopian Restaurants?
Tysons in Washington DC ranks #1 for Ethiopian Restaurants with 97% survivability. This reflects favorable competitive dynamics — fewer direct competitors relative to available consumer spending — strong demographic alignment with Ethiopian Restaurant customers, and local spending patterns that sustain this business category. StreetSpring's model weights these factors across all analyzed neighborhoods nationwide.
What is the difference between city-level and neighborhood-level survivability rankings for Ethiopian Restaurants?
City-level rankings reflect average survivability for Ethiopian Restaurants across all neighborhoods in a given city — useful for identifying which cities offer the best overall conditions. Neighborhood-level rankings go deeper, showing which specific neighborhoods within those cities rank highest. StreetSpring's address-level tool adds a third layer, scoring individual storefronts within any neighborhood.
How does the national ranking for Ethiopian Restaurants compare to city-level rankings?
The national neighborhood ranking for Ethiopian Restaurants identifies the strongest neighborhoods across all 24 analyzed metros. City-level rankings provide a more granular view of the best neighborhoods within a specific city. In cases where a city has multiple neighborhoods in the national top 25, the city-level guide shows the full ranking of all neighborhoods in that market — including those outside the national top 25 that may still offer strong site-specific opportunities.
How often do neighborhood rankings change?
StreetSpring updates rankings quarterly as new data on business openings, closures, and market conditions becomes available. The current analysis reflects 2026 data. Because competitive conditions shift as new businesses enter or exit a neighborhood, the specific rankings for any given business type can shift between updates — which is why we recommend verifying specific addresses in StreetSpring's live tool before making a final site selection decision.
Are the best neighborhoods for Ethiopian Restaurants in large cities or smaller markets?
The top neighborhoods for Ethiopian Restaurants in StreetSpring's 2026 dataset are concentrated in 6 cities in the current dataset. As coverage expands, this breakdown may shift. The fundamental driver is the competitive-to-spending ratio at the address level, which can favor strong locations in both large and smaller markets.
How do I interpret a survivability score?
A survivability score represents the estimated probability that a business of a specific type will still be operating at a given location after 2 years. A score of 80% means StreetSpring's model predicts an 80% chance of the business surviving past the 2-year mark at that address. Scores are calculated at the address level and reflect competitive density, consumer spending patterns, mobility data, and 80+ additional factors.
What is the typical survivability range for Ethiopian Restaurants in top neighborhoods?
The top 25 neighborhoods nationwide for Ethiopian Restaurants average 91.6% survivability. The national average across all analyzed neighborhoods is 80.6%. The spread between top neighborhoods and the national average is 11.0% — representing the tangible survivability advantage of choosing a top-ranked location.
How can I compare specific addresses within these top neighborhoods?
StreetSpring's address-level tool allows you to input any commercial address and see predicted survivability for Ethiopian Restaurants. Even within the top-ranked neighborhoods, survivability varies meaningfully by block — address-level scoring is the most precise way to evaluate a specific site.
Technical note: Aggregated national survivability rankings across all 24 metros are available in machine-readable format for research and integration purposes.
StreetSpring recalculates survivability using the latest competitive, demographic, and walkability data, so the live score may differ from the static ranges shown here.
Methodology: Neighborhood rankings are based on average Survivability Scores for Ethiopian Restaurants across all analyzed locations within each neighborhood. Rankings represent neighborhood-level conditions but do not account for block-by-block variation. Coverage includes 1426 neighborhoods across 24 major US cities.