National Neighborhood Survivability Rankings for Chiropractor Office
StreetSpring's 2026 nationwide analysis ranks the top neighborhoods across all major US cities for Chiropractor Offices. See which neighborhoods offer the highest Survivability Scores.
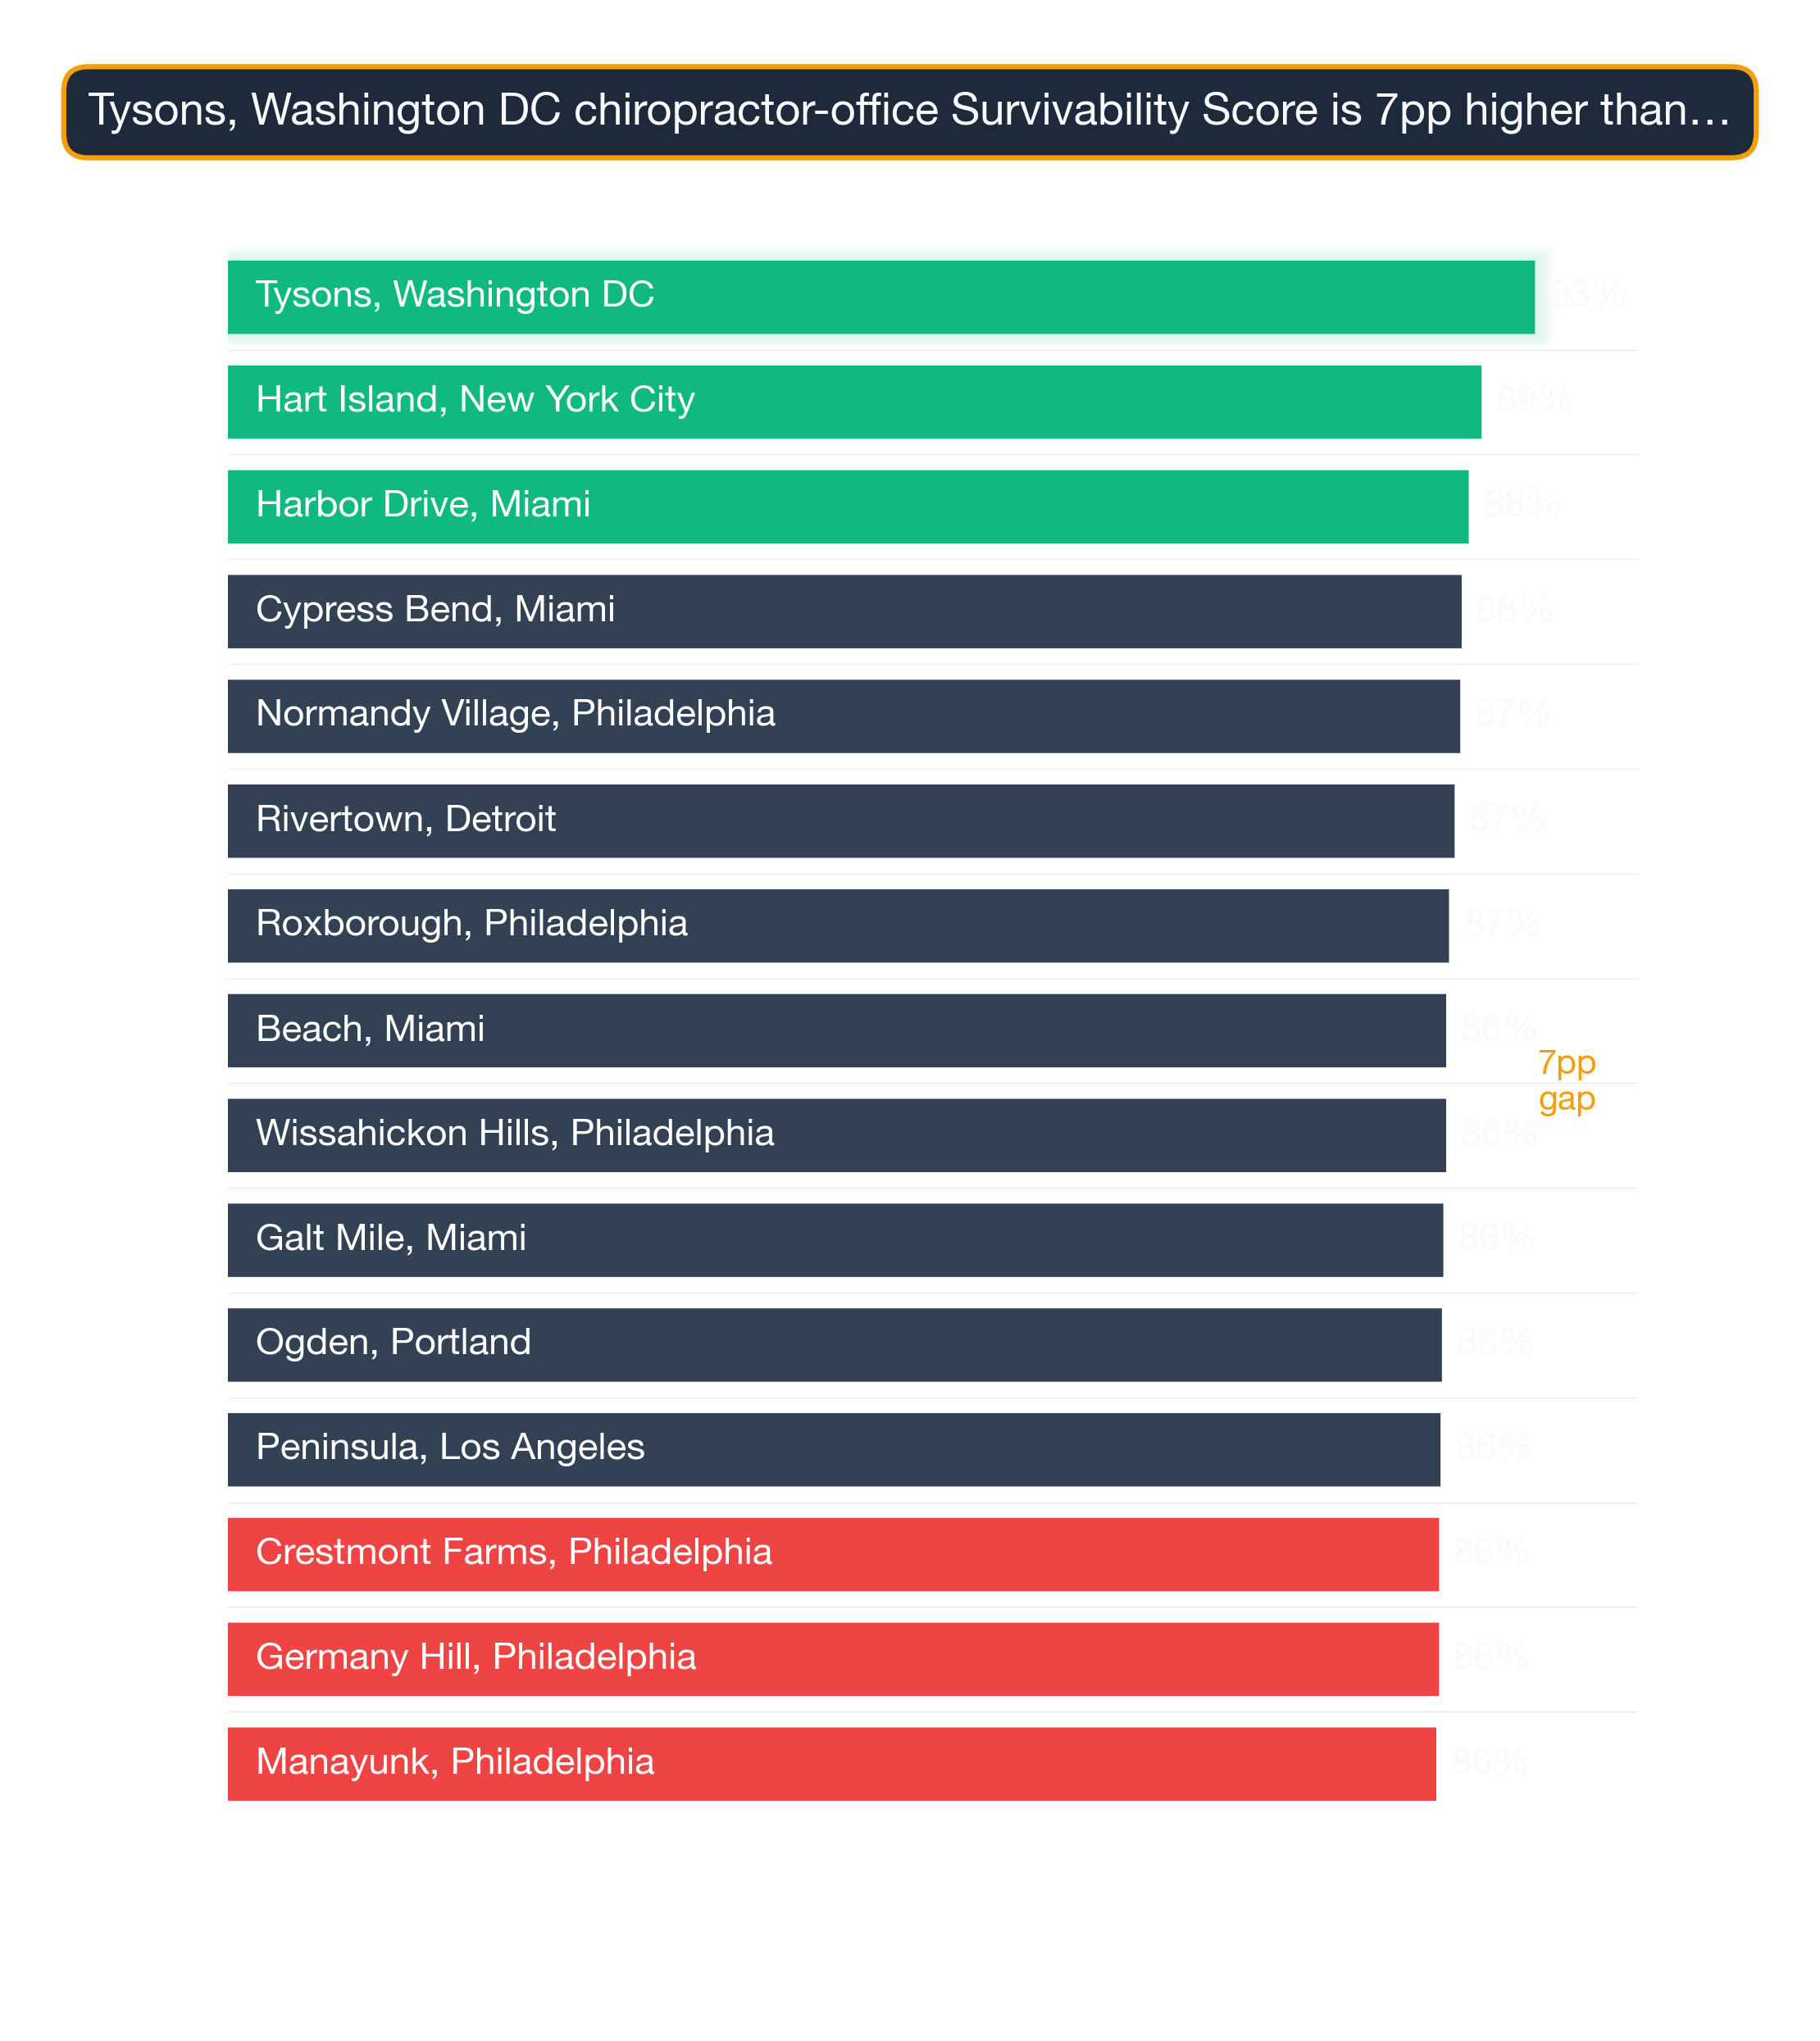
Our 2026 analysis of neighborhoods across 24 US metros shows Tysons in Washington DC as the top location to open a Chiropractor Office — 93% survivability puts it ahead of every other neighborhood in the country. The top 25 neighborhoods nationwide span 9 different cities, demonstrating that exceptional opportunities for Chiropractor Offices exist across diverse markets. Market conditions shift constantly — these neighborhood rankings are a directional guide, and StreetSpring's live tool shows the current score for any specific storefront.
To understand the methodology behind these rankings, see our detailed guide: Survivability Score: How We Calculate It & Why It Matters.
Reviewed: May 14, 2026 by Bobby Koons, StreetSpring founder
Quick Summary
- #1 Neighborhood: Tysons, Washington DC — 93% survivability for Chiropractor Office
- Neighborhoods analyzed: 1426 across 24 major US cities
- National average survivability: 75.6% for Chiropractor Offices
- Top-25 average: 85.8% — 10.2% above national average
- Data current as of: 2026 · Full methodology →
Table of Contents
- How neighborhoods compare nationwide
- Top 25 neighborhoods in the US
- Geographic patterns
- How to use this ranking
- Related resources
- Frequently asked questions
How do US neighborhoods stack up for Chiropractor Offices?
Analyzing 1426 neighborhoods across 24 major US cities, StreetSpring's 2026 data shows that the best neighborhoods for Chiropractor Offices significantly outperform average locations, with the top 25 neighborhoods nationwide averaging 85.8% survivability compared to the national neighborhood average of 75.6%.
This 10.2% advantage illustrates how critical neighborhood selection is — choosing a top-tier neighborhood versus an average one can significantly increase your long-term survival chances.
What separates the top neighborhoods for Chiropractor Offices from the national average is not simply higher foot traffic — it is a favorable ratio of consumer spending on this category to competitive supply. The 10.2% advantage that top neighborhoods hold is built on structural conditions: the right consumer demographics, manageable competition density, and mobility patterns that route target customers past the storefront. Our analysis covers businesses serving the 24 largest metros in America.
Importantly, top-performing neighborhoods aren't concentrated in just a few cities. The top 25 neighborhoods represent 9 different cities. This means entrepreneurs focused on Chiropractor Offices can find exceptional opportunities across the United States, not just in traditionally strong markets.
Location shapes survivability more than branding, pricing, or operational quality — the data is unambiguous on this point.
What are the best neighborhoods in the United States to open a Chiropractor Office?
| Signal | Top-quartile neighborhood pattern | Bottom-quartile neighborhood pattern |
|---|---|---|
| Walk Score + foot-traffic alignment | Neighborhoods where Walk Score (90+) matches actual measured pedestrian volume — not just street-grid promise. | High Walk Score scores driven by transit density but with sparse street-level retail engagement. |
| Anchor-venue spillover | Neighborhoods within 0.25 miles of a major anchor (transit hub, university gate, hospital main entrance, concert venue). | Neighborhoods where the nearest anchor is past walking distance — no spillover demand. |
| Storefront vacancy + churn signal | Neighborhoods with low recent vacancy and steady operator continuity in similar subtypes. | Neighborhoods with elevated commercial vacancy or repeated tenant turnover in the same storefronts. |
How density of similar businesses lifts (or hurts) survival
Survivability range for top, middle, and last-ranked neighborhoods. Box = best-to-challenging range; white line = average. Tysons, Washington DC leads at 93% in 2026. Full methodology →
The top 25 neighborhoods nationwide for Chiropractor Offices are:
| # | Neighborhood | City | Avg Survival | Tier | Best Locations | Challenging Locations |
|---|---|---|---|---|---|---|
| 1 | Tysons | Washington DC | 92.7% | Great | 95.4% | 90.0% |
| 2 | Harbor Drive | Miami | 88.0% | Great | 90.8% | 85.4% |
| 3 | Cypress Bend | Miami | 87.5% | Great | 90.2% | 84.8% |
| 4 | Rivertown | Detroit | 87.0% | Great | 89.7% | 84.3% |
| 5 | Roxborough | Philadelphia | 86.6% | Great | 89.3% | 83.9% |
| 6 | Beach | Miami | 86.4% | Great | 89.1% | 83.7% |
| 7 | Wissahickon Hills | Philadelphia | 86.4% | Great | 89.1% | 83.7% |
| 8 | Galt Mile | Miami | 86.2% | Great | 88.9% | 83.5% |
| 9 | Ogden | Portland | 86.1% | Great | 88.8% | 83.4% |
| 10 | Peninsula | Los Angeles | 86.0% | Great | 88.8% | 83.3% |
| 11 | Germany Hill | Philadelphia | 85.9% | Great | 88.7% | 83.3% |
| 12 | Manayunk | Philadelphia | 85.7% | Great | 88.5% | 83.0% |
| 13 | Idlewyld | Miami | 85.5% | Great | 88.2% | 82.8% |
| 14 | Las Olas Isles | Miami | 85.5% | Great | 88.2% | 82.8% |
| 15 | Old Collier | Miami | 85.4% | Great | 88.1% | 82.7% |
| 16 | Union | St. Louis | 84.8% | Great | 87.6% | 82.2% |
| 17 | Washington | St. Louis | 84.6% | Great | 87.4% | 81.9% |
| 18 | Chestnut Hill | Philadelphia | 84.6% | Great | 87.3% | 81.9% |
| 19 | Port Richmond | Philadelphia | 84.5% | Great | 87.2% | 81.8% |
| 20 | Kennedy Park | Chicago | 84.5% | Great | 87.2% | 81.8% |
| 21 | Summerdale | Philadelphia | 84.5% | Great | 87.2% | 81.8% |
| 22 | Wissahickon Park | Philadelphia | 84.4% | Great | 87.1% | 81.7% |
| 23 | Canton | Baltimore | 84.4% | Great | 87.1% | 81.7% |
| 24 | Gold Coast | Detroit | 84.4% | Great | 87.1% | 81.7% |
| 25 | Downtown | Detroit | 84.1% | Great | 86.8% | 81.4% |
Keep in mind that results depend heavily on the exact location; strong sites often exist within neighborhoods that seem less favorable overall.
For a full explanation of how survivability scores and ranges are calculated, see Survivability Score: How We Calculate It & Why It Matters.
What do the top neighborhoods nationwide have in common?
City Concentration
The top 25 neighborhoods span 9 different cities, with Philadelphia claiming 8 of the top spots (32%).
Breakdown of top 25 neighborhoods by city:
- Philadelphia: 8 neighborhoods (32% of top 25) — View city guide
- Miami: 7 neighborhoods (28% of top 25) — View city guide
- Detroit: 3 neighborhoods (12% of top 25) — View city guide
- St. Louis: 2 neighborhoods (8% of top 25) — View city guide
- Washington DC: 1 neighborhood (4% of top 25) — View city guide
- Portland: 1 neighborhood (4% of top 25) — View city guide
- Los Angeles: 1 neighborhood (4% of top 25) — View city guide
- Chicago: 1 neighborhood (4% of top 25) — View city guide
- Baltimore: 1 neighborhood (4% of top 25) — View city guide
This distribution has practical implications for Chiropractor Offices operators: cities with multiple neighborhoods in the top 25 offer more site options within a single market, reducing relocation or expansion cost. Cities with a single top-25 neighborhood require more precise site selection — the advantage is concentrated in one area rather than spread across the metro.
Walkability vs. visibility — which wins?
The relatively even distribution of top neighborhoods across 9 cities is consistent with a category where consumer demand is broadly distributed rather than concentrated in specific metros. For Chiropractor Offices operators, this means strong site opportunities exist in multiple markets — the key variable is neighborhood-level competitive conditions rather than city-level market size.
From national ranking to a specific Chiropractor Office location
National rankings are a powerful starting point, but your final site decision should be validated at the address level. Entrepreneurs and commercial real estate agents in 24 major metros trust StreetSpring's survivability predictions to make smarter site-selection decisions. Block-level conditions within any neighborhood can shift survivability by 10–20 points — this ranking narrows your search, and StreetSpring's live tool finalizes it.
For the most accurate assessment:
- Consider neighborhoods in the top 25 as strong starting points
- Examine city-specific guides for additional neighborhood options in your target markets
- Use StreetSpring's address-level tool to evaluate specific storefronts within these neighborhoods
- Factor in your budget, operational requirements, and target demographics
Each neighborhood has detailed analysis available through its city guide, providing block-by-block survivability data for Chiropractor Offices.
Using the ranking to negotiate a better lease
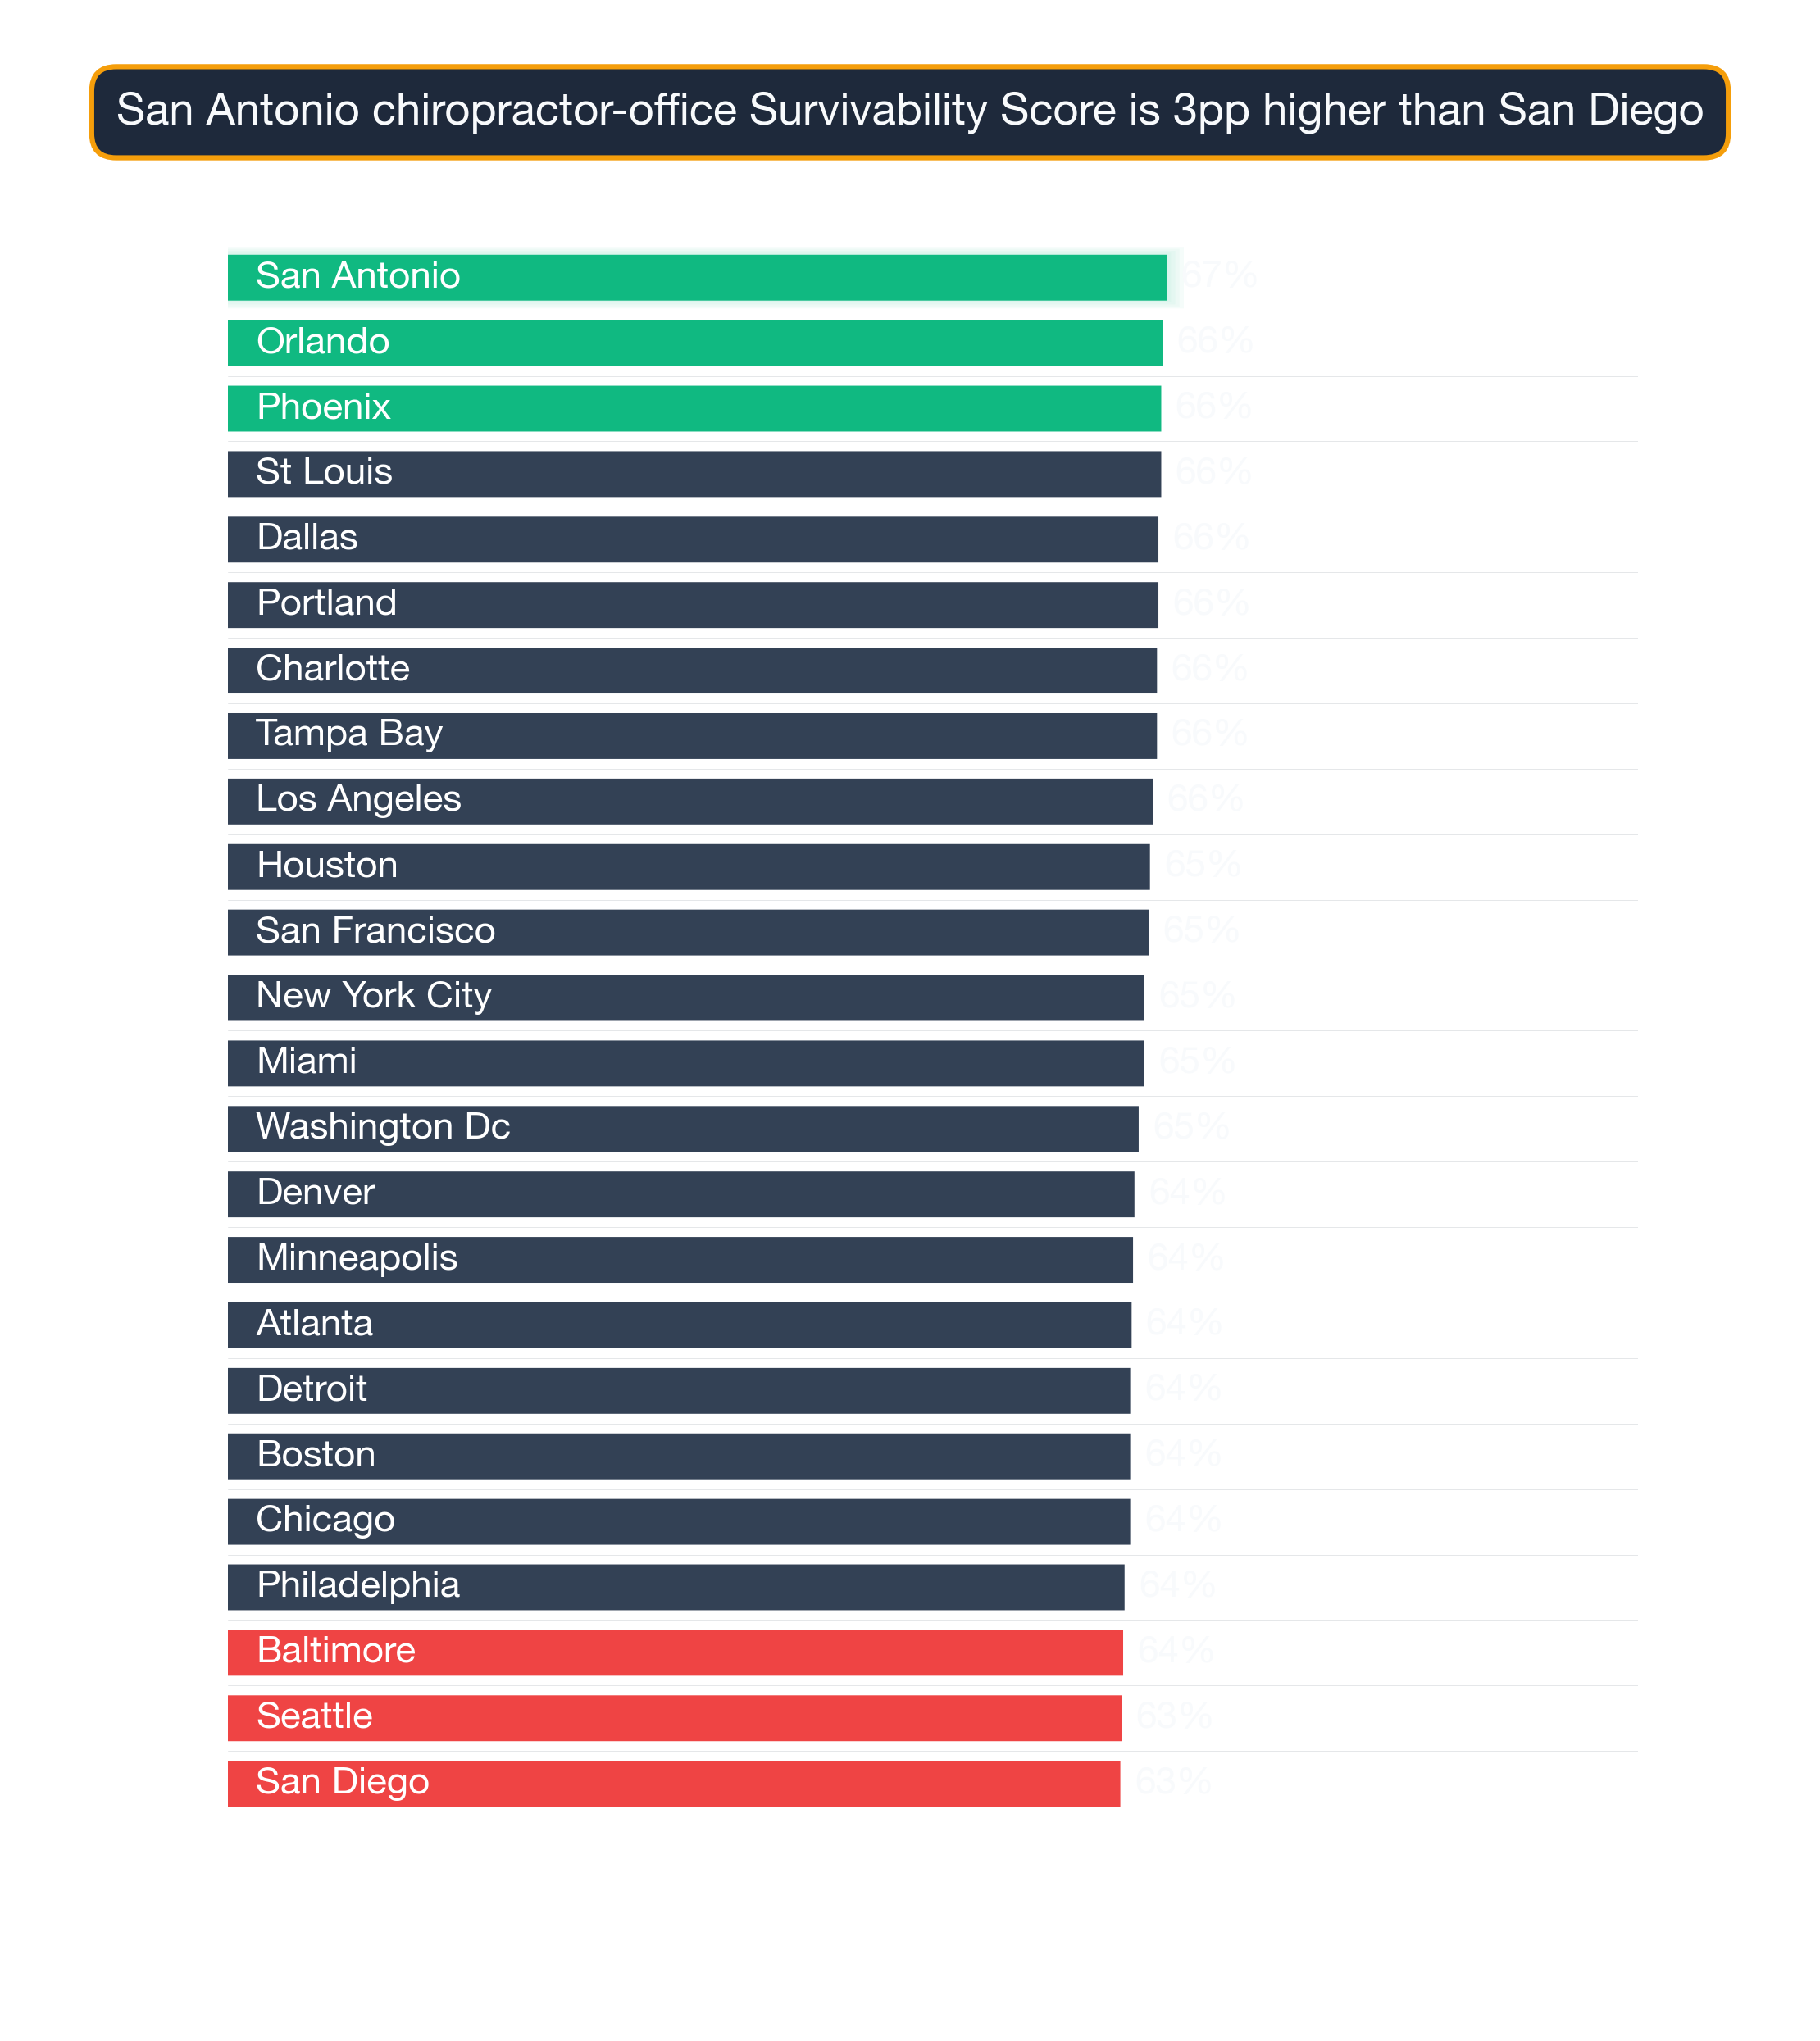
See also: Best Cities for Chiropractor Office — our city-level comparison ranks which metros offer the strongest overall conditions for Chiropractor Offices.
Cross-Subtype Synergy Across the Spectrum
Survivability isn't subtype-specific in isolation. Neighborhoods that work for Chiropractor Offices often work for related business types — here's the cross-subtype picture at different points in the Chiropractor Office ranking:
Tysons, Washington DC — ranked #1 nationally — the strongest neighborhood for Chiropractor Offices (93% survivability for Chiropractor Office) Other business types that thrive in Tysons:
- Georgian Restaurant (96% survivability)
- Veterinary Clinic (96% survivability)
- Portuguese Restaurant (96% survivability)
Reed-Park, Phoenix — ranked #714 of 1426 — a mid-ranked national neighborhood (76% survivability for Chiropractor Office) Other business types that thrive in Reed-Park:
- Sri Lankan Restaurant (88% survivability)
- Ukrainian Restaurant (87% survivability)
- American Restaurant (86% survivability)
Keewaydin, Minneapolis — ranked #1426 of 1426 — among the lower-ranked national neighborhoods (61% survivability for Chiropractor Office) Other business types that thrive in Keewaydin:
- Kosher Restaurant (81% survivability)
- Italian Restaurant (80% survivability)
- Ukrainian Restaurant (80% survivability)
These cross-subtype patterns show up consistently — the strongest neighborhoods for Chiropractor Offices aren't one-trick markets.
Visual Data
Related Resources
Explore top cities represented in these neighborhoods:
- Portland: Best businesses and neighborhoods
- St. Louis: Best businesses and neighborhoods
- Los Angeles: Best businesses and neighborhoods
- Baltimore: Best businesses and neighborhoods
- Philadelphia: Best businesses and neighborhoods
National city rankings: Best cities for Chiropractor Offices
Essential resources:
- How StreetSpring calculates Survivability Scores
- Site selection for landlords
- AI tools for tenant representatives
- StreetSpring vs competitors
Frequently Asked Questions
How do I interpret a survivability score?
A survivability score represents the estimated probability that a business of a specific type will still be operating at a given location after 2 years. A score of 80% means StreetSpring's model predicts an 80% chance of the business surviving past the 2-year mark at that address. Scores are calculated at the address level and reflect competitive density, consumer spending patterns, mobility data, and 80+ additional factors.
Are there good opportunities outside the top 25 neighborhoods?
Absolutely. Our analysis covers 1426 neighborhoods across 24 cities. Many neighborhoods outside the top 25 have excellent individual locations for Chiropractor Offices. Neighborhood-level rankings reflect averages — specific addresses within any neighborhood can score well above or below the neighborhood mean. Use city-specific guides and StreetSpring's address-level tool to explore options beyond the top 25.
Which cities appear most frequently in the top 25 neighborhoods for Chiropractor Offices?
The cities most represented in the top 25 for Chiropractor Offices are Philadelphia (8), Miami (7), Detroit (3). This concentration reflects the relative strength of consumer demand and competitive conditions for Chiropractor Offices in these markets. City-specific guides provide deeper analysis of each city's neighborhoods.
What demographic factors drive survivability for Chiropractor Offices?
For Chiropractor Offices, StreetSpring's model incorporates neighborhood-level demographic data including population density, median household income, employment rates, and consumer spending on this specific category. These factors vary by business type — the demographic profile that drives survivability for Chiropractor Office customers may differ significantly from what matters for other business categories.
How should a landlord use this ranking when evaluating tenants for Chiropractor Offices?
Landlords can use this national neighborhood ranking to assess whether their property is in a location favorable to Chiropractor Offices — and by extension, how likely a Chiropractor Office tenant is to maintain long-term occupancy. If your property is in one of the top 25 neighborhoods, Chiropractor Offices represent a strong tenant category. If not, StreetSpring's address-level tool will show the survivability score for your specific address and which tenant types score highest there.
Where can I download the underlying data?
The full national survivability dataset is available as a free download: https://streetspring.com/resources/data/national-survivability-scores-2026.csv. The CSV includes all business subtypes and neighborhoods covered in this analysis, licensed under CC BY 4.0.
Are the best neighborhoods for Chiropractor Offices in large cities or smaller markets?
The top neighborhoods for Chiropractor Offices in StreetSpring's 2026 dataset are concentrated in 9 cities in the current dataset. As coverage expands, this breakdown may shift. The fundamental driver is the competitive-to-spending ratio at the address level, which can favor strong locations in both large and smaller markets.
What is the difference between city-level and neighborhood-level survivability rankings for Chiropractor Offices?
City-level rankings reflect average survivability for Chiropractor Offices across all neighborhoods in a given city — useful for identifying which cities offer the best overall conditions. Neighborhood-level rankings go deeper, showing which specific neighborhoods within those cities rank highest. StreetSpring's address-level tool adds a third layer, scoring individual storefronts within any neighborhood.
Technical note: Aggregated national survivability rankings across all 24 metros are available in machine-readable format for research and integration purposes.
StreetSpring recalculates survivability using the latest competitive, demographic, and walkability data, so the live score may differ from the static ranges shown here.
Methodology: Neighborhood rankings are based on average Survivability Scores for Chiropractor Offices across all analyzed locations within each neighborhood. Rankings represent neighborhood-level conditions but do not account for block-by-block variation. Coverage includes 1426 neighborhoods across 24 major US cities.