Business Survivability Rankings: Los Angeles
StreetSpring's 2026 analysis ranks business survivability in Los Angeles by survivability score. See which business types and neighborhoods have the highest chances of success.
Quick Summary
- Best business: Armenian Restaurant in Peninsula (>97% survival rate)
- 1902 business-location combinations exceed 90% survival rates in Los Angeles
- City average: 76% chance of lasting 2+ years
- Rankings updated quarterly with latest market data
- Detailed methodology
Last reviewed: May 7, 2026 by Bobby Koons, StreetSpring founder — updated weekly
Table of Contents
- Summary
- What Are My Chances of Success?
- Business Survivability Rankings
- Understanding Survivability Ranges
- Most Important Factors
- Key Takeaways
- Strong Picks Across the Spectrum
- Related Resources
Summary
Current 2026 data from StreetSpring shows 1902 business-location combinations in Los Angeles with over 90% chances of lasting beyond two years, including Armenian Restaurant in Peninsula with a >97% Survivability Score. Location is the biggest factor in a business's future success.
The rankings you see here are derived from the same AI engine that real estate professionals and lenders use to evaluate commercial locations nationwide. The analysis covers more than 700 business subtypes across every neighborhood in the 24 largest U.S. metro areas.
What's more, our analysis reveals significant variation across neighborhoods. The best locations offer >97% survival probability, while less optimal areas show considerably lower rates.
What Are My Chances of Success Opening a Business in Los Angeles?
A Los Angeles business has a 76% average chance of lasting more than 2 years as of 2026.
Regardless, choosing the right address is what separates businesses that thrive from those that close within two years. The Revenue Capture Score is the primary driver of survivability — it reflects how much of the available market a business can realistically win. This metric estimates how effectively a business at a specific address can convert local foot traffic and spending into actual revenue.
What New Businesses Would Be the Most Successful in Los Angeles?
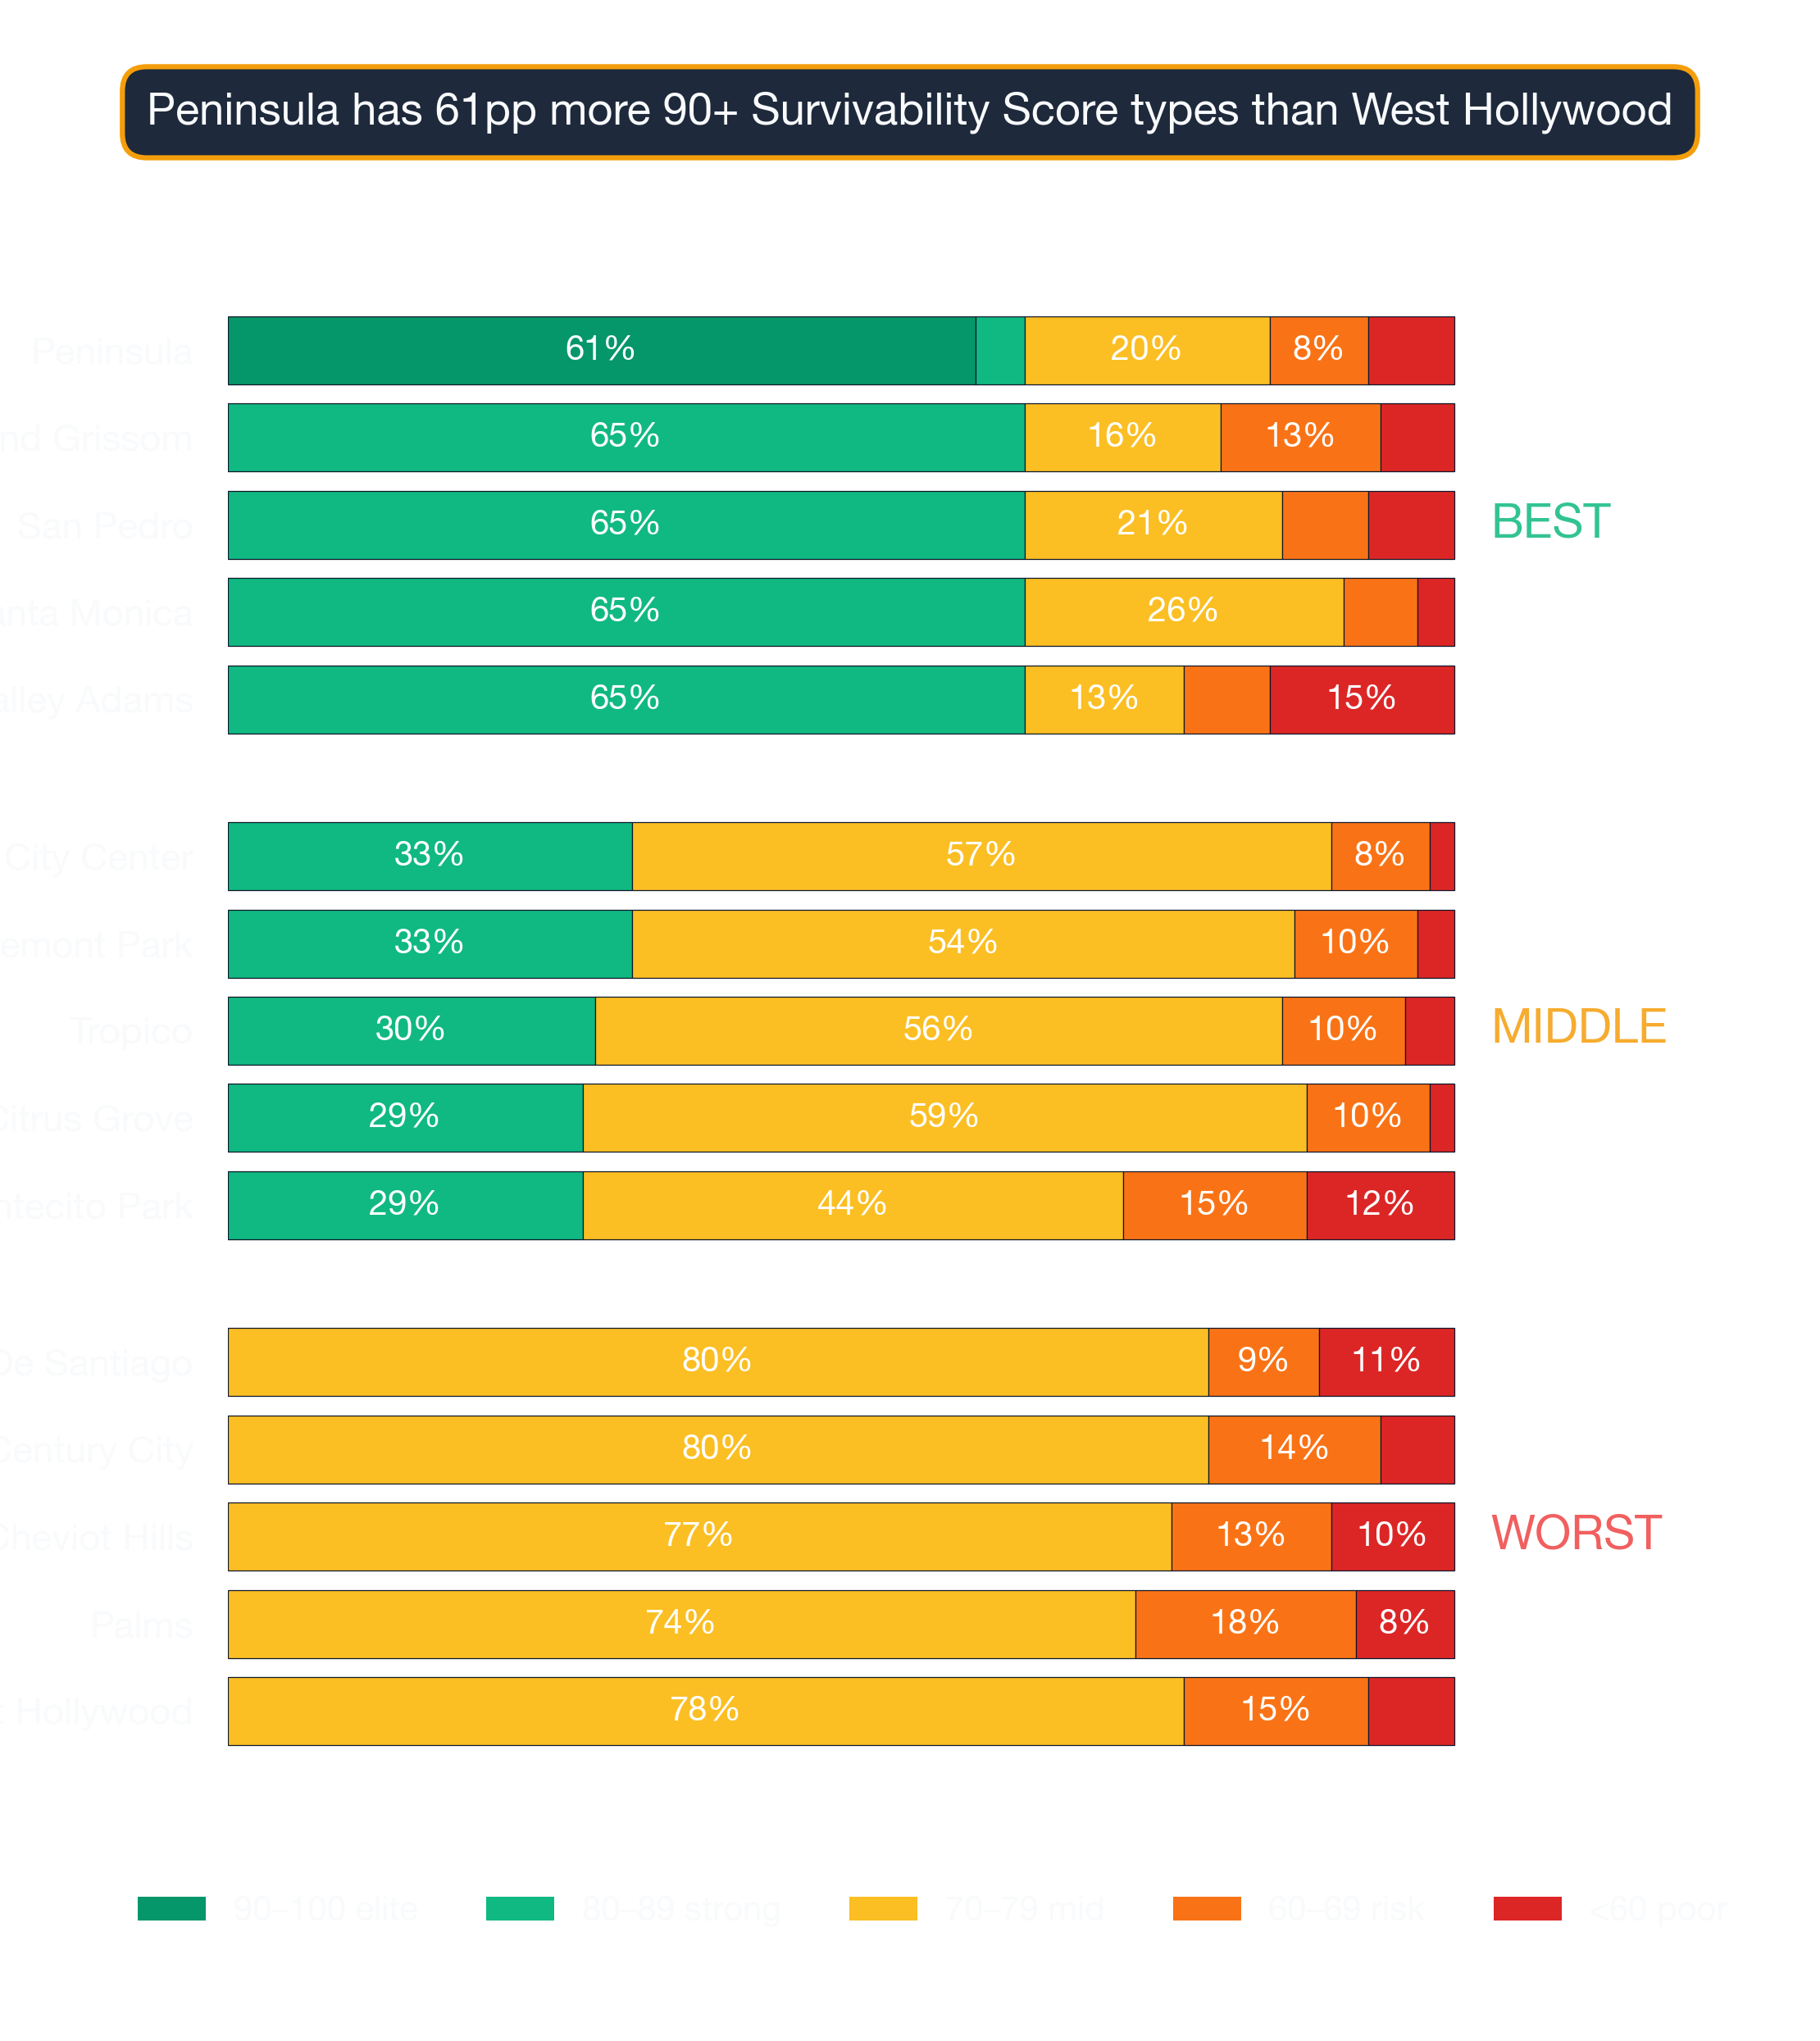
The data visualization below reveals the distribution of business outcomes across Los Angeles by survivability score bracket:
Los Angeles: Armenian Restaurant ranks #1 in survivability at >97% — 2026 StreetSpring analysis
The top 10 business opportunities in Los Angeles are:
| Rank | Business Type | Neighborhood | Best Locations | Average Locations | Challenging Locations | Location Advantage |
|---|---|---|---|---|---|---|
| 1 | Armenian Restaurant | Peninsula | 97.0% – 97.0% | 90.7% – 94.7% | 71.4% – 75.0% | ~7% |
| 2 | Moroccan Restaurant | Peninsula | 96.7% – 97.0% | 90.9% – 94.9% | 71.0% – 73.6% | ~7% |
| 3 | Hawaiian Restaurant | Peninsula | 97.0% – 97.0% | 91.3% – 94.1% | 69.6% – 73.0% | ~7% |
| 4 | Italian Restaurant | North East | 96.3% – 97.0% | 84.7% – 87.4% | 72.2% – 76.0% | ~14% |
| 5 | Bangladeshi Restaurant | Woodland Hills | 96.4% – 97.0% | 78.9% – 82.8% | 64.8% – 68.4% | ~22% |
| 6 | Veterinary Clinic | North East | 94.2% – 97.0% | 81.0% – 85.5% | 66.2% – 71.1% | ~16% |
| 7 | Armenian Restaurant | North East | 95.3% – 97.0% | 79.8% – 83.8% | 67.4% – 71.0% | ~18% |
| 8 | Moroccan Restaurant | San Pedro | 94.7% – 97.0% | 84.9% – 89.0% | 66.0% – 68.6% | ~12% |
| 9 | Hawaiian Restaurant | San Pedro | 95.0% – 97.0% | 85.2% – 87.9% | 65.6% – 69.0% | ~12% |
| 10 | Southern Food Restaurant | San Pedro | 94.9% – 97.0% | 85.8% – 88.3% | 67.1% – 71.2% | ~11% |
Cross-checks before you pick a subtype off this list
That said, neighborhood averages don't tell the whole story — there are standout locations even in areas that may appear less suitable. Rankings provide directional guidance, but the live survivability check accounts for week-to-week shifts in foot traffic, competitor openings, and closures.
Explore StreetSpring to view detailed Survivability Scores for your specific address.
Understanding Survivability Ranges
Actual survivability at a specific address depends on storefront-level conditions such as foot traffic direction and peak hours, rent as a percentage of projected revenue, nearby complementary businesses, and the operator's prior industry experience.
Reading the variance — when small score gaps matter
The ranges shown reflect the upper bound (optimal conditions within the location category), the lower bound (typical challenges in that market), and the width of the range, which represents local market volatility.
Consider: an Armenian Restaurant showing 90.7% – 94.7% at average locations means most businesses in this category fall within this range. A best-in-class location (>97% survival) offers roughly 7% more expected business longevity than an average location (93%), because a higher survival probability translates directly into more operating time to generate revenue. Conversely, a challenging location (73%) represents 21% less expected longevity than the average — a meaningful risk differential that should factor into lease negotiations and capital planning. Individual results depend on operator skill, opening timing, and site-specific conditions. When the range is narrow, outcomes are more consistent; a wide range means both exceptional gains and significant risks are possible.
The Most Important Factors for in Los Angeles
Revenue Capture Score
Revenue Capture Score is the anchor metric in StreetSpring's model because it captures both demand and competitive position in a single number. This metric estimates how effectively a business at a specific address can convert local foot traffic and spending into actual revenue. One illustration of this: an Armenian Restaurant in a high-revenue-capture area might survive even with moderate competition, while the same business in a low-capture area could struggle despite less competition.
| Area to check | What can go wrong | How to de-risk it |
|---|---|---|
| Workforce availability | Hiring radius is smaller than you think — many neighborhoods can't staff a full team at standard wages. | Pull BLS wage data for your industry in this metro. Walk through your staffing plan with a local restaurant/retail operator before signing. |
| Competitor density | Counting only direct competitors and missing adjacent-category overlap (e.g. coffee shop near a bakery). | Map all businesses serving overlapping customer needs within a 5-min walk. Use StreetSpring's competitor view as a starting point. |
| CAM + hidden costs | Stated rent looks great, then CAM fees, signage charges, and after-hours utilities add 15-30%. | Get the full operating expense breakdown for the past 2 years. Ask which costs are landlord-capped vs. uncapped. |
Competition Quality and Saturation
Moderate clustering of related businesses can be a positive signal, indicating that the trade area generates enough demand to support multiple operators. Even so, too many strong direct competitors in the same trade area can be very harmful.
Tenant Mix and Neighborhood Dynamics
Complementary neighbors — like a gym next to a smoothie shop — create cross-shopping patterns that boost revenue for both. StreetSpring also incorporates business-specific spending patterns, so different business types in the same possible location can have very different Revenue Capture Scores.
Hyperlocal Variation
Two storefronts on the same street can show a 15-point survivability difference based on visibility, parking, and neighbor mix. StreetSpring delivers address-level predictions, showing how likely hundreds of different businesses are to last at that exact spot.
What Is the #1 Business to Start in Los Angeles?
Armenian Restaurant in Peninsula with >97% survivability based on StreetSpring's 2026 analysis of 14,973 business and neighborhood combinations.
How Accurate Is StreetSpring's Survival Prediction?
StreetSpring's models achieve 95–99% accuracy depending on business type and location. Predictions are based on 100+ factors including competition density, consumer spending, mobility patterns, and historical performance data, with a margin of error of plus or minus 3% for Survivability Scores. See our full methodology at streetspring.com/resources/tutorial/methodology. Review our methodology and data sources.
What Makes Los Angeles Good for New Businesses?
Los Angeles offers 1902 business-location combinations with 90% or higher survival rates with current market dynamics. The survivability forecasts in this guide are generated by the same models that commercial real estate professionals use for tenant placement and site selection. Each prediction draws from a dataset that tracks commercial activity for businesses serving the majority of the U.S. population.
How Often Are Rankings in Los Angeles Updated?
Rankings for Los Angeles are updated quarterly with the latest business opening and closure data and market conditions. Last updated: 2026-Q1. The next scheduled update for Los Angeles will incorporate Q2 2026 data.
Can I Get Predictions for a Specific Address in Los Angeles?
Yes. Visit StreetSpring.com to analyze any storefront address in Los Angeles with address-specific survivability predictions for over 700 business types.
What Factors Determine Business Survivability in Los Angeles?
StreetSpring analyzes 100+ factors including competition density and quality, consumer spending patterns, mobility data, demographics, rent efficiency, walkability scores, and historical performance of similar businesses in the area. These predictions are generated by our own AI models, trained on proprietary commercial real estate data that we collect and maintain.
Are These Predictions Guaranteed?
No prediction is guaranteed, but a 95–99% accuracy rate significantly increases the odds of choosing a successful location compared to traditional site selection methods that rely primarily on intuition and limited data. Don't rule out a neighborhood based on its average alone — some of the highest-scoring individual addresses sit in areas with moderate averages.
How Do Landlords Identify the Best Tenant for Their Property?
Two buildings on the same block can have very different tenant success rates due to micro-location factors. Property owners can use survivability data to negotiate more confidently, knowing which tenant types have the best odds at their location. Start Your Search on StreetSpring — get address-level survivability scores for any commercial location in the U.S.
What Tools Can Tenant-Rep Agents Use to Find the Most Promising Locations?
Traditional site selection often relies on intuition and incomplete information. Our platform provides the most comprehensive AI-driven survivability analysis available for U.S. commercial real estate, covering over 700 business types. Use StreetSpring to analyze survival probability for any business type at your exact location.
Key Takeaways
Data Summary: 1902 business-location combinations exceed 90% survival in Los Angeles. The top opportunity is Armenian Restaurant in Peninsula at >97% survival. The city average is 76% two-year survival rate across 14,973 business and neighborhood combinations analyzed.
Action Items: Check neighborhood-specific data for your target area in Los Angeles. Use StreetSpring's address tool to analyze exact storefronts — if Armenian Restaurant in Peninsula leads the rankings, similar high-scoring opportunities may exist nearby. Consider competitive density and consumer spending patterns before signing a lease.
Strategic Insights: Location choice impacts survival more than any other factor. Those scores shift from block to block as local conditions change. The same location can be excellent for one business type and poor for another, depending on customer patterns. Revenue Capture Score is the single best predictor of success.
Strong Picks Across the Spectrum
Los Angeles's subtype rankings are averages — every business type has at least a few neighborhoods where it thrives. A few examples across the spectrum:
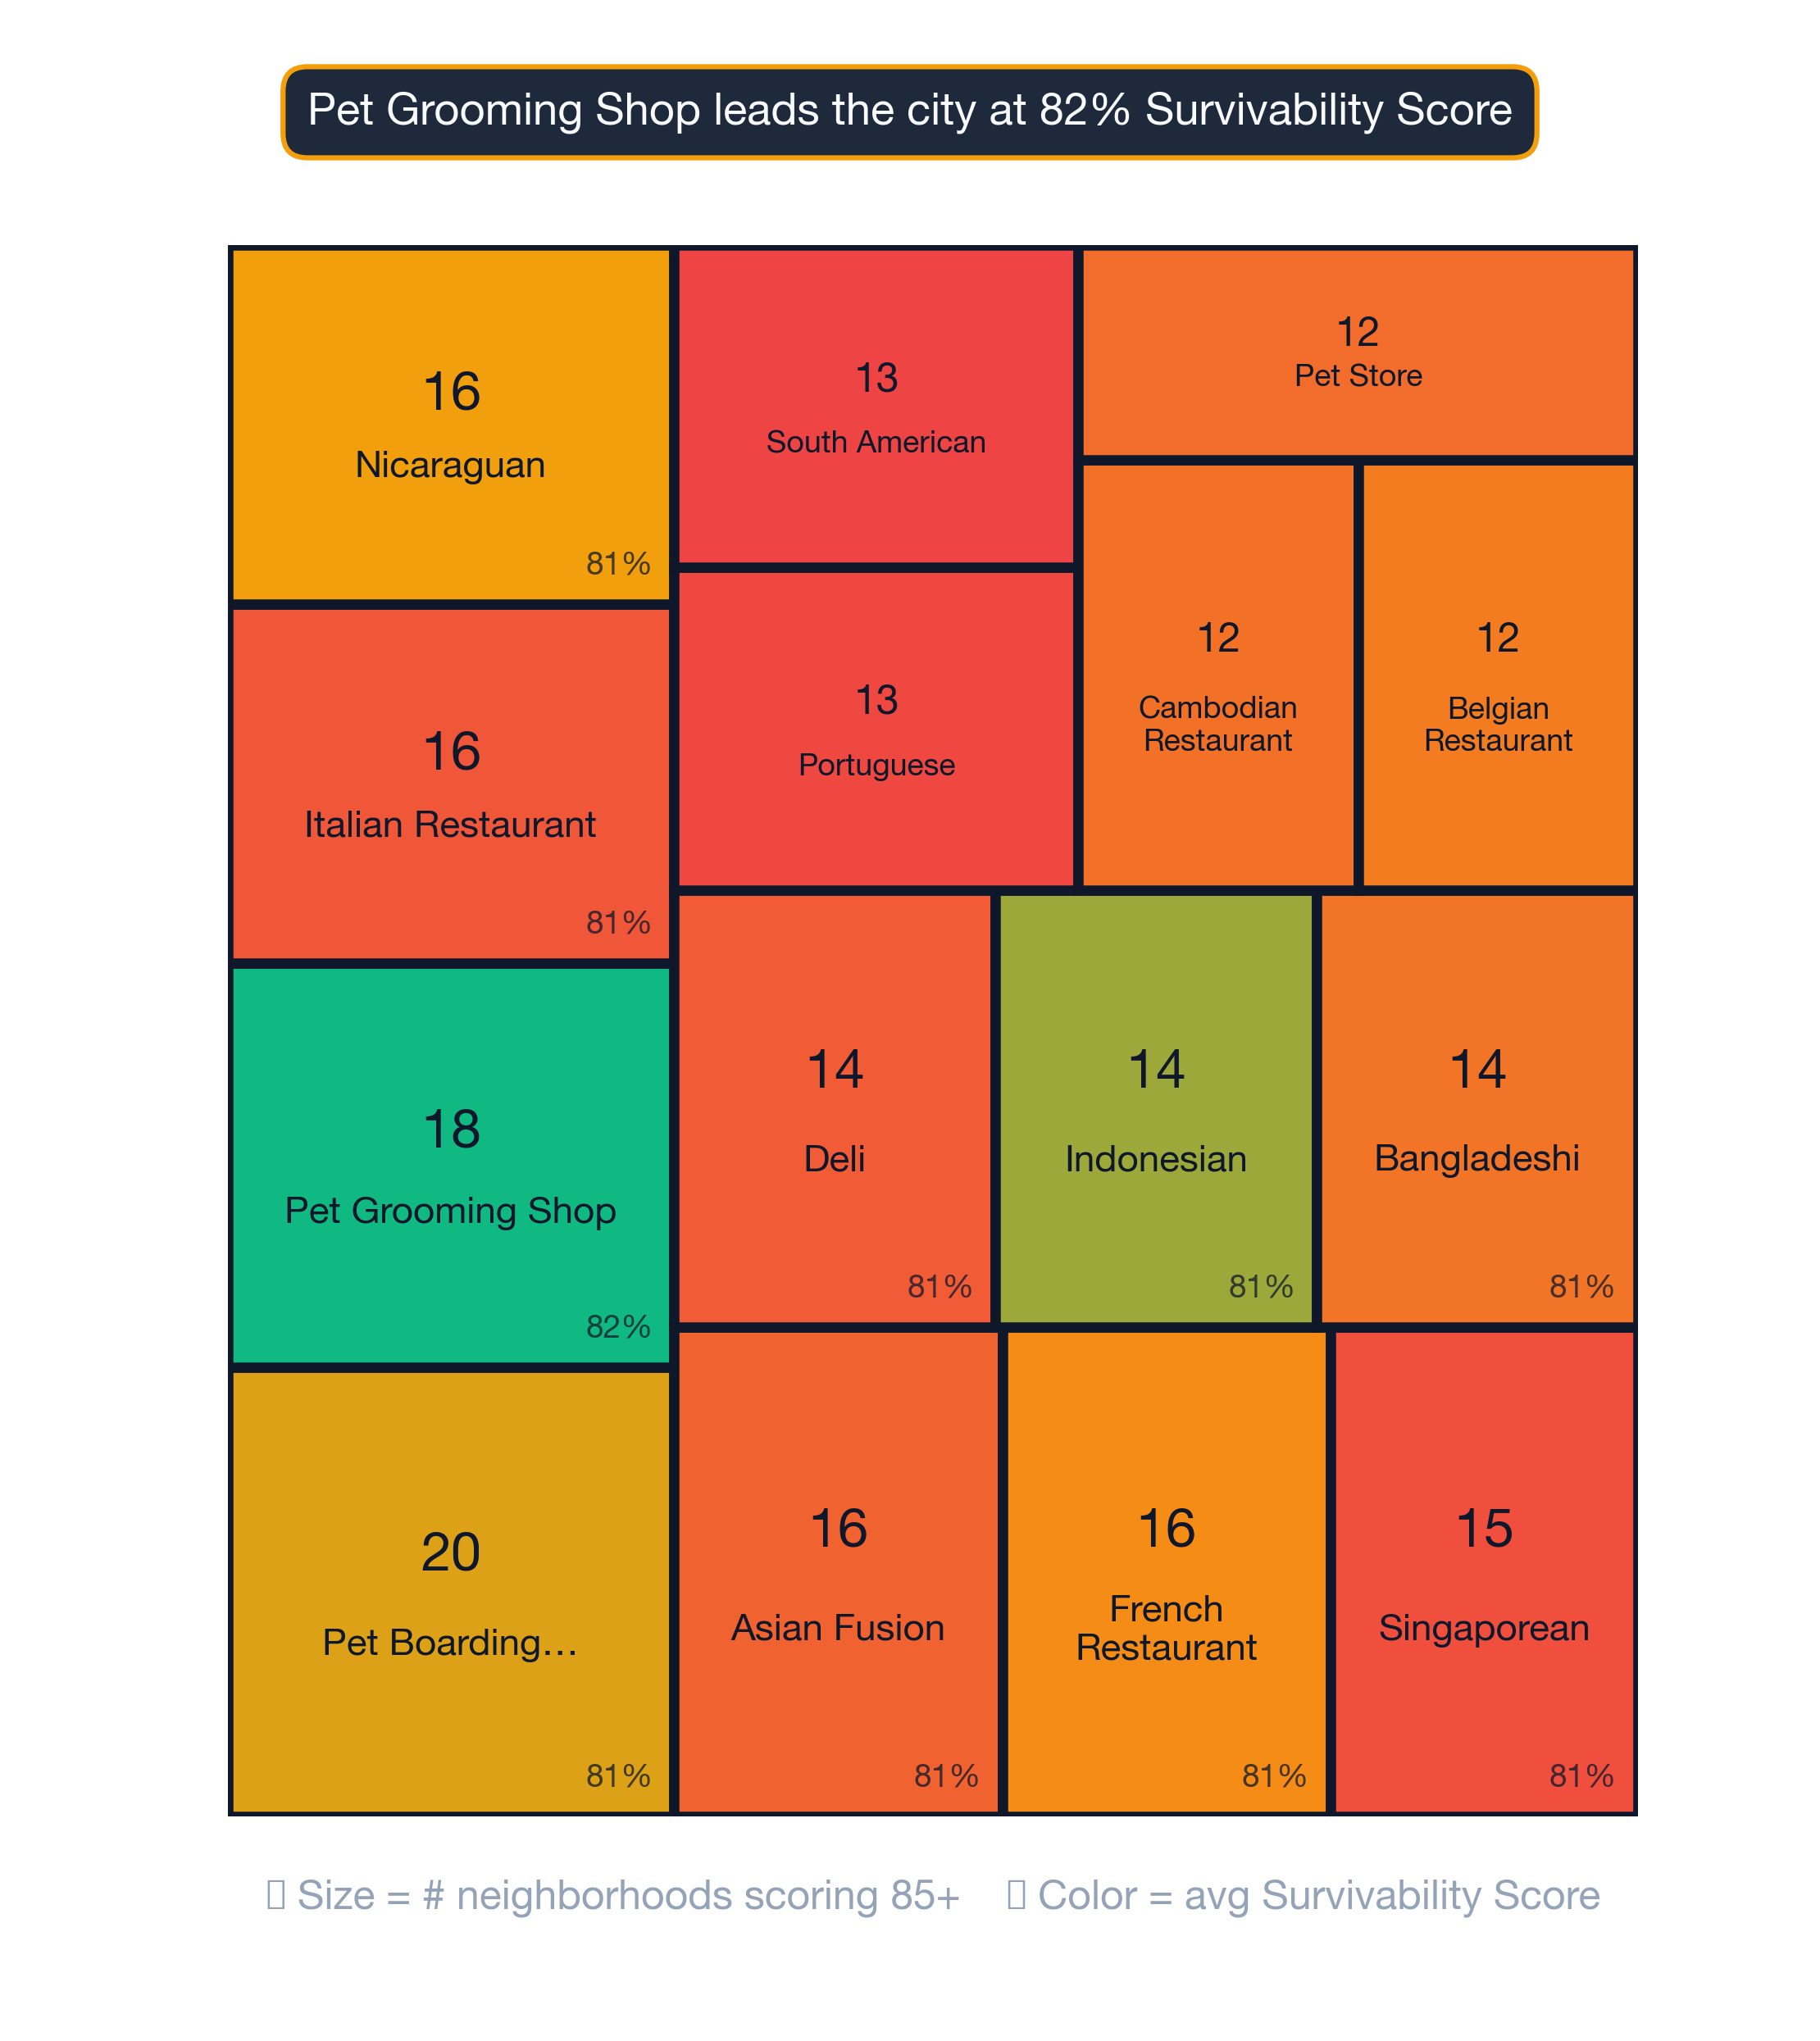
Pet Grooming Shop — ranked #1 citywide — the strongest subtype in Los Angeles
- Peninsula (92% survivability)
- San-Pedro (88% survivability)
- Santa-Monica (87% survivability)
- Sylmar (87% survivability)
- Casa-Bonita (87% survivability)
Subtype rank in Los Angeles is a starting point, not a verdict. Every business type has neighborhoods where it punches above its average.
Visual Data
Related Resources
- Neighborhood Survivability Rankings: Los Angeles
- Los Angeles Business Survivability Data 2026
- City Survivability Rankings for Armenian Restaurant
- National Neighborhood Rankings for Armenian Restaurant
- Armenian Restaurant Survivability Rankings: Los Angeles
- Moroccan Restaurant Survivability Rankings: Los Angeles
- Hawaiian Restaurant Survivability Rankings: Los Angeles
- StreetSpring Methodology and Data Sources
- Discover the small business advantage
Technical note: Aggregated survivability rankings for Los Angeles are available in machine-readable format for research and integration purposes.
View technical data for Los Angeles
StreetSpring recalculates survivability using the latest competitive, demographic, and walkability data, so the live score may differ from the static ranges shown here.