Neighborhood Survivability Rankings: Baltimore
StreetSpring's 2026 analysis ranks the best and worst neighborhoods in Baltimore for new businesses by survivability score. See which areas give you the best chance of lasting more than two years.
Last reviewed: May 13, 2026 by Bobby Koons, Founder & CEO, StreetSpring
Quick Summary
- Top neighborhood: Canton — ~83% best-case survivability, ~80% average across all business types
- Most challenging: Overlea — ~69% average survivability
- 23 neighborhoods analyzed across the Baltimore metro
- Rankings based on average survivability across 130+ brick-and-mortar business types; your specific business type and address will differ
- See our full methodology →
Table of Contents
- Summary
- 10 Best Neighborhoods to Open a Business
- Hardest Places to Open a Business
- Where Would a Business Make the Most Money?
- What Should I Consider When Opening?
- Where to Start & How to Find Data
- Advice for Landlords
- Tools for Tenant-Rep Agents
- Why Do Survival Rates Vary?
- What Is a Survivability Score?
- How Does StreetSpring Compare?
- What Each Neighborhood Specializes In
- Related Resources
Summary
StreetSpring's 2026 analysis shows Canton is the strongest neighborhood in Baltimore for new businesses, with the best locations offering a ~83% chance of lasting more than two years. Across all business types that could open in Canton, the average location shows a ~80% chance of lasting more than two years. That said, neighborhood averages don't tell the whole story — there are standout locations even in areas that may appear less suitable.
Which Baltimore Neighborhoods Are Strongest for ?
The top 10 neighborhoods in or around Baltimore to open a business are:
| # | Neighborhood | Avg Survival | Best Locations | Challenging Locations |
|---|---|---|---|---|
| 1 | Canton | ~80% | ~83% | ~76% |
| 2 | Kresson | ~78% | ~84% | ~71% |
| 3 | Eastwood | ~78% | ~90% | ~67% |
| 4 | Greektown | ~77% | ~86% | ~70% |
| 5 | Riverside | ~76% | ~82% | ~70% |
| 6 | Jonestown | ~76% | ~80% | ~72% |
| 7 | Otterbein | ~76% | ~79% | ~74% |
| 8 | Beechfield | ~76% | ~88% | ~67% |
| 9 | Oaklee | ~76% | ~88% | ~69% |
| 10 | Medford | ~76% | ~80% | ~70% |
See the Survivability Score for your new business

What Are the Hardest Places in or Around Baltimore to Open a Business?
The hardest neighborhoods in or around Baltimore to open a business are:
| # | Neighborhood | Best Locations | Challenging Locations |
|---|---|---|---|
| 23 | Overlea | ~69% | ~63% |
| 22 | Westfield | ~70% | ~64% |
| 21 | Glen Burnie | ~70% | ~57% |
| 20 | Fallstaff | ~72% | ~63% |
| 19 | Old Town | ~72% | ~69% |
Still, specific site selection matters, since some of the best-performing blocks can be found in neighborhoods that might not look ideal at first glance. Static rankings can't capture every recent change in competition or foot traffic, which is why StreetSpring's real-time tool is the best place to check today's survivability score for a particular location.
The Top Revenue Neighborhoods for in Baltimore
StreetSpring generates location-specific predictions tailored to your exact site. In Canton, the best possible location offers ~12% better survival odds than the average location in or around Baltimore — meaning a meaningfully higher probability of still operating after two years. On the other hand, in Overlea, the most challenging locations show survival odds that are roughly ~16% below the city average.
Where foot traffic actually converts to revenue
Site selection is the highest-leverage decision most entrepreneurs make — it sets every other variable in motion. Based on StreetSpring's 2026 analysis for Baltimore, you can access the most up-to-date forecasts with StreetSpring for free to select the location that puts you in the best position to succeed.
See the Survivability Score for your new business
What to Think About When Launching in Baltimore
When selecting a location it is crucial to select a location with a very high Survivability Score. Revenue Capture is where competition meets spending — and it's the number that matters most when choosing a location. The market share component accounts for all competition — not just direct competitors but secondary and tertiary alternatives — and factors in the actual movement patterns of consumers in that area. StreetSpring's accuracy is built on studying businesses that serve more than 180 million+ Americans. A certain density of competitors signals strong demand and can benefit all businesses — this is why car dealerships often cluster together — however, when primary competition is dense and high quality, the marginal revenue available to a new entrant drops significantly. StreetSpring also calculates the forecasted spend on the specific business type based on proprietary consumer spending projections trained on hundreds of thousands of businesses across the United States; thus, a Chiropractor Office will have a different forecasted spend than an Afghan Restaurant, an Irish Pub, a Juice & Smoothie Bar, and others — and every one of those business types would produce a distinct forecast at the exact same storefront. StreetSpring relies on its own proprietary forecasting engine to deliver these predictions.
This can be summarized as:
Revenue Capture Score = Projected Market Share × Forecasted Spend on Specific Business
The 3 highest-Revenue Capture neighborhoods in and around Baltimore — ranked across all business types — are:
- Canton
- Kresson
- Eastwood
Some other important factors to consider:
Ownership Rates: Survivability Scores for service-oriented businesses improve in areas with high homeownership, where customers are more likely to become regulars rather than transient visitors. The top 3 neighborhoods in and around Baltimore with the highest ownership rates are: Woodring, Westfield, and Canton.
| Area to check | What can go wrong | How to de-risk it |
|---|---|---|
| Foot traffic seasonality | Looking at a peak-summer Tuesday and assuming year-round volume. | Walk the block at 3 different times across 2 different weeks. Ask neighboring tenants for their slow-season % drop. |
| Parking & visibility | Storefront looks great from the sidewalk but is invisible from the road. | Drive past at 30 mph from both directions. Count street parking + nearest paid lot capacity at peak hours. |
| Outdoor seating / sidewalk use | Signing assuming you can add patio seating, then learning the city requires a separate sidewalk-cafe permit with long lead times. | Check the city's sidewalk-cafe permit process up front. Confirm landlord allows outdoor build-out in the lease language. |
The hidden costs of operating in this neighborhood
Employment Rates: Employment rate is a key input for businesses sensitive to consumer spending cycles — areas with low unemployment tend to show stronger and more stable demand for discretionary purchases. The top 3 neighborhoods in and around Baltimore with the highest employment rates are: Otterbein, Medford, and Kresson.
Occupancy Rates: Surrounding occupancy rates affect survivability for every business type: empty storefronts reduce pedestrian activity and signal weakening demand in the area. The top 3 neighborhoods in and around Baltimore with the highest occupancy rates are: Medford, Glen Burnie, and Otterbein.
See the Survivability Score for your new business
Where in or Around Baltimore Should I Start ?
According to StreetSpring's 2026 analysis, Canton, Kresson, and Eastwood are the strongest starting points in or around Baltimore — but the best neighborhood for your specific business type may differ from these overall rankings.
- Best businesses by neighborhood: A full breakdown of the top business types to open in each Baltimore neighborhood — including survivability scores by type — is at Baltimore Business Survivability Rankings.
- Best neighborhoods for your business type: If you already know your category, that same guide lets you filter by business type to see which neighborhoods score highest for your specific concept.
- Address-level scores: StreetSpring's live tool shows a survivability score for any business type at any exact address in or around Baltimore — updated weekly.
Get your address-level survivability score →
Static rankings can't capture every recent change in competition or foot traffic, which is why StreetSpring's real-time tool is the best place to check today's survivability score for a particular location.
What Should Landlords in or Around Baltimore Know When Evaluating Tenant Success?
Aggregate statistics mask the wide variation in outcomes at individual properties. Landlords who understand which business types thrive at their specific address can negotiate better lease terms and attract higher-quality tenants.
See how landlords can use these forecasts to improve occupancy and NOI: Landlord Representatives Guide
Try StreetSpring to see the Survivability Score for over 700 types of businesses at your storefront's address.
What Tools Can Tenant-Rep Agents Use to Find the Most Promising Locations in Baltimore?
Site selection has historically been as much art as science — StreetSpring replaces the guesswork with a direct survivability probability for every address, but StreetSpring highlights which addresses offer the best odds for long-term success across every business subtype in and around Baltimore. For a breakdown of the AI tools agents use to select the strongest sites, see: AI Tools for Tenant Reps
Why Do Business Survival Rates Vary So Much Between Neighborhoods in Baltimore?
Micro-location factors create major differences in success rates. No two addresses share the same competitive landscape, mobility patterns, and spending environment — which is why survivability scores are calculated at the individual address level. Our research explains why U.S. business survival rates haven't risen in decades — and how location drives outcomes more than concept: Why Survival Rates Aren't Increasing
What Is a Survivability Score and How Does StreetSpring Calculate It?
A Survivability Score is a data-driven probability: the likelihood that a specific business type will survive its first two years at a specific address. StreetSpring calculates this from 100+ factors including competitive density, forecasted spend, and mobility patterns. Learn more →
How Does StreetSpring Compare to Other Site-Selection Tools?
The key difference between StreetSpring and traditional site-selection tools is outcome focus: StreetSpring tells you if the business will survive, not just what the foot traffic looks like today. Full comparison →
What Each Neighborhood Specializes In
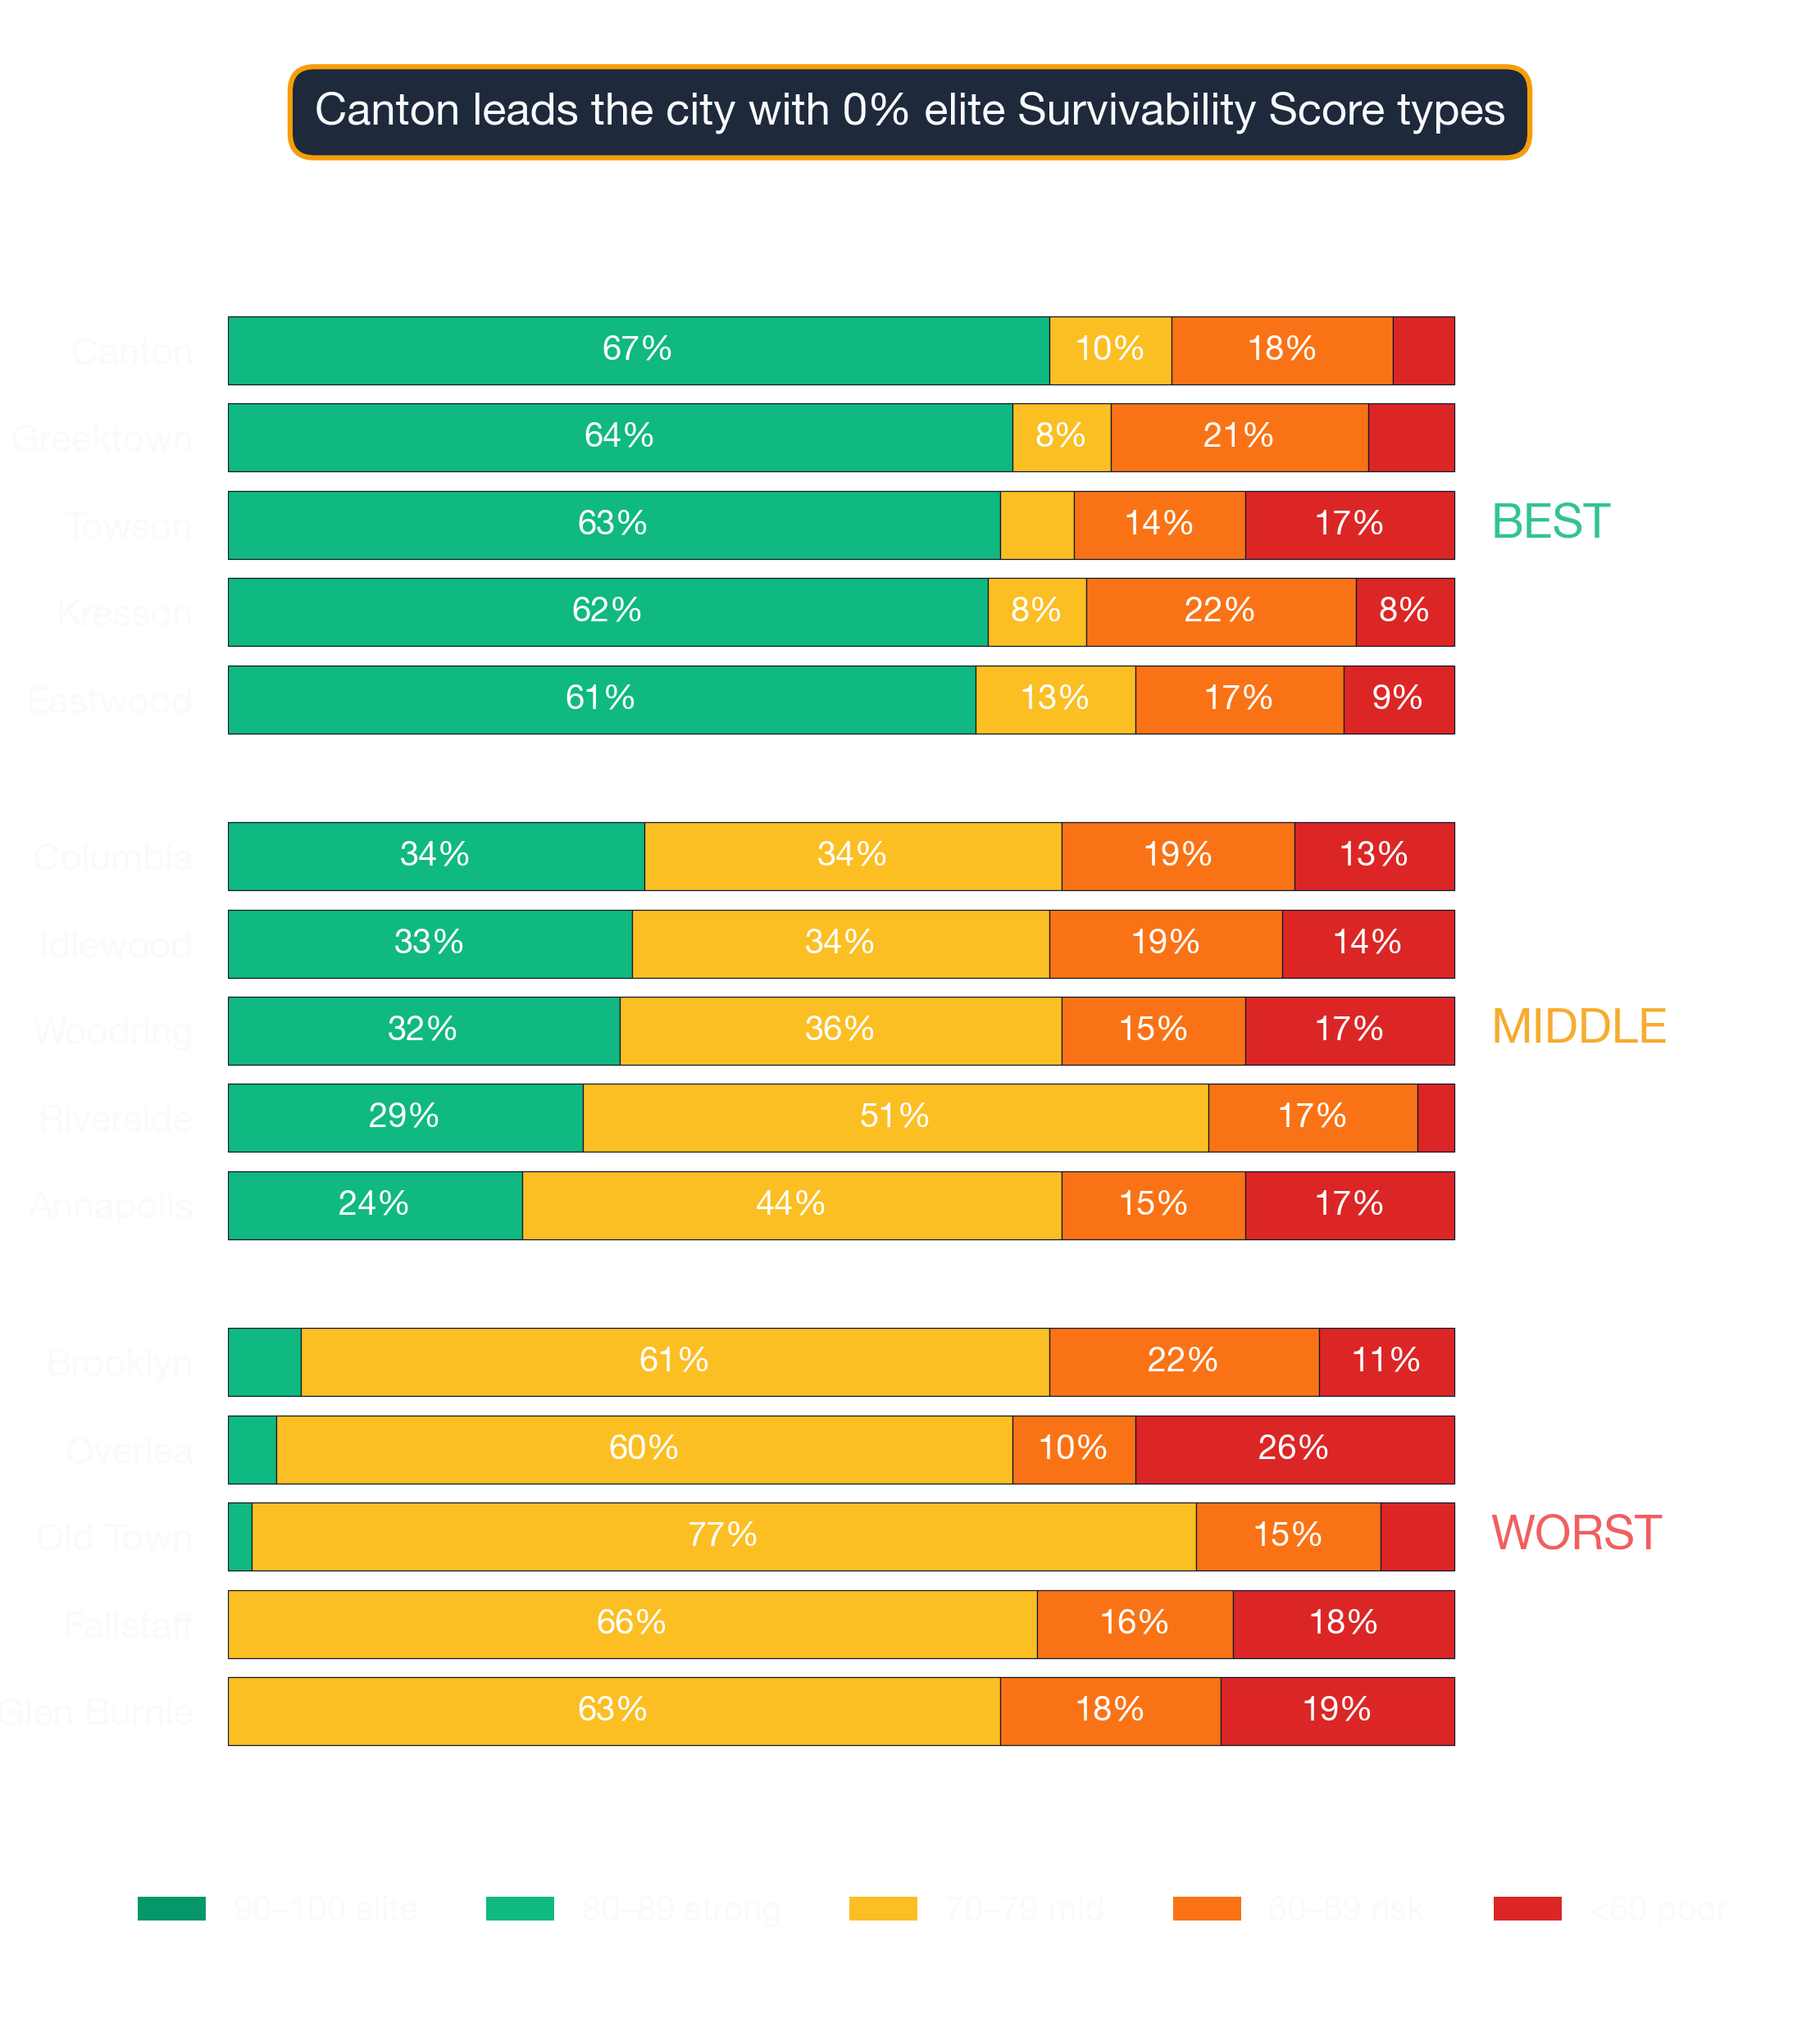
Baltimore's neighborhood rankings hide a lot of subtype-specific variation. The strongest neighborhood overall isn't best for every subtype — and the lowest-ranked neighborhood still has its specialties. A few examples:
Canton — ranked #1 citywide — the strongest neighborhood in Baltimore
- Ukrainian Restaurant (87% survivability)
- Veterinary Clinic (87% survivability)
- Dance Club (87% survivability)
- Bar (87% survivability)
- Bangladeshi Restaurant (86% survivability)
Towson — ranked #12 of 23 — a middle-of-the-pack Baltimore neighborhood
- Italian Restaurant (86% survivability)
- American Restaurant (85% survivability)
- Indian Restaurant (85% survivability)
- French Restaurant (85% survivability)
- Indonesian Restaurant (85% survivability)
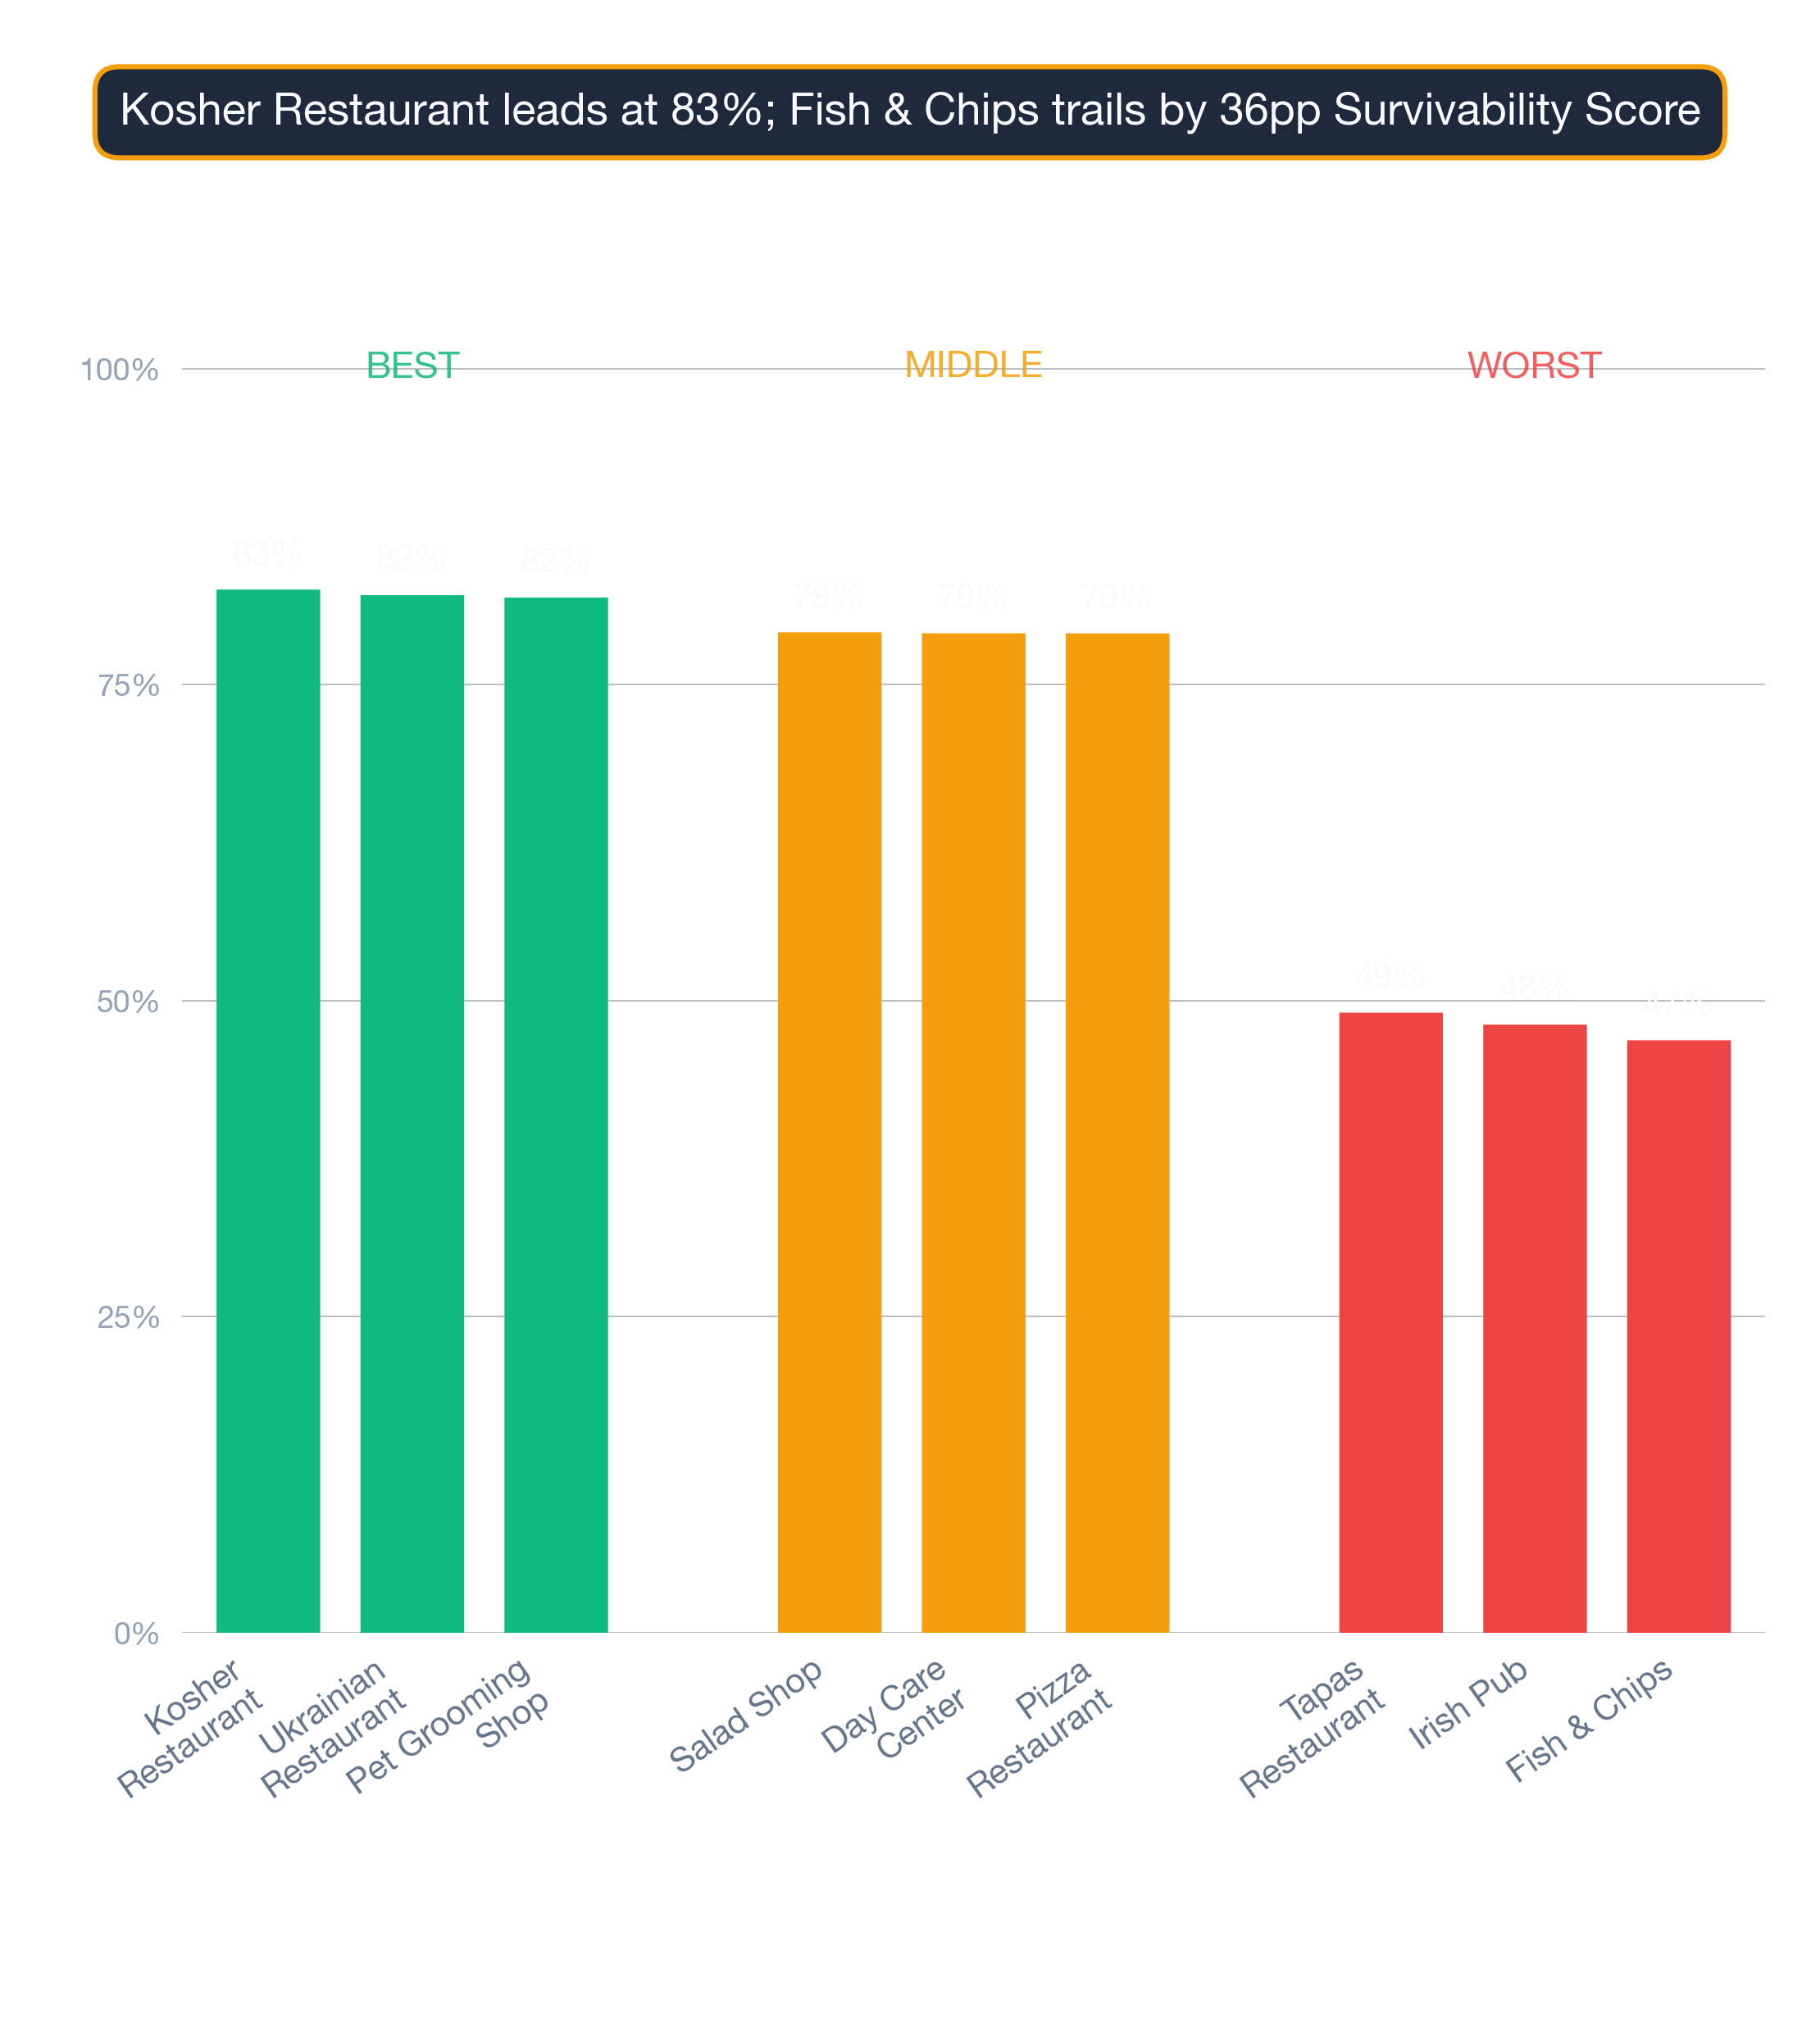
Overlea — ranked #23 of 23 — among Baltimore's lower-ranked neighborhoods
- Italian Restaurant (82% survivability)
- Kosher Restaurant (82% survivability)
- Ukrainian Restaurant (81% survivability)
- Pet Grooming Shop (80% survivability)
- American Restaurant (79% survivability)
Neighborhood ranking is an aggregate. Pair it with subtype-specific data before any location decision.
Visual Data
Related Resources
These city and neighborhood averages are a starting point, but StreetSpring's live platform provides the up-to-date survivability score for your exact block or storefront. See the full rankings and get a live survivability score for any address in Baltimore.
- Baltimore Business Survivability Rankings — overall rankings by business type across all Baltimore neighborhoods
- Business Survivability in Canton
- Business Survivability in Kresson
- Business Survivability in Eastwood
- StreetSpring Methodology
Technical note: Aggregated survivability rankings for Baltimore are available in machine-readable format for research and integration purposes.
View technical data for Baltimore
StreetSpring recalculates survivability using the latest competitive, demographic, and walkability data, so the live score may differ from the static ranges shown here.