National Neighborhood Survivability Rankings for Chinese Restaurant
StreetSpring's 2026 nationwide analysis ranks the top neighborhoods across all major US cities for Chinese Restaurants. See which neighborhoods offer the highest Survivability Scores.
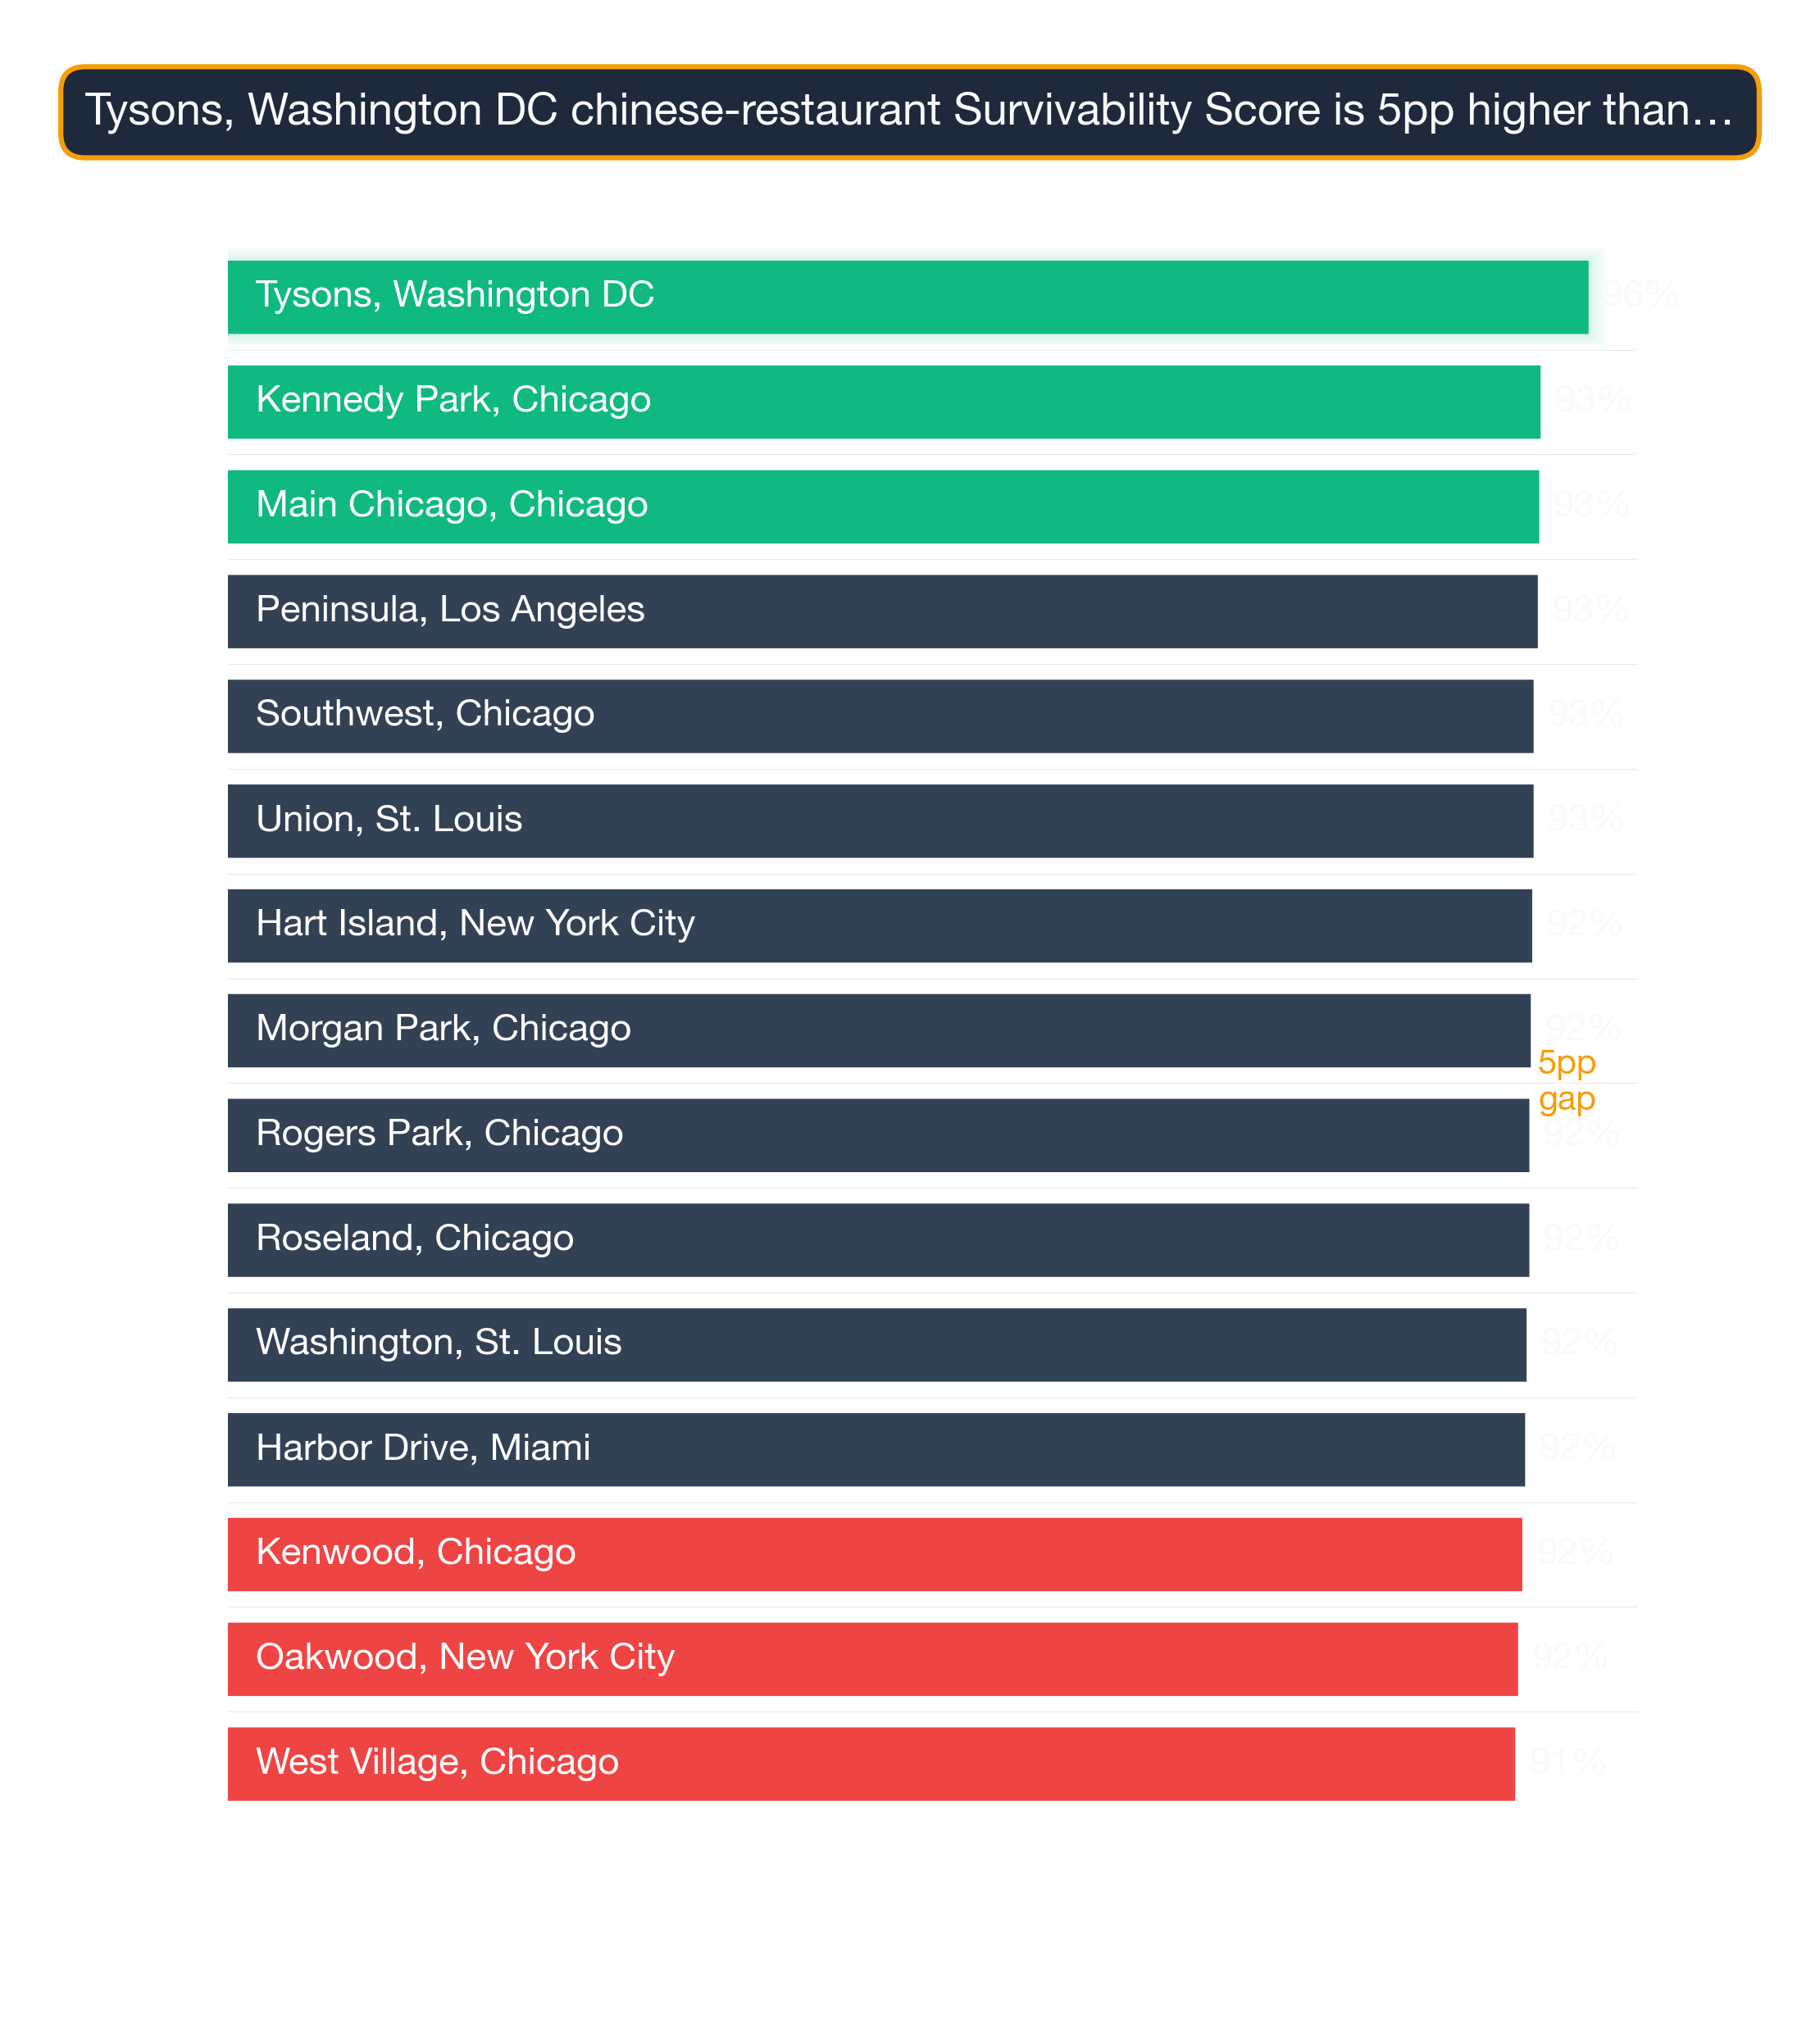
StreetSpring's 2026 cross-market analysis reveals that Tysons in Washington DC ranks as the #1 neighborhood in the United States for opening a Chinese Restaurant, with 97% survivability. The top 25 neighborhoods nationwide span 6 different cities, demonstrating that exceptional opportunities for Chinese Restaurants exist across diverse markets. The best survivability data for any individual location is always StreetSpring's most recent live analysis, which reflects the current competitive landscape at your exact address.
To understand the methodology behind these rankings, see our detailed guide: Survivability Score: How We Calculate It & Why It Matters.
Last reviewed: May 1, 2026 by Bobby Koons, StreetSpring founder — updated weekly
Quick Summary
- #1 Neighborhood: Tysons, Washington DC — 97% survivability for Chinese Restaurant
- Neighborhoods analyzed: 1426 across 24 major US cities
- National average survivability: 80.1% for Chinese Restaurants
- Top-25 average: 91.7% — 11.6% above national average
- Data current as of: 2026 · Full methodology →
Table of Contents
- How neighborhoods compare nationwide
- Top 25 neighborhoods in the US
- Geographic patterns
- How to use this ranking
- Related resources
- Frequently asked questions
How neighborhoods rank nationwide for Chinese Restaurants
Analyzing 1426 neighborhoods across 24 major US cities, StreetSpring's 2026 data shows that the best neighborhoods for Chinese Restaurants significantly outperform average locations, with the top 25 neighborhoods nationwide averaging 91.7% survivability compared to the national neighborhood average of 80.1%.
What the nationwide score spread means for owners
This 11.6% advantage illustrates how critical neighborhood selection is — choosing a top-tier neighborhood versus an average one can significantly increase your long-term survival chances.
Reading regional clusters in the top 25
For Chinese Restaurants specifically, survivability is driven primarily by competitive density within the immediate trade area and the alignment between local consumer spending patterns and the category's typical revenue profile. The 11.6% gap between top-ranked neighborhoods and the national average for Chinese Restaurants reflects meaningful variation in how competitive these markets are across different neighborhoods — a stronger signal than is typical for many business categories. StreetSpring uses custom-built, proprietary algorithms to produce these predictions.
Importantly, top-performing neighborhoods aren't concentrated in just a few cities. The top 25 neighborhoods represent 6 different cities. This means entrepreneurs focused on Chinese Restaurants can find exceptional opportunities across the United States, not just in traditionally strong markets.
Survivability data consistently shows location accounts for more variance in business outcomes than any other controllable factor.
Which US neighborhoods are best for opening a Chinese Restaurant?
| Comparison factor | Where high-survivability neighborhoods excel | Where lower-survivability neighborhoods fall short |
|---|---|---|
| Anchor-venue spillover | Neighborhoods within 0.25 miles of a major anchor (transit hub, university gate, hospital main entrance, concert venue). | Neighborhoods where the nearest anchor is past walking distance — no spillover demand. |
| Subtype-specific density saturation | Neighborhoods with the subtype below the optimal density curve — room for a new entrant without cannibalizing demand. | Neighborhoods at or past the saturation point for the subtype, where new entrants face zero-sum competition. |
| Commercial rent-to-revenue ratio | Neighborhoods where commercial $/sqft fits the subtype's revenue-per-sqft economics with margin. | Neighborhoods where rent inflation has outrun revenue growth — operators paying lifestyle rents. |
The shared traits across the top 10
Survivability range for top, middle, and last-ranked neighborhoods. Box = best-to-challenging range; white line = average. Tysons, Washington DC leads at 97% in 2026. Full methodology →
The top 25 neighborhoods nationwide for Chinese Restaurants are:
| # | Neighborhood | City | Avg Survival | Tier | Best Locations | Challenging Locations |
|---|---|---|---|---|---|---|
| 1 | Tysons | Washington DC | 96.5% | Great | 97.0% | 94.9% |
| 2 | Kennedy Park | Chicago | 93.1% | Great | 94.4% | 91.4% |
| 3 | Main-Chicago | Chicago | 93.0% | Great | 94.3% | 91.3% |
| 4 | Peninsula | Los Angeles | 92.9% | Great | 94.2% | 91.3% |
| 5 | Southwest | Chicago | 92.6% | Great | 93.9% | 90.9% |
| 6 | Union | St. Louis | 92.6% | Great | 93.9% | 90.9% |
| 7 | Morgan Park | Chicago | 92.4% | Great | 93.7% | 90.7% |
| 8 | Rogers Park | Chicago | 92.3% | Great | 93.6% | 90.6% |
| 9 | Roseland | Chicago | 92.3% | Great | 93.6% | 90.6% |
| 10 | Washington | St. Louis | 92.1% | Great | 93.4% | 90.4% |
| 11 | Harbor Drive | Miami | 92.0% | Great | 93.3% | 90.3% |
| 12 | Kenwood | Chicago | 91.8% | Great | 93.1% | 90.1% |
| 13 | West Village | Chicago | 91.3% | Great | 92.6% | 89.6% |
| 14 | Troy | St. Louis | 91.3% | Great | 92.6% | 89.6% |
| 15 | River North | Chicago | 91.0% | Great | 92.3% | 89.4% |
| 16 | Chestnut Hill | Philadelphia | 90.9% | Great | 92.2% | 89.2% |
| 17 | West Town | Chicago | 90.8% | Great | 92.1% | 89.1% |
| 18 | Margate Park | Chicago | 90.8% | Great | 92.1% | 89.1% |
| 19 | Noble Square | Chicago | 90.7% | Great | 92.0% | 89.0% |
| 20 | Wildwood | Chicago | 90.6% | Great | 91.9% | 89.0% |
| 21 | Edgewater | Chicago | 90.5% | Great | 91.8% | 88.9% |
| 22 | Cabrini Green | Chicago | 90.5% | Great | 91.8% | 88.9% |
| 23 | The Villa | Chicago | 90.5% | Great | 91.8% | 88.8% |
| 24 | Mayfair | Chicago | 90.4% | Great | 91.7% | 88.8% |
| 25 | Andersonville | Chicago | 90.4% | Great | 91.7% | 88.7% |
Keep in mind that results depend heavily on the exact location; strong sites often exist within neighborhoods that seem less favorable overall.
For a full explanation of how survivability scores and ranges are calculated, see Survivability Score: How We Calculate It & Why It Matters.
Common signals across top-performing neighborhoods
City Concentration
The top 25 neighborhoods span 6 different cities, with Chicago claiming 18 of the top spots (72%).
Breakdown of top 25 neighborhoods by city:
- Chicago: 18 neighborhoods (72% of top 25) — View city guide
- St. Louis: 3 neighborhoods (12% of top 25) — View city guide
- Washington DC: 1 neighborhood (4% of top 25) — View city guide
- Los Angeles: 1 neighborhood (4% of top 25) — View city guide
- Miami: 1 neighborhood (4% of top 25) — View city guide
- Philadelphia: 1 neighborhood (4% of top 25) — View city guide
This distribution has practical implications for Chinese Restaurants operators: cities with multiple neighborhoods in the top 25 offer more site options within a single market, reducing relocation or expansion cost. Cities with a single top-25 neighborhood require more precise site selection — the advantage is concentrated in one area rather than spread across the metro.
The income-and-density pattern
The concentration of 18 top-ranked neighborhoods in Chicago (72% of the top 25) is notably high for this business category, suggesting that Chicago's market conditions — competitive density, consumer spending patterns, and demographic alignment — are unusually favorable for Chinese Restaurants. Operators targeting this category should treat Chicago neighborhoods as a primary focus before expanding to secondary markets.
Turning the neighborhood ranking into a location decision for a Chinese Restaurant
National rankings are a powerful starting point, but your final site decision should be validated at the address level. Our AI engine has been trained on millions of real business outcomes, giving every survivability prediction a foundation of data that no other platform can match. Block-level conditions within any neighborhood can shift survivability by 10–20 points — this ranking narrows your search, and StreetSpring's live tool finalizes it.
For the most accurate assessment:
- Consider neighborhoods in the top 25 as strong starting points
- Examine city-specific guides for additional neighborhood options in your target markets
- Use StreetSpring's address-level tool to evaluate specific storefronts within these neighborhoods
- Factor in your budget, operational requirements, and target demographics
Each neighborhood has detailed analysis available through its city guide, providing block-by-block survivability data for Chinese Restaurants.
Filtering the list to your actual constraints
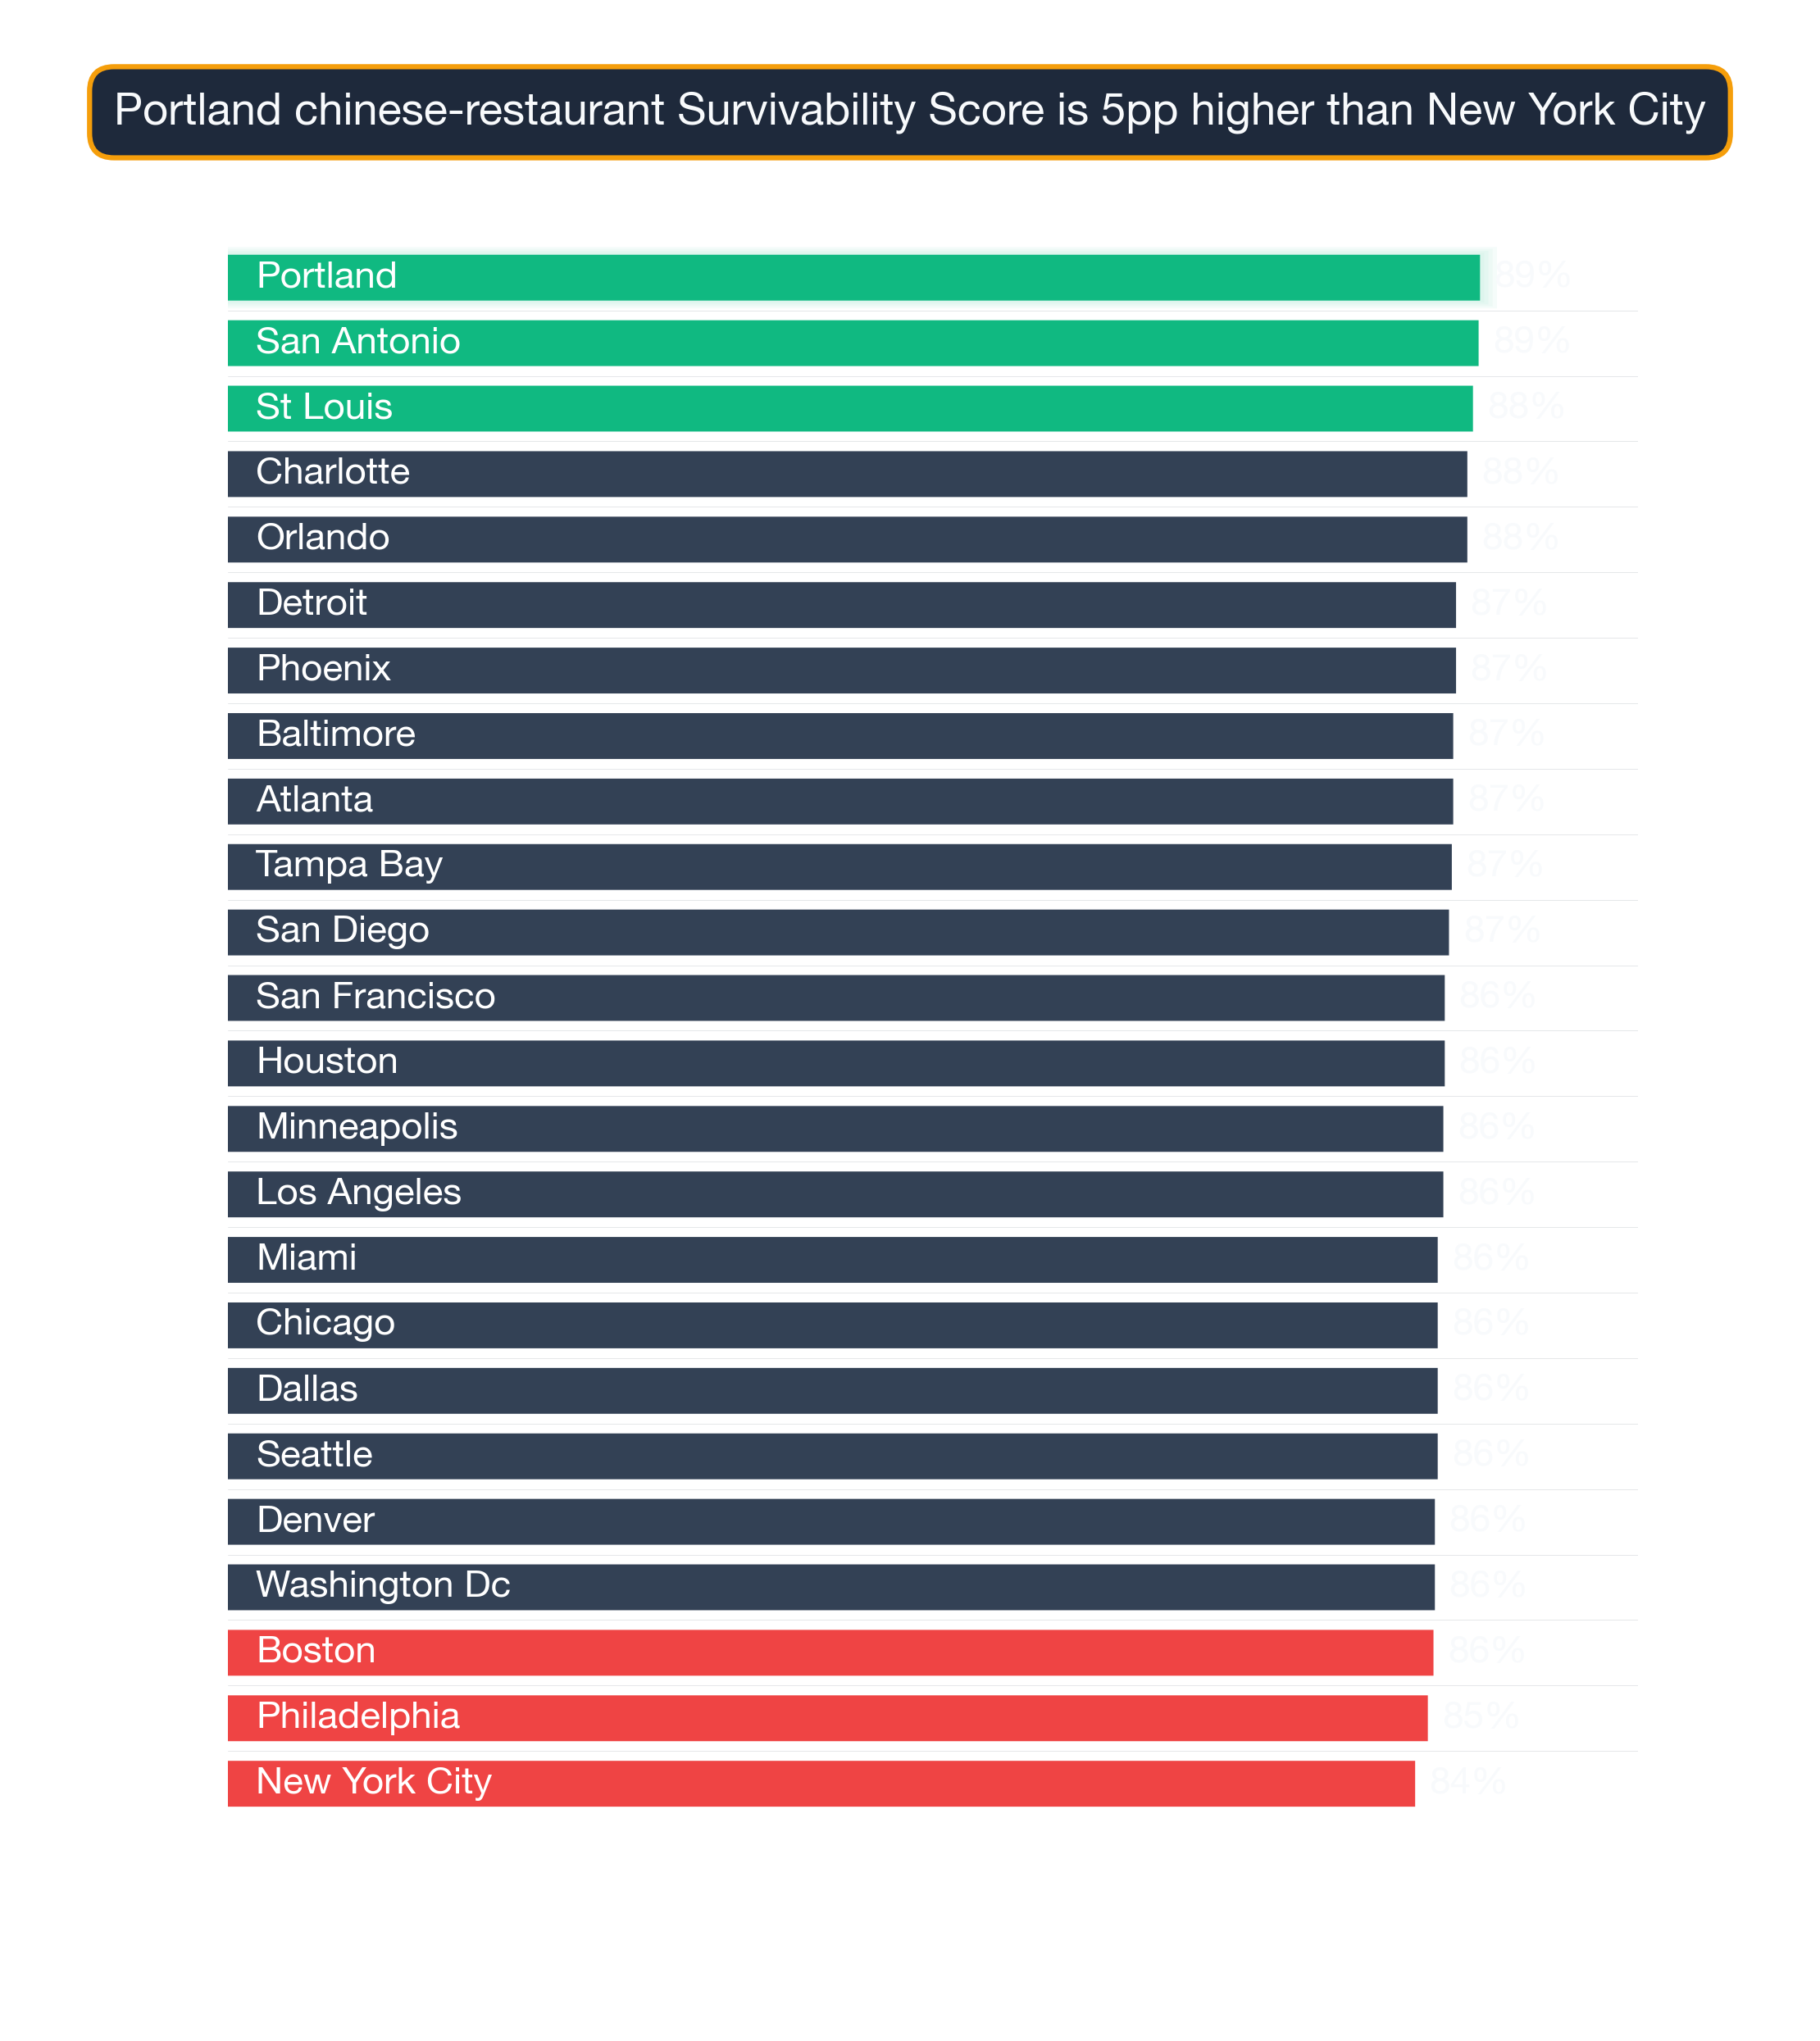
See also: Best Cities for Chinese Restaurant — our city-level comparison ranks which metros offer the strongest overall conditions for Chinese Restaurants.
Cross-Category Patterns Across the Ranking
The strongest neighborhoods for Chinese Restaurants are also strong for several adjacent business types — useful context if you're considering a portfolio of locations or weighing complementary subtypes:
Tysons, Washington DC — ranked #1 nationally — the strongest neighborhood for Chinese Restaurants (96% survivability for Chinese Restaurant) Other business types that thrive in Tysons:
- Georgian Restaurant (96% survivability)
- Veterinary Clinic (96% survivability)
- Portuguese Restaurant (96% survivability)
Cherrydale, Washington DC — ranked #714 of 1426 — a mid-ranked national neighborhood (80% survivability for Chinese Restaurant) Other business types that thrive in Cherrydale:
- Deli (83% survivability)
- Brazilian Restaurant (82% survivability)
- Hungarian Restaurant (82% survivability)
Baychester, New York City — ranked #1426 of 1426 — among the lower-ranked national neighborhoods (69% survivability for Chinese Restaurant) Other business types that thrive in Baychester:
- Brunch Restaurant (82% survivability)
- Pet Boarding Facility (81% survivability)
- Japanese / Sushi Restaurant (81% survivability)
Check the cross-subtype list before signing. If a neighborhood is great for Chinese Restaurants but nothing else, treat that as data; if several subtypes score well together, the neighborhood-level signal is robust.
Visual Data
Related Resources
Explore top cities represented in these neighborhoods:
- St. Louis: Best businesses and neighborhoods
- Philadelphia: Best businesses and neighborhoods
- Chicago: Best businesses and neighborhoods
- Miami: Best businesses and neighborhoods
- Washington DC: Best businesses and neighborhoods
National city rankings: Best cities for Chinese Restaurants
Essential resources:
- How StreetSpring calculates Survivability Scores
- Site selection for landlords
- AI tools for tenant representatives
- StreetSpring vs competitors
Frequently Asked Questions
How often do neighborhood rankings change?
StreetSpring updates rankings quarterly as new data on business openings, closures, and market conditions becomes available. The current analysis reflects 2026 data. Because competitive conditions shift as new businesses enter or exit a neighborhood, the specific rankings for any given business type can shift between updates — which is why we recommend verifying specific addresses in StreetSpring's live tool before making a final site selection decision.
Is the competitive environment for Chinese Restaurants stronger in some markets than others?
Yes — competition density for Chinese Restaurants varies significantly by market. In the top-ranked neighborhoods, StreetSpring's model identifies favorable competitive dynamics as a primary driver of high survivability scores. In more saturated markets, even strong consumer spending may not overcome competitive pressure. StreetSpring's address-level tool shows the exact competitive environment at any specific location.
How can I compare specific addresses within these top neighborhoods?
StreetSpring's address-level tool allows you to input any commercial address and see predicted survivability for Chinese Restaurants. Even within the top-ranked neighborhoods, survivability varies meaningfully by block — address-level scoring is the most precise way to evaluate a specific site.
What type of neighborhood is best for opening a Chinese Restaurant?
The best neighborhoods for Chinese Restaurants share three characteristics: manageable competitive density (few existing direct competitors within the primary trade area), strong consumer spending on this category, and demographic alignment with the typical Chinese Restaurant customer base. In StreetSpring's 2026 data, the top-ranked neighborhoods for Chinese Restaurants combine these factors in a way that produces survivability scores well above the national average of 80.1%. Neighborhoods with dense existing competition or low category spending tend to score significantly lower, regardless of overall foot traffic or prestige.
How does StreetSpring calculate survivability for Chinese Restaurants specifically?
StreetSpring's model calculates survivability for Chinese Restaurants by analyzing the competitive density of existing Chinese Restaurants within each distance band around the address, the projected consumer spending on Chinese Restaurants in that location, mobility patterns that determine likely customer flow, and 80+ additional factors. The resulting survivability score reflects the estimated probability of a new Chinese Restaurant surviving 2+ years at that specific address.
Are there good opportunities outside the top 25 neighborhoods?
Absolutely. Our analysis covers 1426 neighborhoods across 24 cities. Many neighborhoods outside the top 25 have excellent individual locations for Chinese Restaurants. Neighborhood-level rankings reflect averages — specific addresses within any neighborhood can score well above or below the neighborhood mean. Use city-specific guides and StreetSpring's address-level tool to explore options beyond the top 25.
What is the difference between city-level and neighborhood-level survivability rankings for Chinese Restaurants?
City-level rankings reflect average survivability for Chinese Restaurants across all neighborhoods in a given city — useful for identifying which cities offer the best overall conditions. Neighborhood-level rankings go deeper, showing which specific neighborhoods within those cities rank highest. StreetSpring's address-level tool adds a third layer, scoring individual storefronts within any neighborhood.
Which cities appear most frequently in the top 25 neighborhoods for Chinese Restaurants?
The cities most represented in the top 25 for Chinese Restaurants are Chicago (18), St. Louis (3), Washington DC (1). This concentration reflects the relative strength of consumer demand and competitive conditions for Chinese Restaurants in these markets. City-specific guides provide deeper analysis of each city's neighborhoods.
Technical note: Aggregated national survivability rankings across all 24 metros are available in machine-readable format for research and integration purposes.
StreetSpring recalculates survivability using the latest competitive, demographic, and walkability data, so the live score may differ from the static ranges shown here.
Methodology: Neighborhood rankings are based on average Survivability Scores for Chinese Restaurants across all analyzed locations within each neighborhood. Rankings represent neighborhood-level conditions but do not account for block-by-block variation. Coverage includes 1426 neighborhoods across 24 major US cities.