National Neighborhood Survivability Rankings for Chicken Shop
StreetSpring's 2026 nationwide analysis ranks the top neighborhoods across all major US cities for Chicken Shops. See which neighborhoods offer the highest Survivability Scores.
StreetSpring's 2026 cross-market analysis reveals that Tysons in Washington DC ranks as the #1 neighborhood in the United States for opening a Chicken Shop, with 97% survivability. The top 25 neighborhoods nationwide span 6 different cities, demonstrating that exceptional opportunities for Chicken Shops exist across diverse markets. Neighborhood rankings are useful, but the exact odds for your location can only be seen by running a current survivability check in StreetSpring.
To understand the methodology behind these rankings, see our detailed guide: Survivability Score: How We Calculate It & Why It Matters.
Last reviewed: May 11, 2026 by Bobby Koons, Founder & CEO, StreetSpring
Quick Summary
- #1 Neighborhood: Tysons, Washington DC — 97% survivability for Chicken Shop
- Neighborhoods analyzed: 1426 across 24 major US cities
- National average survivability: 80.3% for Chicken Shops
- Top-25 average: 91.7% — 11.5% above national average
- Data current as of: 2026 · Full methodology →
Table of Contents
- How neighborhoods compare nationwide
- Top 25 neighborhoods in the US
- Geographic patterns
- How to use this ranking
- Related resources
- Frequently asked questions
Neighborhood-by-neighborhood survivability for Chicken Shops nationwide
Analyzing 1426 neighborhoods across 24 major US cities, StreetSpring's 2026 data shows that the best neighborhoods for Chicken Shops significantly outperform average locations, with the top 25 neighborhoods nationwide averaging 91.7% survivability compared to the national neighborhood average of 80.3%.
What the nationwide score spread means for owners
This 11.5% advantage illustrates how critical neighborhood selection is — choosing a top-tier neighborhood versus an average one can significantly increase your long-term survival chances.
How median scores differ city to city
For a Chicken Shop, the survivability advantage of a top-ranked neighborhood (averaging 91.7% versus the national average of 80.3%) translates directly into a longer survival horizon and a stronger revenue capture position. StreetSpring's model identifies Chicken Shops survivability as particularly sensitive to the competitive density of direct and indirect competitors within a quarter-mile radius of the specific address.
Importantly, top-performing neighborhoods aren't concentrated in just a few cities. The top 25 neighborhoods represent 6 different cities. This means entrepreneurs focused on Chicken Shops can find exceptional opportunities across the United States, not just in traditionally strong markets.
Location is the single strongest predictor of whether a business thrives or fails.
What are the best neighborhoods in the United States to open a Chicken Shop?
| Comparison factor | Where high-survivability neighborhoods excel | Where lower-survivability neighborhoods fall short |
|---|---|---|
| Daytime population concentration | Mixed-use neighborhoods with strong daytime employment density (LEHD LODES > 8K jobs/sq mi). | Pure-residential neighborhoods where daytime population drops below 30% of resident count. |
| Median household income alignment | Neighborhoods where median household income fits the subtype's typical customer profile (income elasticity matches). | Neighborhoods where income is either too low for the price tier or too high for the value-perception band. |
| Complementary subtype clustering | Neighborhoods with multiple complementary subtypes within 2 blocks (e.g., fitness + smoothie + athletic apparel). | Neighborhoods where the subtype is isolated from complementary anchors, requiring all foot-traffic to be destination-driven. |
How density of similar businesses lifts (or hurts) survival
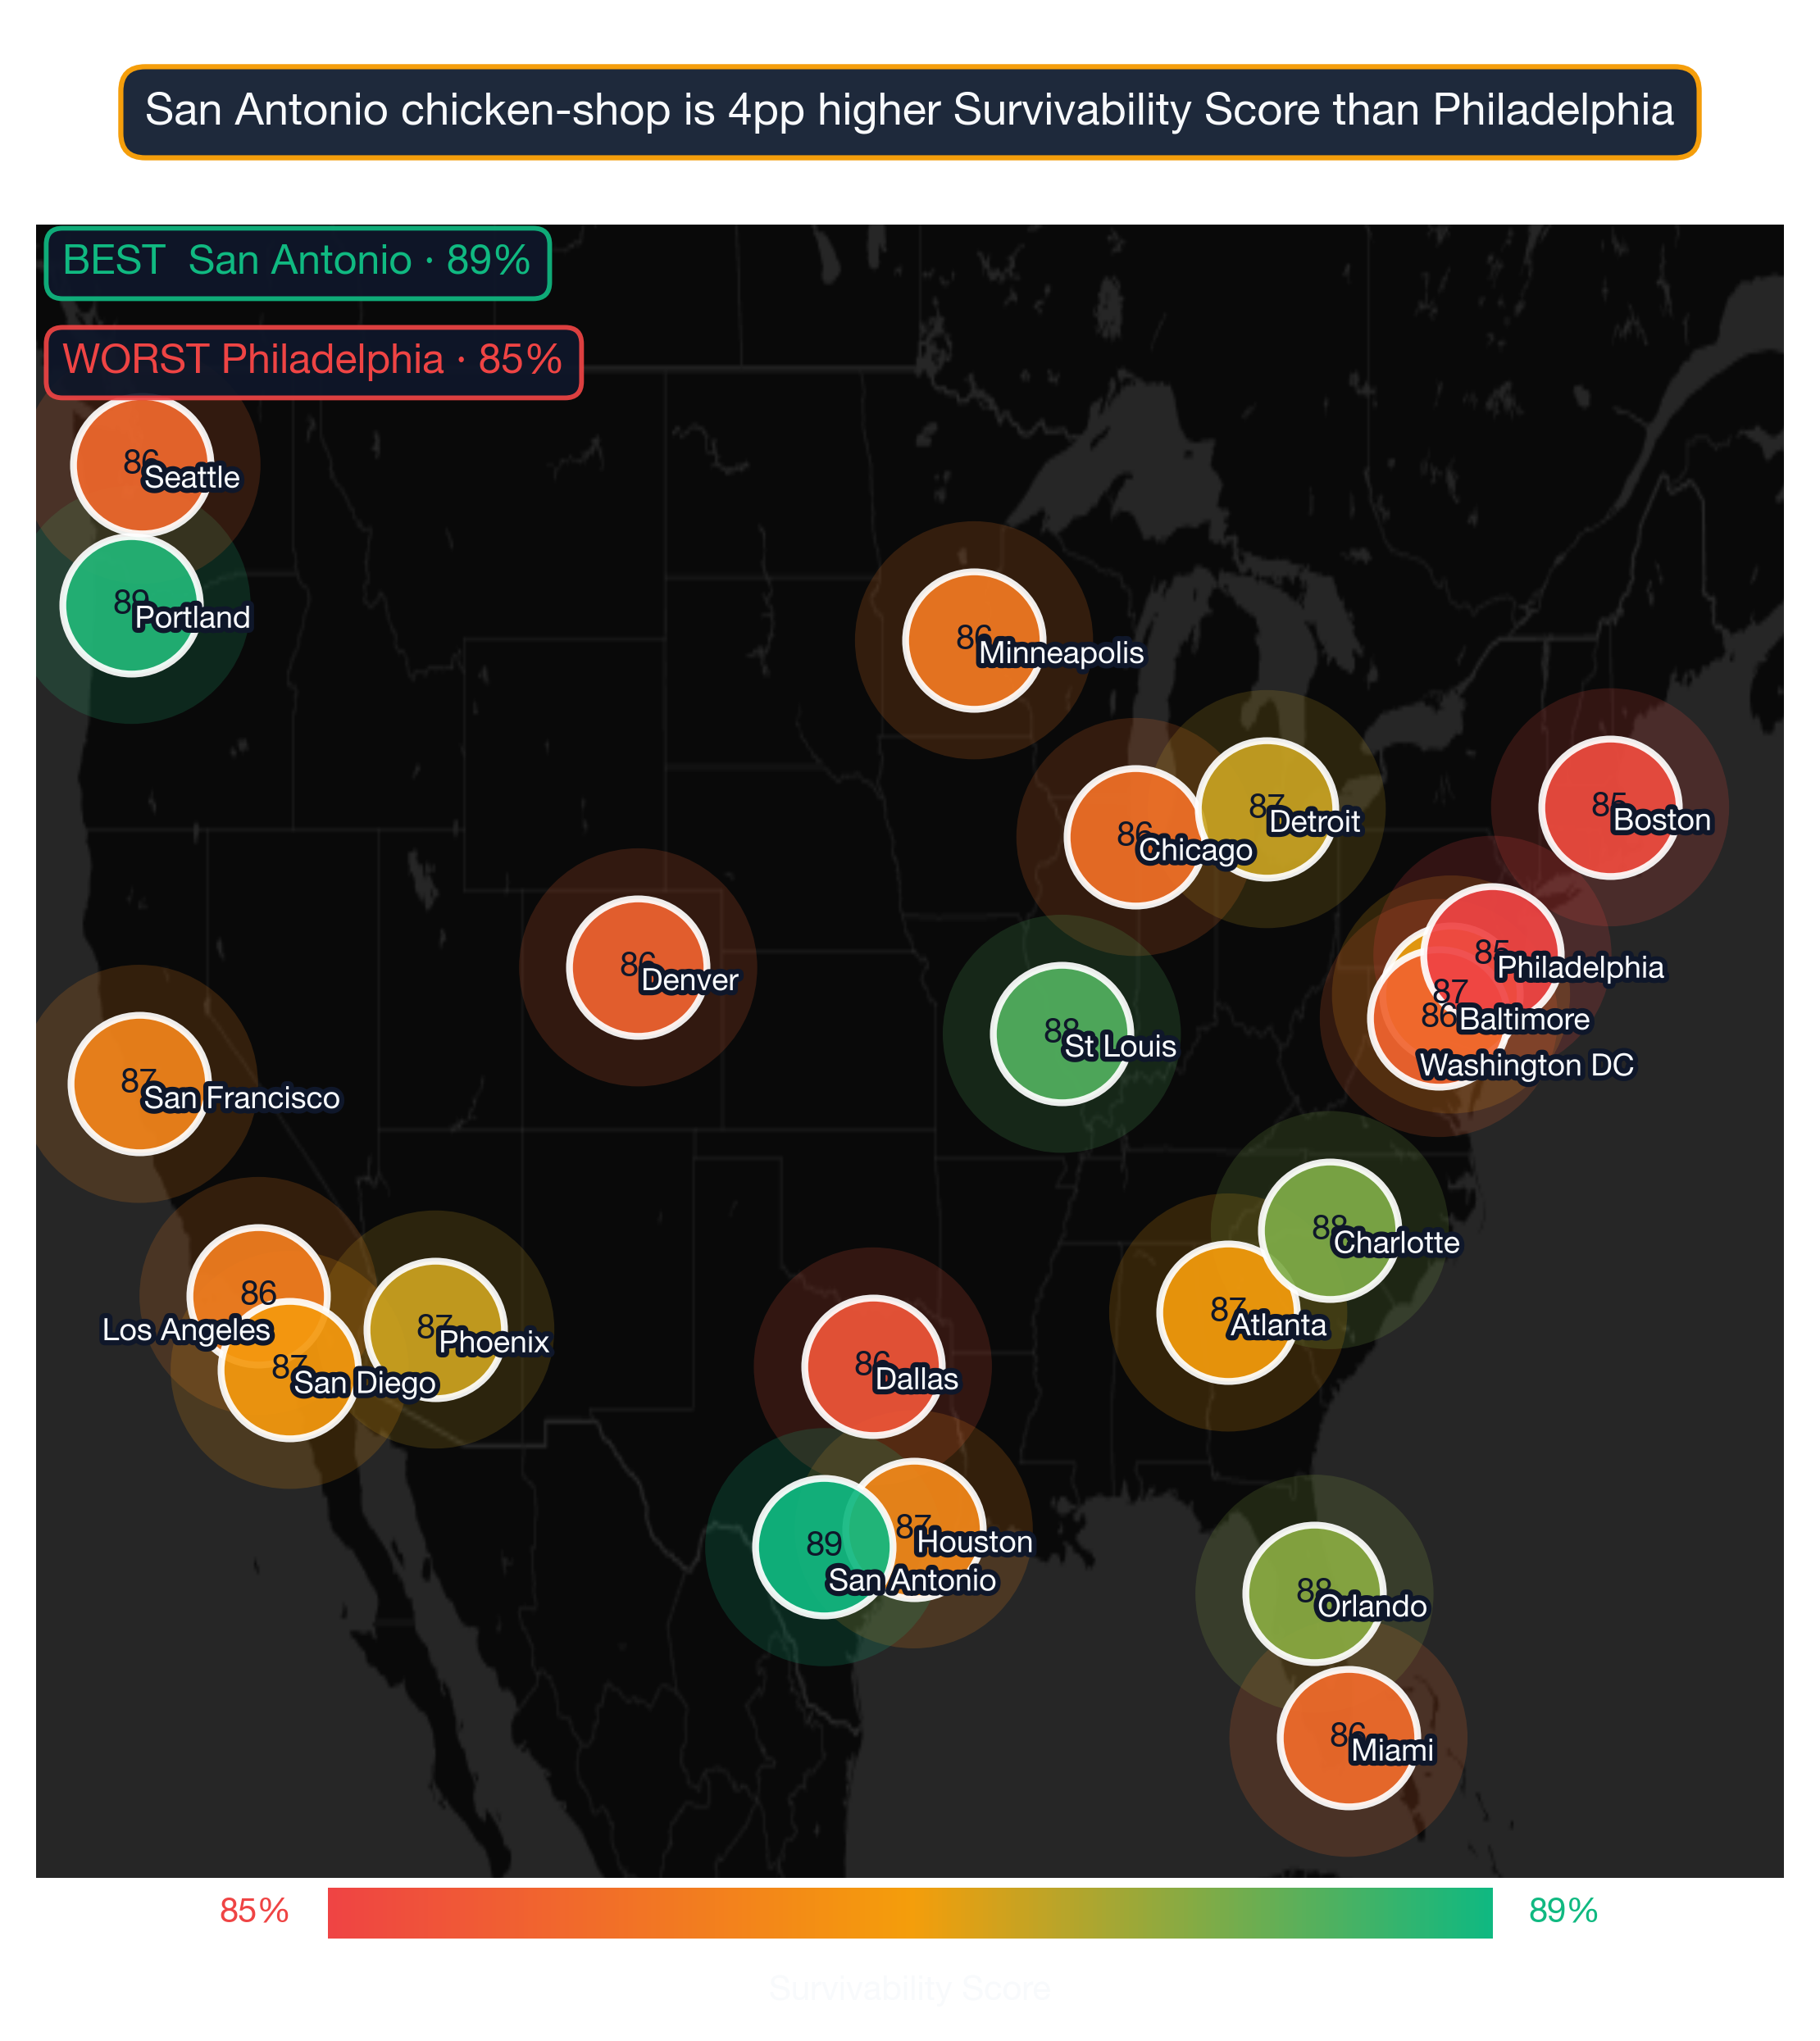
Survivability range for top, middle, and last-ranked neighborhoods. Box = best-to-challenging range; white line = average. Tysons, Washington DC leads at 97% in 2026. Full methodology →
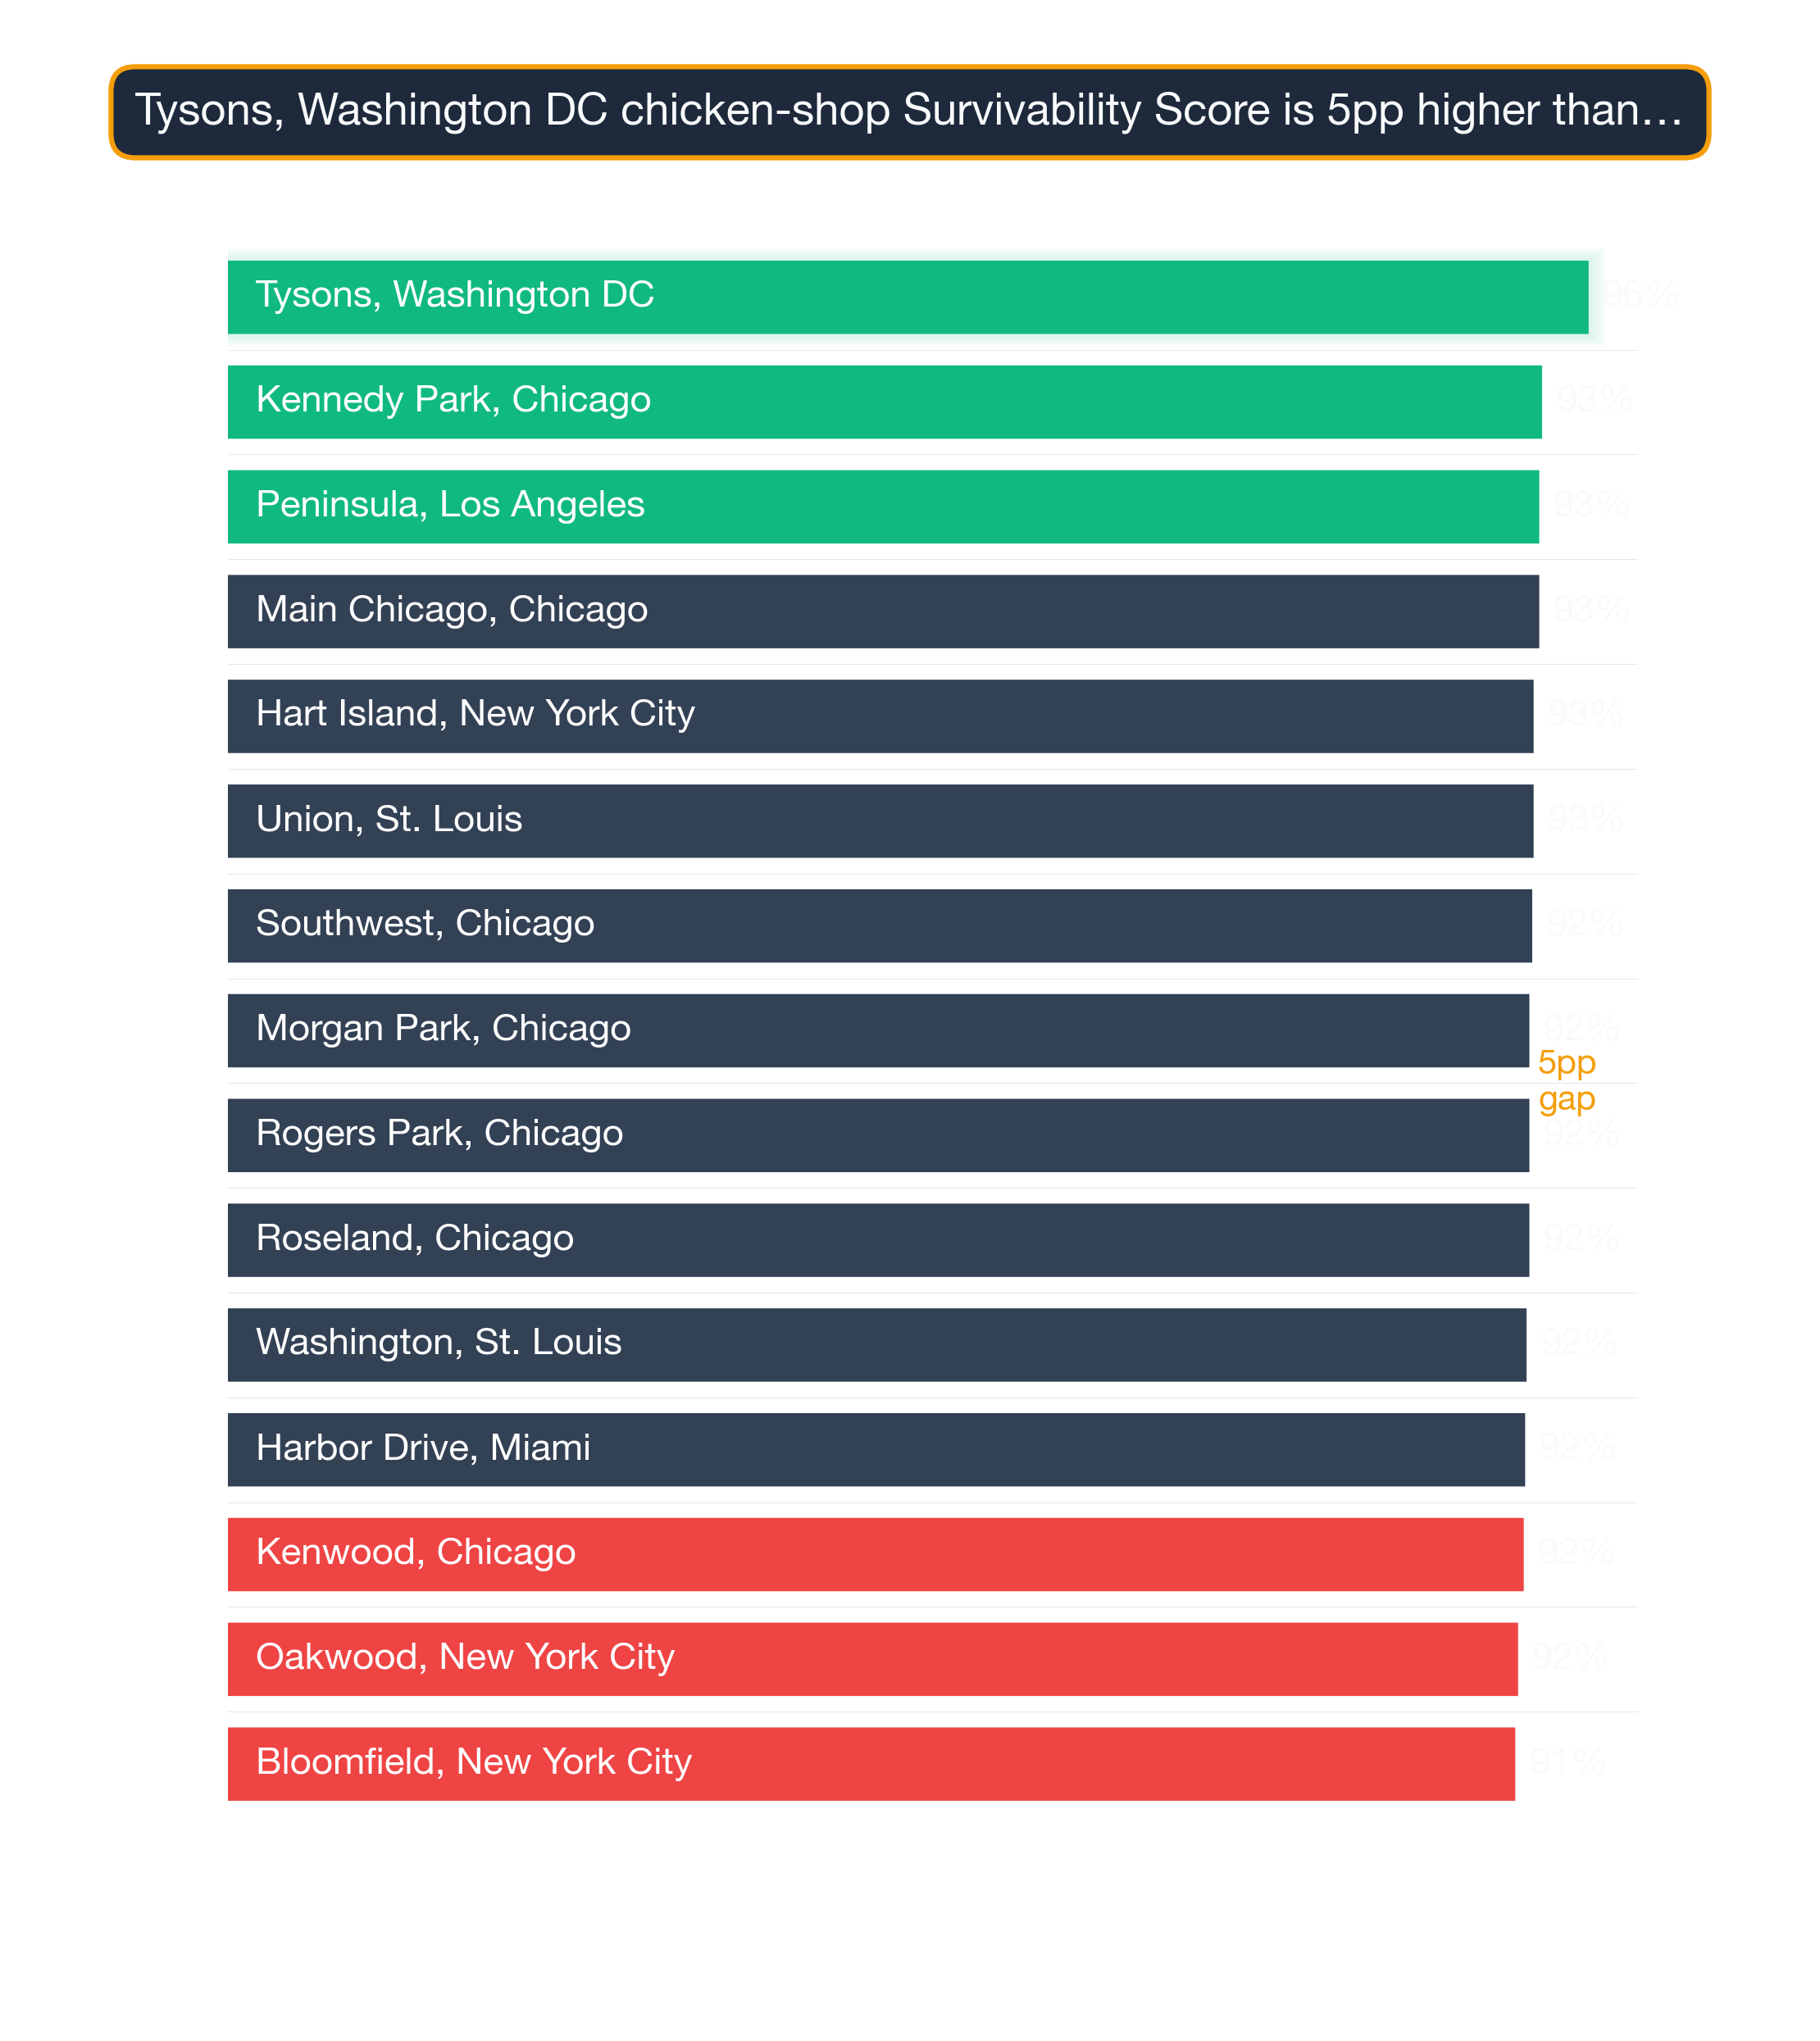
The top 25 neighborhoods nationwide for Chicken Shops are:
| # | Neighborhood | City | Avg Survival | Tier | Best Locations | Challenging Locations |
|---|---|---|---|---|---|---|
| 1 | Tysons | Washington DC | 96.5% | Great | 97.0% | 95.1% |
| 2 | Kennedy Park | Chicago | 93.2% | Great | 95.2% | 91.7% |
| 3 | Main-Chicago | Chicago | 93.0% | Great | 95.0% | 91.5% |
| 4 | Peninsula | Los Angeles | 93.0% | Great | 95.0% | 91.5% |
| 5 | Union | St. Louis | 92.6% | Great | 94.6% | 91.1% |
| 6 | Southwest | Chicago | 92.5% | Great | 94.6% | 91.1% |
| 7 | Morgan Park | Chicago | 92.3% | Great | 94.4% | 90.9% |
| 8 | Rogers Park | Chicago | 92.3% | Great | 94.4% | 90.8% |
| 9 | Roseland | Chicago | 92.3% | Great | 94.3% | 90.8% |
| 10 | Washington | St. Louis | 92.1% | Great | 94.2% | 90.6% |
| 11 | Harbor Drive | Miami | 92.0% | Great | 94.1% | 90.5% |
| 12 | Kenwood | Chicago | 91.9% | Great | 93.9% | 90.4% |
| 13 | West Village | Chicago | 91.3% | Great | 93.3% | 89.8% |
| 14 | Troy | St. Louis | 91.2% | Great | 93.3% | 89.8% |
| 15 | River North | Chicago | 91.1% | Great | 93.2% | 89.6% |
| 16 | Chestnut Hill | Philadelphia | 90.8% | Great | 92.9% | 89.3% |
| 17 | Margate Park | Chicago | 90.8% | Great | 92.9% | 89.3% |
| 18 | West Town | Chicago | 90.8% | Great | 92.8% | 89.3% |
| 19 | Noble Square | Chicago | 90.7% | Great | 92.8% | 89.3% |
| 20 | Wildwood | Chicago | 90.6% | Great | 92.7% | 89.2% |
| 21 | Edgewater | Chicago | 90.5% | Great | 92.6% | 89.0% |
| 22 | Cabrini Green | Chicago | 90.5% | Great | 92.6% | 89.0% |
| 23 | The Villa | Chicago | 90.5% | Great | 92.5% | 89.0% |
| 24 | Mayfair | Chicago | 90.4% | Great | 92.5% | 89.0% |
| 25 | Andersonville | Chicago | 90.4% | Great | 92.5% | 88.9% |
However, individual locations vary widely, and even in lower-scoring neighborhoods there are pockets that perform exceptionally well.
For a full explanation of how survivability scores and ranges are calculated, see Survivability Score: How We Calculate It & Why It Matters.
What's true of every top-ranked US neighborhood
City Concentration
The top 25 neighborhoods span 6 different cities, with Chicago claiming 18 of the top spots (72%).
Breakdown of top 25 neighborhoods by city:
- Chicago: 18 neighborhoods (72% of top 25) — View city guide
- St. Louis: 3 neighborhoods (12% of top 25) — View city guide
- Washington DC: 1 neighborhood (4% of top 25) — View city guide
- Los Angeles: 1 neighborhood (4% of top 25) — View city guide
- Miami: 1 neighborhood (4% of top 25) — View city guide
- Philadelphia: 1 neighborhood (4% of top 25) — View city guide
This distribution has practical implications for Chicken Shops operators: cities with multiple neighborhoods in the top 25 offer more site options within a single market, reducing relocation or expansion cost. Cities with a single top-25 neighborhood require more precise site selection — the advantage is concentrated in one area rather than spread across the metro.
The income-and-density pattern
The concentration of 18 top-ranked neighborhoods in Chicago (72% of the top 25) is notably high for this business category, suggesting that Chicago's market conditions — competitive density, consumer spending patterns, and demographic alignment — are unusually favorable for Chicken Shops. Operators targeting this category should treat Chicago neighborhoods as a primary focus before expanding to secondary markets.
How to apply this ranking when choosing where to open a Chicken Shop
National rankings are a powerful starting point, but your final site decision should be validated at the address level. Our analysis draws on one of the largest proprietary commercial real estate datasets available, spanning 24 US metros and 130+ business categories. Block-level conditions within any neighborhood can shift survivability by 10–20 points — this ranking narrows your search, and StreetSpring's live tool finalizes it.
For the most accurate assessment:
- Consider neighborhoods in the top 25 as strong starting points
- Examine city-specific guides for additional neighborhood options in your target markets
- Use StreetSpring's address-level tool to evaluate specific storefronts within these neighborhoods
- Factor in your budget, operational requirements, and target demographics
Each neighborhood has detailed analysis available through its city guide, providing block-by-block survivability data for Chicken Shops.
Filtering the list to your actual constraints
See also: Best Cities for Chicken Shop — our city-level comparison ranks which metros offer the strongest overall conditions for Chicken Shops.
Cross-Category Patterns Across the Ranking
If you're evaluating a Chicken Shop location, the same neighborhoods that score well for Chicken Shops often score well for adjacent businesses. A few examples across the national distribution:
Tysons, Washington DC — ranked #1 nationally — the strongest neighborhood for Chicken Shops (96% survivability for Chicken Shop) Other business types that thrive in Tysons:
- Georgian Restaurant (96% survivability)
- Veterinary Clinic (96% survivability)
- Portuguese Restaurant (96% survivability)
Pecan-Park, Houston — ranked #714 of 1426 — a mid-ranked national neighborhood (80% survivability for Chicken Shop) Other business types that thrive in Pecan-Park:
- Kosher Restaurant (83% survivability)
- Ukrainian Restaurant (83% survivability)
- Italian Restaurant (82% survivability)
Baychester, New York City — ranked #1426 of 1426 — among the lower-ranked national neighborhoods (69% survivability for Chicken Shop) Other business types that thrive in Baychester:
- Brunch Restaurant (82% survivability)
- Pet Boarding Facility (81% survivability)
- Japanese / Sushi Restaurant (81% survivability)
Cross-subtype synergy is a real signal. A neighborhood that scores high for Chicken Shops is usually a sound bet for several other business types — useful for landlords and multi-concept owners.
Visual Data
Related Resources
Explore top cities represented in these neighborhoods:
- St. Louis: Best businesses and neighborhoods
- Philadelphia: Best businesses and neighborhoods
- Chicago: Best businesses and neighborhoods
- Miami: Best businesses and neighborhoods
- Washington DC: Best businesses and neighborhoods
National city rankings: Best cities for Chicken Shops
Essential resources:
- How StreetSpring calculates Survivability Scores
- Site selection for landlords
- AI tools for tenant representatives
- StreetSpring vs competitors
Frequently Asked Questions
What is the typical survivability range for Chicken Shops in top neighborhoods?
The top 25 neighborhoods nationwide for Chicken Shops average 91.7% survivability. The national average across all analyzed neighborhoods is 80.3%. The spread between top neighborhoods and the national average is 11.5% — representing the tangible survivability advantage of choosing a top-ranked location.
Where can I download the underlying data?
The full national survivability dataset is available as a free download: https://streetspring.com/resources/data/national-survivability-scores-2026.csv. The CSV includes all business subtypes and neighborhoods covered in this analysis, licensed under CC BY 4.0.
Is the competitive environment for Chicken Shops stronger in some markets than others?
Yes — competition density for Chicken Shops varies significantly by market. In the top-ranked neighborhoods, StreetSpring's model identifies favorable competitive dynamics as a primary driver of high survivability scores. In more saturated markets, even strong consumer spending may not overcome competitive pressure. StreetSpring's address-level tool shows the exact competitive environment at any specific location.
How often do neighborhood rankings change?
StreetSpring updates rankings quarterly as new data on business openings, closures, and market conditions becomes available. The current analysis reflects 2026 data. Because competitive conditions shift as new businesses enter or exit a neighborhood, the specific rankings for any given business type can shift between updates — which is why we recommend verifying specific addresses in StreetSpring's live tool before making a final site selection decision.
How do I interpret a survivability score?
A survivability score represents the estimated probability that a business of a specific type will still be operating at a given location after 2 years. A score of 80% means StreetSpring's model predicts an 80% chance of the business surviving past the 2-year mark at that address. Scores are calculated at the address level and reflect competitive density, consumer spending patterns, mobility data, and 80+ additional factors.
How does StreetSpring calculate survivability for Chicken Shops specifically?
StreetSpring's model calculates survivability for Chicken Shops by analyzing the competitive density of existing Chicken Shops within each distance band around the address, the projected consumer spending on Chicken Shops in that location, mobility patterns that determine likely customer flow, and 80+ additional factors. The resulting survivability score reflects the estimated probability of a new Chicken Shop surviving 2+ years at that specific address.
Can a Chicken Shop succeed in neighborhoods outside the top 25?
Yes — the top 25 neighborhoods represent standout conditions, but Chicken Shops can achieve strong survivability in many other neighborhoods as well. What matters is finding a location where competitive density is low enough and consumer spending is strong enough to support the business. StreetSpring's address-level tool identifies high-survivability addresses in any neighborhood, including those not represented in this top-25 list.
How should a landlord use this ranking when evaluating tenants for Chicken Shops?
Landlords can use this national neighborhood ranking to assess whether their property is in a location favorable to Chicken Shops — and by extension, how likely a Chicken Shop tenant is to maintain long-term occupancy. If your property is in one of the top 25 neighborhoods, Chicken Shops represent a strong tenant category. If not, StreetSpring's address-level tool will show the survivability score for your specific address and which tenant types score highest there.
Technical note: Aggregated national survivability rankings across all 24 metros are available in machine-readable format for research and integration purposes.
StreetSpring recalculates survivability using the latest competitive, demographic, and walkability data, so the live score may differ from the static ranges shown here.
Methodology: Neighborhood rankings are based on average Survivability Scores for Chicken Shops across all analyzed locations within each neighborhood. Rankings represent neighborhood-level conditions but do not account for block-by-block variation. Coverage includes 1426 neighborhoods across 24 major US cities.