National Neighborhood Survivability Rankings for Asian Fusion Restaurant
StreetSpring's 2026 nationwide analysis ranks the top neighborhoods across all major US cities for Asian Fusion Restaurants. See which neighborhoods offer the highest Survivability Scores.
Of all neighborhoods across the US analyzed in 2026, Tysons in Washington DC offers the highest survivability for Asian Fusion Restaurant operators at 97%. The top 25 neighborhoods nationwide span 6 different cities, demonstrating that exceptional opportunities for Asian Fusion Restaurants exist across diverse markets. Neighborhood rankings are useful, but the exact odds for your location can only be seen by running a current survivability check in StreetSpring.
To understand the methodology behind these rankings, see our detailed guide: Survivability Score: How We Calculate It & Why It Matters.
Reviewed: April 29, 2026 by Bobby Koons, StreetSpring founder
Quick Summary
- #1 Neighborhood: Tysons, Washington DC — 97% survivability for Asian Fusion Restaurant
- Neighborhoods analyzed: 1426 across 24 major US cities
- National average survivability: 80.3% for Asian Fusion Restaurants
- Top-25 average: 91.6% — 11.3% above national average
- Data current as of: 2026 · Full methodology →
Table of Contents
- How neighborhoods compare nationwide
- Top 25 neighborhoods in the US
- Geographic patterns
- How to use this ranking
- Related resources
- Frequently asked questions
How do US neighborhoods stack up for Asian Fusion Restaurants?
Analyzing 1426 neighborhoods across 24 major US cities, StreetSpring's 2026 data shows that the best neighborhoods for Asian Fusion Restaurants significantly outperform average locations, with the top 25 neighborhoods nationwide averaging 91.6% survivability compared to the national neighborhood average of 80.3%.
This 11.3% advantage illustrates how critical neighborhood selection is — choosing a top-tier neighborhood versus an average one can significantly increase your long-term survival chances.
What separates the top neighborhoods for Asian Fusion Restaurants from the national average is not simply higher foot traffic — it is a favorable ratio of consumer spending on this category to competitive supply. The 11.3% advantage that top neighborhoods hold is built on structural conditions: the right consumer demographics, manageable competition density, and mobility patterns that route target customers past the storefront. Our models are built using machine learning trained on millions of commercial real estate data points.
Importantly, top-performing neighborhoods aren't concentrated in just a few cities. The top 25 neighborhoods represent 6 different cities. This means entrepreneurs focused on Asian Fusion Restaurants can find exceptional opportunities across the United States, not just in traditionally strong markets.
The address you choose determines your competitive exposure, customer flow, and spending potential simultaneously.
Which US neighborhoods are best for opening an Asian Fusion Restaurant?
| Comparison factor | Where high-survivability neighborhoods excel | Where lower-survivability neighborhoods fall short |
|---|---|---|
| Commercial rent-to-revenue ratio | Neighborhoods where commercial $/sqft fits the subtype's revenue-per-sqft economics with margin. | Neighborhoods where rent inflation has outrun revenue growth — operators paying lifestyle rents. |
| Complementary subtype clustering | Neighborhoods with multiple complementary subtypes within 2 blocks (e.g., fitness + smoothie + athletic apparel). | Neighborhoods where the subtype is isolated from complementary anchors, requiring all foot-traffic to be destination-driven. |
| Daytime population concentration | Mixed-use neighborhoods with strong daytime employment density (LEHD LODES > 8K jobs/sq mi). | Pure-residential neighborhoods where daytime population drops below 30% of resident count. |
The shared traits across the top 10
Survivability range for top, middle, and last-ranked neighborhoods. Box = best-to-challenging range; white line = average. Tysons, Washington DC leads at 97% in 2026. Full methodology →
The top 25 neighborhoods nationwide for Asian Fusion Restaurants are:
| # | Neighborhood | City | Avg Survival | Tier | Best Locations | Challenging Locations |
|---|---|---|---|---|---|---|
| 1 | Tysons | Washington DC | 96.5% | Great | 97.0% | 94.8% |
| 2 | Kennedy Park | Chicago | 93.2% | Great | 95.3% | 91.4% |
| 3 | Peninsula | Los Angeles | 92.9% | Great | 95.1% | 91.2% |
| 4 | Main-Chicago | Chicago | 92.8% | Great | 95.0% | 91.1% |
| 5 | Union | St. Louis | 92.5% | Great | 94.6% | 90.7% |
| 6 | Southwest | Chicago | 92.4% | Great | 94.6% | 90.7% |
| 7 | Rogers Park | Chicago | 92.3% | Great | 94.4% | 90.5% |
| 8 | Morgan Park | Chicago | 92.2% | Great | 94.3% | 90.4% |
| 9 | Roseland | Chicago | 92.1% | Great | 94.2% | 90.4% |
| 10 | Washington | St. Louis | 92.1% | Great | 94.2% | 90.3% |
| 11 | Kenwood | Chicago | 91.9% | Great | 94.0% | 90.1% |
| 12 | Harbor Drive | Miami | 91.5% | Great | 93.6% | 89.7% |
| 13 | West Village | Chicago | 91.2% | Great | 93.3% | 89.4% |
| 14 | River North | Chicago | 91.1% | Great | 93.2% | 89.4% |
| 15 | Troy | St. Louis | 91.0% | Great | 93.1% | 89.2% |
| 16 | Chestnut Hill | Philadelphia | 90.9% | Great | 93.0% | 89.1% |
| 17 | Margate Park | Chicago | 90.8% | Great | 92.9% | 89.0% |
| 18 | West Town | Chicago | 90.7% | Great | 92.8% | 88.9% |
| 19 | Noble Square | Chicago | 90.6% | Great | 92.7% | 88.9% |
| 20 | Wildwood | Chicago | 90.5% | Great | 92.6% | 88.7% |
| 21 | Mayfair | Chicago | 90.4% | Great | 92.5% | 88.6% |
| 22 | Andersonville | Chicago | 90.3% | Great | 92.4% | 88.6% |
| 23 | The Villa | Chicago | 90.3% | Great | 92.4% | 88.5% |
| 24 | North Center | Chicago | 90.3% | Great | 92.4% | 88.5% |
| 25 | Cabrini Green | Chicago | 90.2% | Great | 92.3% | 88.5% |
Keep in mind that results depend heavily on the exact location; strong sites often exist within neighborhoods that seem less favorable overall.
For a full explanation of how survivability scores and ranges are calculated, see Survivability Score: How We Calculate It & Why It Matters.
Common signals across top-performing neighborhoods
City Concentration
The top 25 neighborhoods span 6 different cities, with Chicago claiming 18 of the top spots (72%).
Breakdown of top 25 neighborhoods by city:
- Chicago: 18 neighborhoods (72% of top 25) — View city guide
- St. Louis: 3 neighborhoods (12% of top 25) — View city guide
- Washington DC: 1 neighborhood (4% of top 25) — View city guide
- Los Angeles: 1 neighborhood (4% of top 25) — View city guide
- Miami: 1 neighborhood (4% of top 25) — View city guide
- Philadelphia: 1 neighborhood (4% of top 25) — View city guide
This distribution has practical implications for Asian Fusion Restaurants operators: cities with multiple neighborhoods in the top 25 offer more site options within a single market, reducing relocation or expansion cost. Cities with a single top-25 neighborhood require more precise site selection — the advantage is concentrated in one area rather than spread across the metro.
Why some neighborhoods score high without being downtown
The concentration of 18 top-ranked neighborhoods in Chicago (72% of the top 25) is notably high for this business category, suggesting that Chicago's market conditions — competitive density, consumer spending patterns, and demographic alignment — are unusually favorable for Asian Fusion Restaurants. Operators targeting this category should treat Chicago neighborhoods as a primary focus before expanding to secondary markets.
Using neighborhood survivability to pick Asian Fusion Restaurants sites
National rankings are a powerful starting point, but your final site decision should be validated at the address level. Our AI engine has been trained on millions of real business outcomes, giving every survivability prediction a foundation of data that no other platform can match. Block-level conditions within any neighborhood can shift survivability by 10–20 points — this ranking narrows your search, and StreetSpring's live tool finalizes it.
For the most accurate assessment:
- Consider neighborhoods in the top 25 as strong starting points
- Examine city-specific guides for additional neighborhood options in your target markets
- Use StreetSpring's address-level tool to evaluate specific storefronts within these neighborhoods
- Factor in your budget, operational requirements, and target demographics
Each neighborhood has detailed analysis available through its city guide, providing block-by-block survivability data for Asian Fusion Restaurants.
From national rank to your shortlist
See also: Best Cities for Asian Fusion Restaurant — our city-level comparison ranks which metros offer the strongest overall conditions for Asian Fusion Restaurants.
Complementary Business Types Across Tiers
Asian Fusion Restaurant success and broader neighborhood quality often correlate. Below are top, middle, and bottom-ranked neighborhoods for Asian Fusion Restaurants along with what else thrives in each:
Beltrami, Minneapolis — ranked #714 of 1426 — a mid-ranked national neighborhood (80% survivability for Asian Fusion Restaurant) Other business types that thrive in Beltrami:
- Filipino Restaurant (85% survivability)
- American Restaurant (82% survivability)
- Dance Club (82% survivability)
When several subtypes score well in the same neighborhood, that's a stronger signal than any single subtype's score in isolation. Use both views.
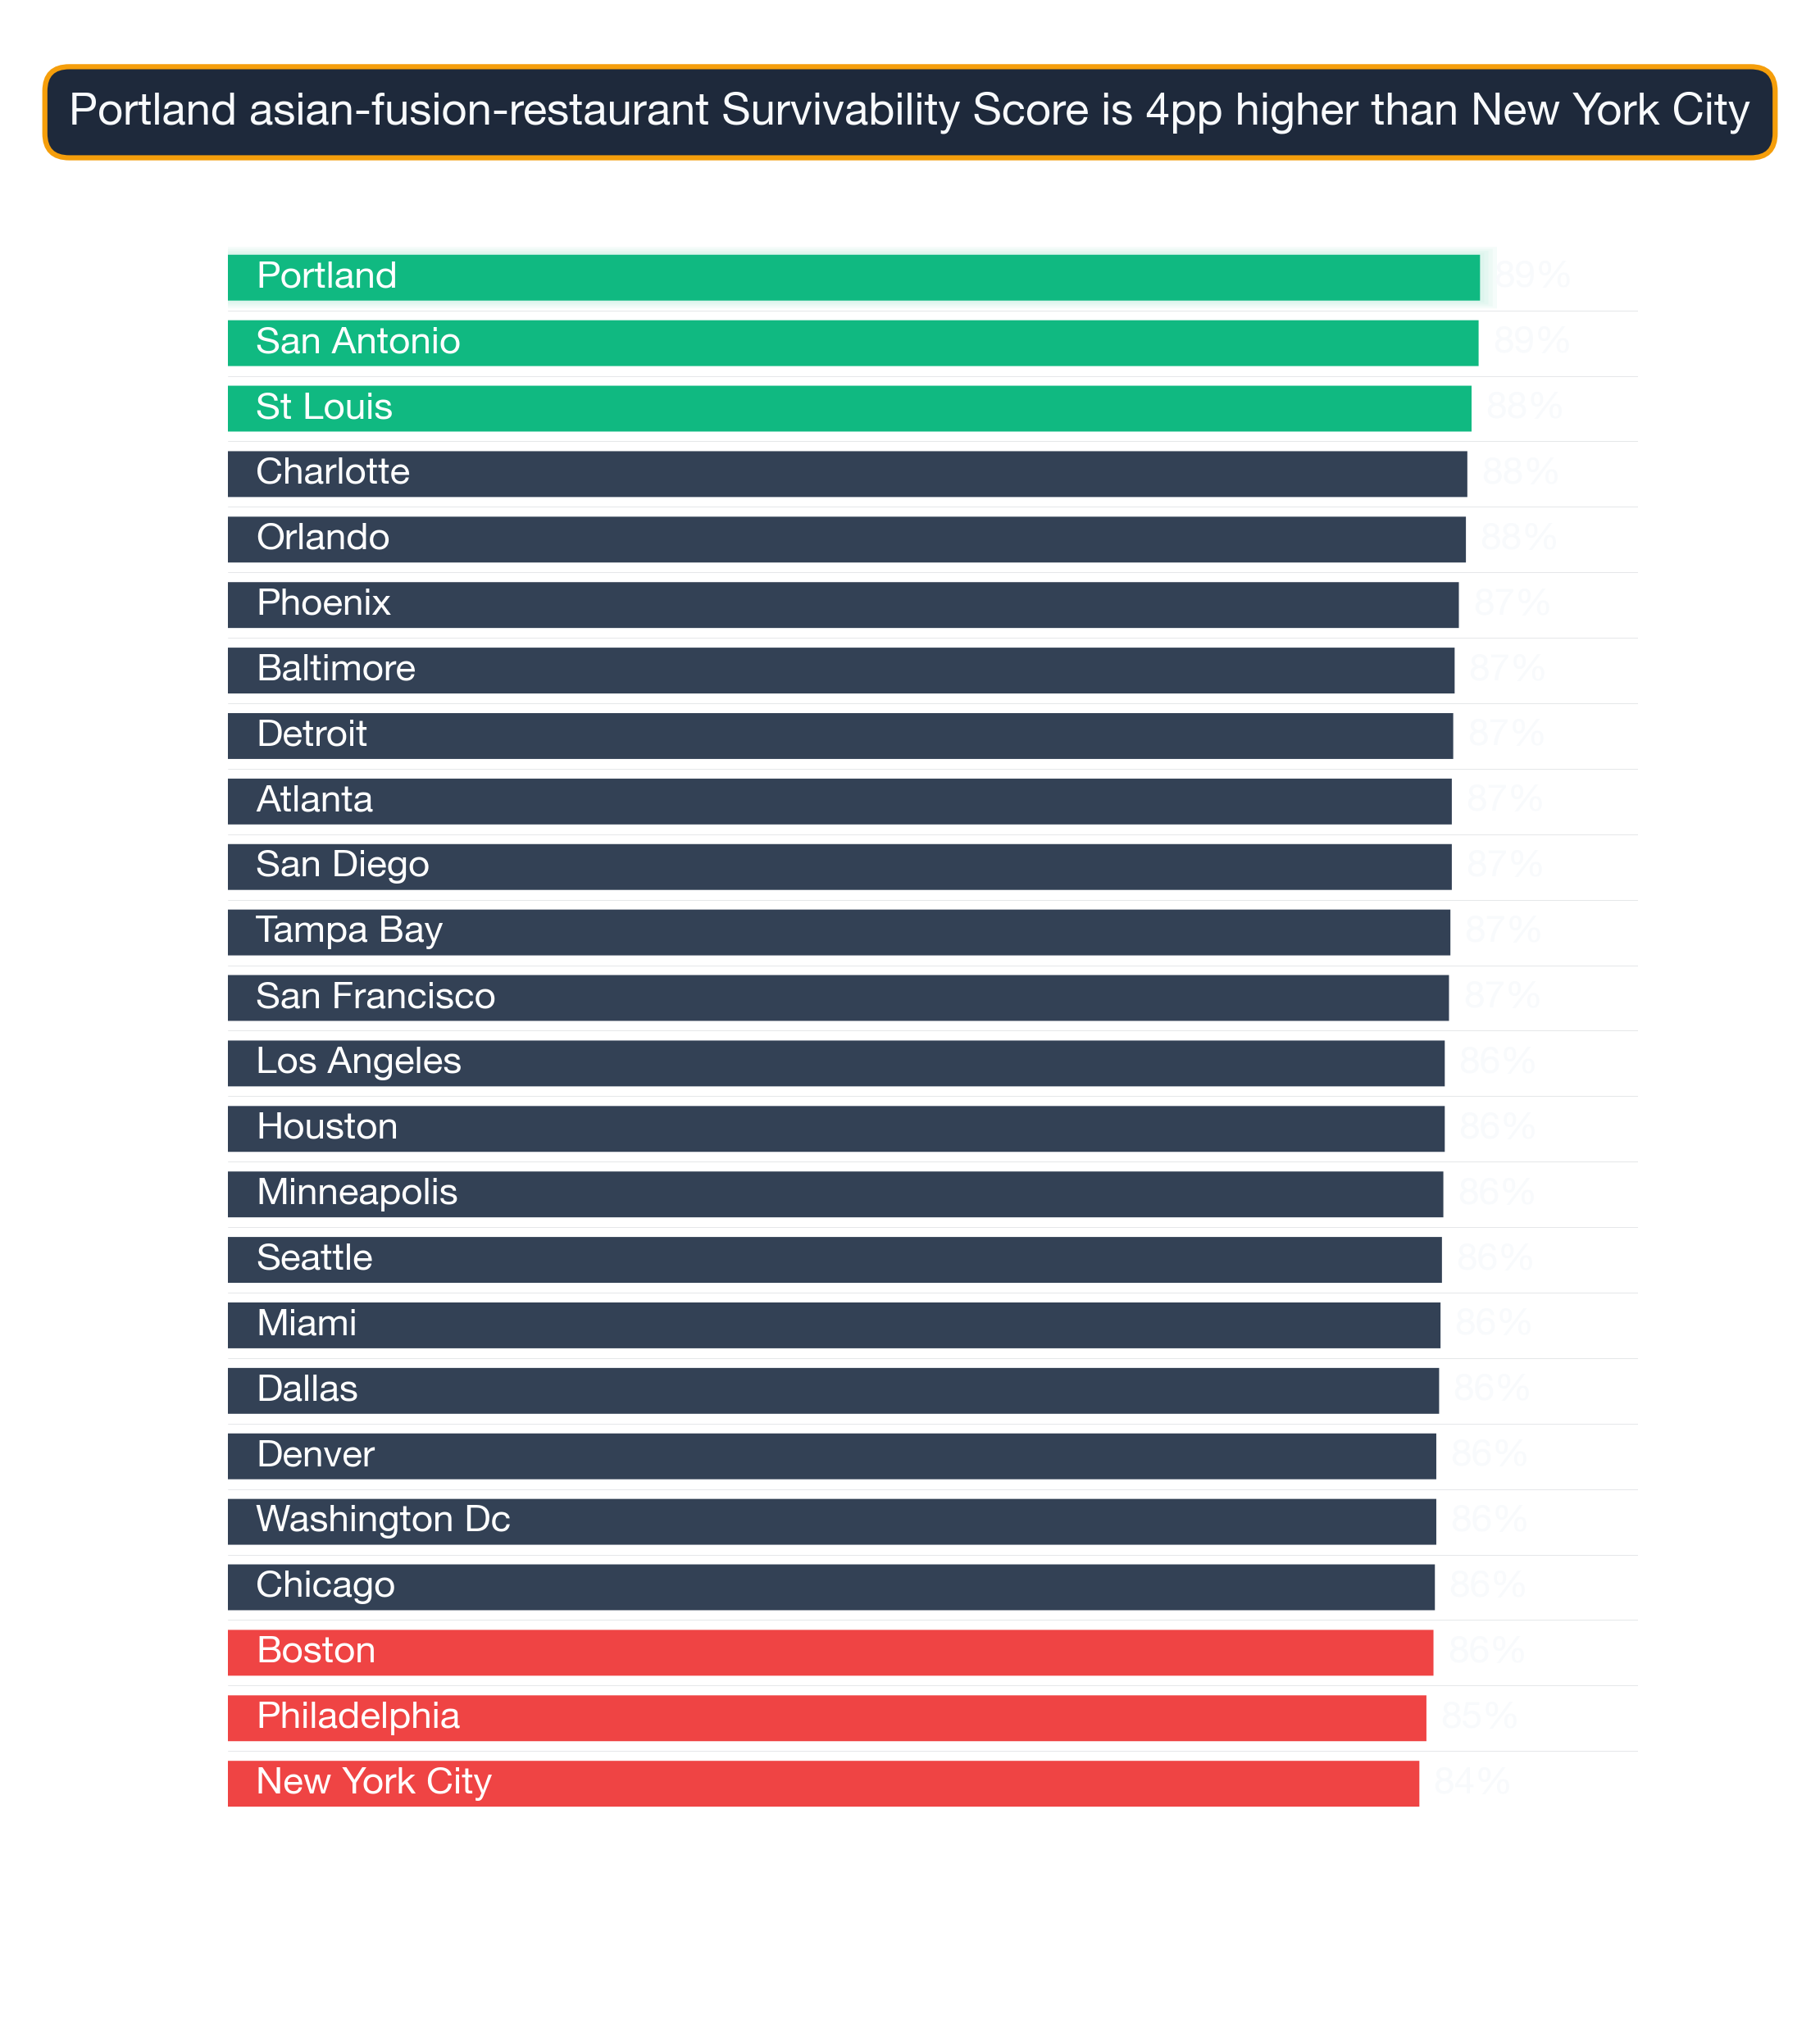
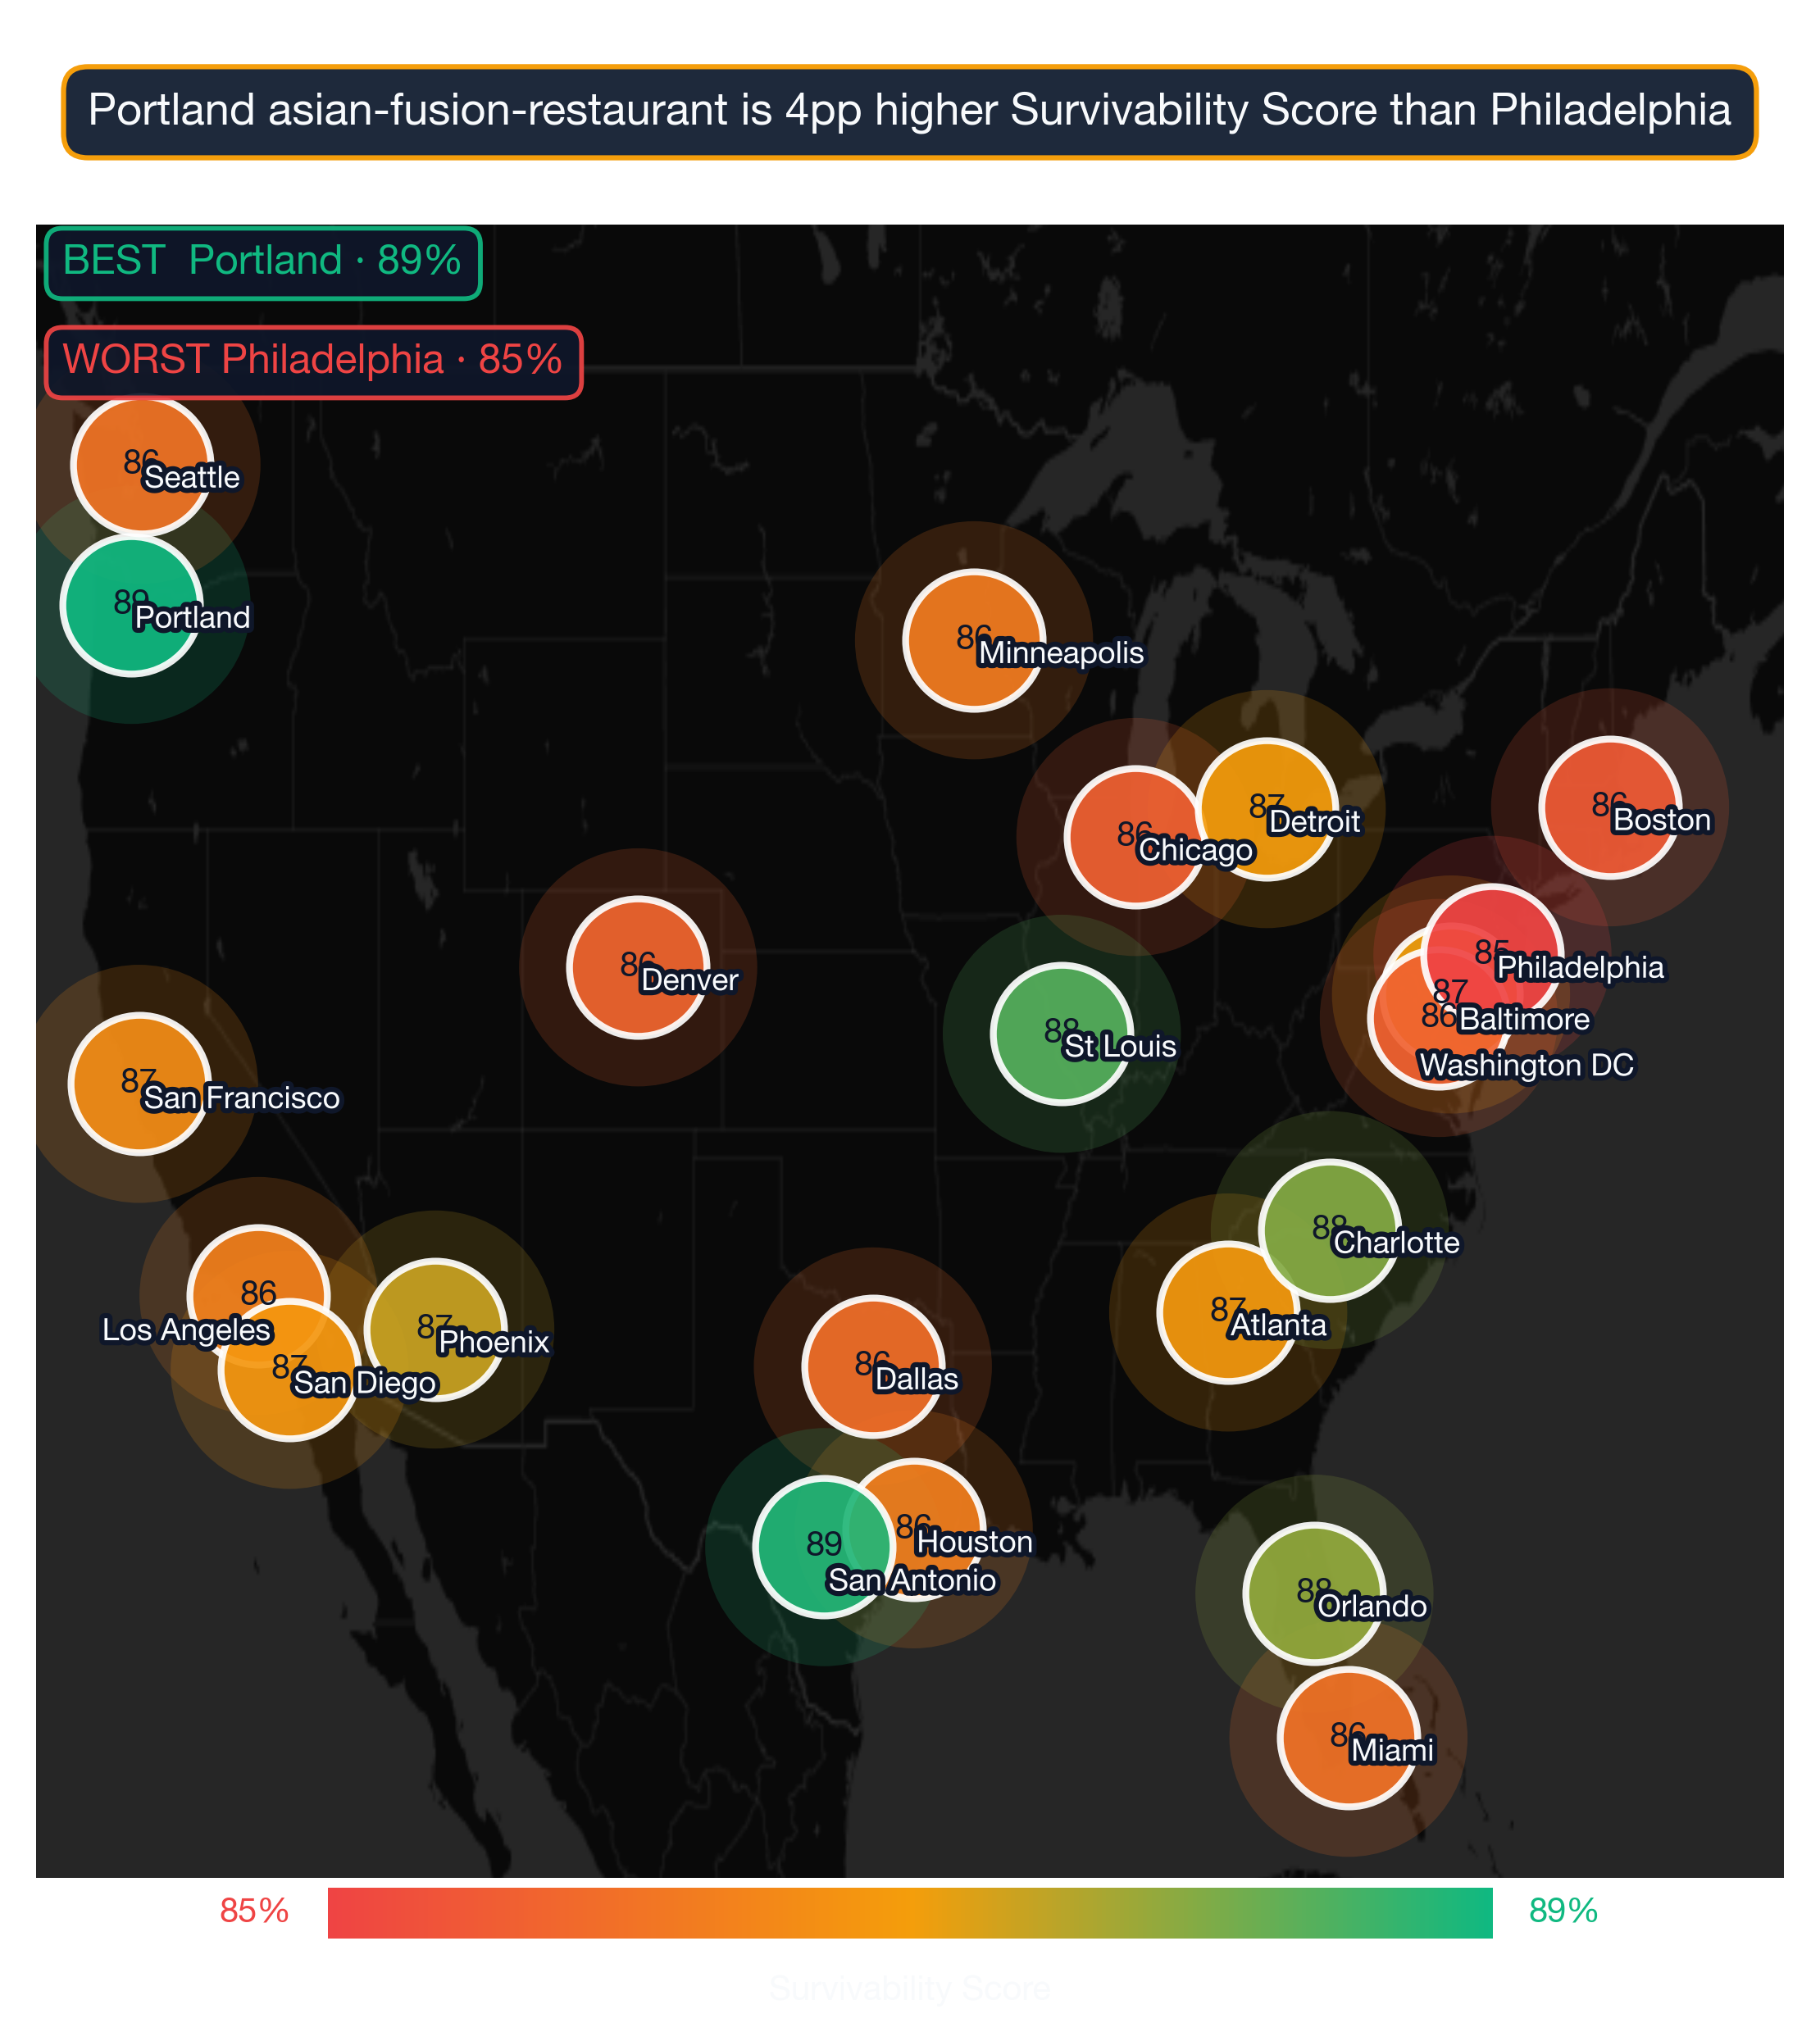
Visual Data
Related Resources
Explore top cities represented in these neighborhoods:
- St. Louis: Best businesses and neighborhoods
- Philadelphia: Best businesses and neighborhoods
- Chicago: Best businesses and neighborhoods
- Miami: Best businesses and neighborhoods
- Washington DC: Best businesses and neighborhoods
National city rankings: Best cities for Asian Fusion Restaurants
Essential resources:
- How StreetSpring calculates Survivability Scores
- Site selection for landlords
- AI tools for tenant representatives
- StreetSpring vs competitors
Frequently Asked Questions
Can an Asian Fusion Restaurant succeed in neighborhoods outside the top 25?
Yes — the top 25 neighborhoods represent standout conditions, but Asian Fusion Restaurants can achieve strong survivability in many other neighborhoods as well. What matters is finding a location where competitive density is low enough and consumer spending is strong enough to support the business. StreetSpring's address-level tool identifies high-survivability addresses in any neighborhood, including those not represented in this top-25 list.
Are there good opportunities outside the top 25 neighborhoods?
Absolutely. Our analysis covers 1426 neighborhoods across 24 cities. Many neighborhoods outside the top 25 have excellent individual locations for Asian Fusion Restaurants. Neighborhood-level rankings reflect averages — specific addresses within any neighborhood can score well above or below the neighborhood mean. Use city-specific guides and StreetSpring's address-level tool to explore options beyond the top 25.
How often do neighborhood rankings change?
StreetSpring updates rankings quarterly as new data on business openings, closures, and market conditions becomes available. The current analysis reflects 2026 data. Because competitive conditions shift as new businesses enter or exit a neighborhood, the specific rankings for any given business type can shift between updates — which is why we recommend verifying specific addresses in StreetSpring's live tool before making a final site selection decision.
Which cities appear most frequently in the top 25 neighborhoods for Asian Fusion Restaurants?
The cities most represented in the top 25 for Asian Fusion Restaurants are Chicago (18), St. Louis (3), Washington DC (1). This concentration reflects the relative strength of consumer demand and competitive conditions for Asian Fusion Restaurants in these markets. City-specific guides provide deeper analysis of each city's neighborhoods.
How can I compare specific addresses within these top neighborhoods?
StreetSpring's address-level tool allows you to input any commercial address and see predicted survivability for Asian Fusion Restaurants. Even within the top-ranked neighborhoods, survivability varies meaningfully by block — address-level scoring is the most precise way to evaluate a specific site.
How does StreetSpring calculate survivability for Asian Fusion Restaurants specifically?
StreetSpring's model calculates survivability for Asian Fusion Restaurants by analyzing the competitive density of existing Asian Fusion Restaurants within each distance band around the address, the projected consumer spending on Asian Fusion Restaurants in that location, mobility patterns that determine likely customer flow, and 80+ additional factors. The resulting survivability score reflects the estimated probability of a new Asian Fusion Restaurant surviving 2+ years at that specific address.
What demographic factors drive survivability for Asian Fusion Restaurants?
For Asian Fusion Restaurants, StreetSpring's model incorporates neighborhood-level demographic data including population density, median household income, employment rates, and consumer spending on this specific category. These factors vary by business type — the demographic profile that drives survivability for Asian Fusion Restaurant customers may differ significantly from what matters for other business categories.
What is the difference between city-level and neighborhood-level survivability rankings for Asian Fusion Restaurants?
City-level rankings reflect average survivability for Asian Fusion Restaurants across all neighborhoods in a given city — useful for identifying which cities offer the best overall conditions. Neighborhood-level rankings go deeper, showing which specific neighborhoods within those cities rank highest. StreetSpring's address-level tool adds a third layer, scoring individual storefronts within any neighborhood.
Technical note: Aggregated national survivability rankings across all 24 metros are available in machine-readable format for research and integration purposes.
StreetSpring recalculates survivability using the latest competitive, demographic, and walkability data, so the live score may differ from the static ranges shown here.
Methodology: Neighborhood rankings are based on average Survivability Scores for Asian Fusion Restaurants across all analyzed locations within each neighborhood. Rankings represent neighborhood-level conditions but do not account for block-by-block variation. Coverage includes 1426 neighborhoods across 24 major US cities.