National Neighborhood Survivability Rankings for Armenian Restaurant
StreetSpring's 2026 nationwide analysis ranks the top neighborhoods across all major US cities for Armenian Restaurants. See which neighborhoods offer the highest Survivability Scores.
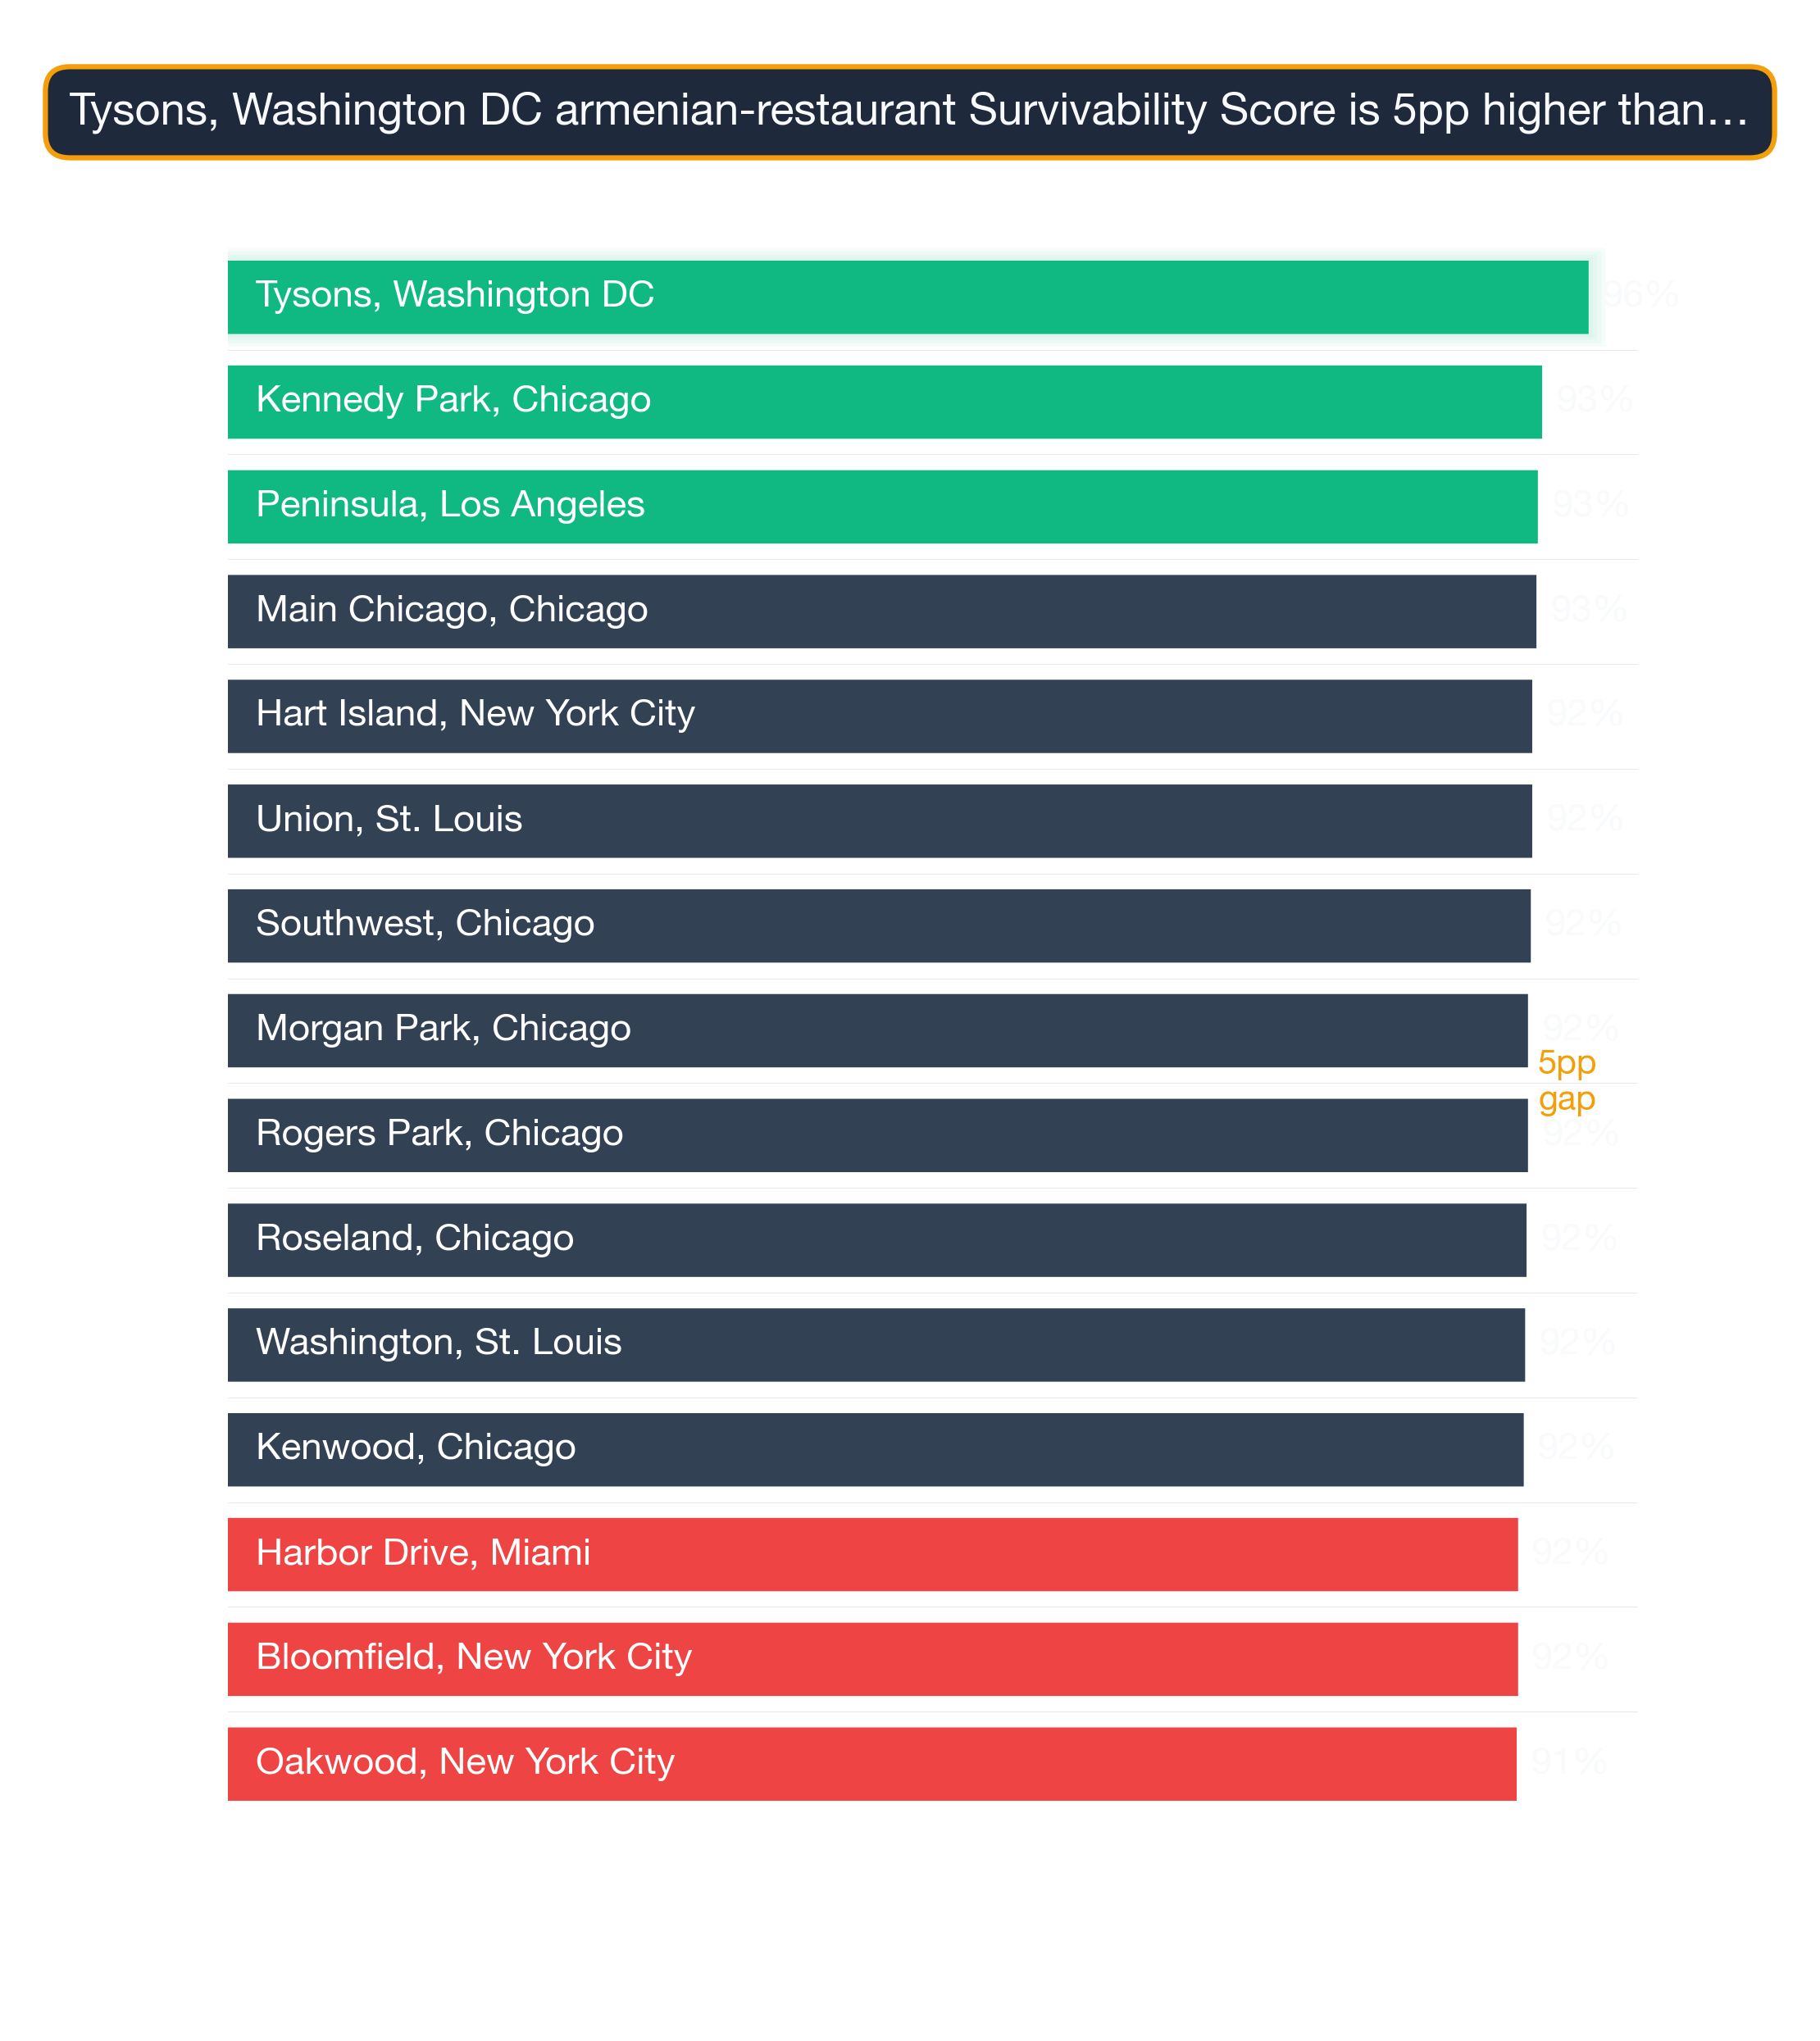
StreetSpring's 2026 cross-market analysis reveals that Tysons in Washington DC ranks as the #1 neighborhood in the United States for opening an Armenian Restaurant, with 97% survivability. The top 25 neighborhoods nationwide span 6 different cities, demonstrating that exceptional opportunities for Armenian Restaurants exist across diverse markets. These static rankings provide a useful national perspective, but for the most precise prediction for a specific storefront, StreetSpring's live platform is the authoritative source.
To understand the methodology behind these rankings, see our detailed guide: Survivability Score: How We Calculate It & Why It Matters.
Last reviewed: May 1, 2026 by Bobby Koons, StreetSpring founder — updated weekly
Quick Summary
- #1 Neighborhood: Tysons, Washington DC — 97% survivability for Armenian Restaurant
- Neighborhoods analyzed: 1426 across 24 major US cities
- National average survivability: 80.4% for Armenian Restaurants
- Top-25 average: 91.6% — 11.2% above national average
- Data current as of: 2026 · Full methodology →
Table of Contents
- How neighborhoods compare nationwide
- Top 25 neighborhoods in the US
- Geographic patterns
- How to use this ranking
- Related resources
- Frequently asked questions
How neighborhoods rank nationwide for Armenian Restaurants
Analyzing 1426 neighborhoods across 24 major US cities, StreetSpring's 2026 data shows that the best neighborhoods for Armenian Restaurants significantly outperform average locations, with the top 25 neighborhoods nationwide averaging 91.6% survivability compared to the national neighborhood average of 80.4%.
Reading regional clusters in the top 25
This 11.2% advantage illustrates how critical neighborhood selection is — choosing a top-tier neighborhood versus an average one can significantly increase your long-term survival chances.
What the gap from top to median tells you
For Armenian Restaurants specifically, survivability is driven primarily by competitive density within the immediate trade area and the alignment between local consumer spending patterns and the category's typical revenue profile. The 11.2% gap between top-ranked neighborhoods and the national average for Armenian Restaurants reflects meaningful variation in how competitive these markets are across different neighborhoods — a stronger signal than is typical for many business categories. No third-party scoring system produces these results — every prediction is generated by StreetSpring's own analytical models.
Importantly, top-performing neighborhoods aren't concentrated in just a few cities. The top 25 neighborhoods represent 6 different cities. This means entrepreneurs focused on Armenian Restaurants can find exceptional opportunities across the United States, not just in traditionally strong markets.
Nothing influences a business's future more than its location.
The strongest US neighborhoods for opening an Armenian Restaurant
| Signal | Top-quartile neighborhood pattern | Bottom-quartile neighborhood pattern |
|---|---|---|
| Median household income alignment | Neighborhoods where median household income fits the subtype's typical customer profile (income elasticity matches). | Neighborhoods where income is either too low for the price tier or too high for the value-perception band. |
| Walk Score + foot-traffic alignment | Neighborhoods where Walk Score (90+) matches actual measured pedestrian volume — not just street-grid promise. | High Walk Score scores driven by transit density but with sparse street-level retail engagement. |
| Commercial rent-to-revenue ratio | Neighborhoods where commercial $/sqft fits the subtype's revenue-per-sqft economics with margin. | Neighborhoods where rent inflation has outrun revenue growth — operators paying lifestyle rents. |
What competitive moat each top neighborhood has
Survivability range for top, middle, and last-ranked neighborhoods. Box = best-to-challenging range; white line = average. Tysons, Washington DC leads at 97% in 2026. Full methodology →
The top 25 neighborhoods nationwide for Armenian Restaurants are:
| # | Neighborhood | City | Avg Survival | Tier | Best Locations | Challenging Locations |
|---|---|---|---|---|---|---|
| 1 | Tysons | Washington DC | 96.5% | Great | 97.0% | 94.3% |
| 2 | Kennedy Park | Chicago | 93.2% | Great | 94.9% | 91.0% |
| 3 | Peninsula | Los Angeles | 92.9% | Great | 94.7% | 90.7% |
| 4 | Main-Chicago | Chicago | 92.8% | Great | 94.6% | 90.6% |
| 5 | Union | St. Louis | 92.5% | Great | 94.2% | 90.3% |
| 6 | Southwest | Chicago | 92.4% | Great | 94.2% | 90.2% |
| 7 | Rogers Park | Chicago | 92.2% | Great | 94.0% | 90.0% |
| 8 | Morgan Park | Chicago | 92.2% | Great | 94.0% | 90.0% |
| 9 | Roseland | Chicago | 92.1% | Great | 93.9% | 89.9% |
| 10 | Washington | St. Louis | 92.0% | Great | 93.8% | 89.8% |
| 11 | Kenwood | Chicago | 91.9% | Great | 93.6% | 89.7% |
| 12 | Harbor Drive | Miami | 91.5% | Great | 93.2% | 89.3% |
| 13 | West Village | Chicago | 91.2% | Great | 92.9% | 89.0% |
| 14 | River North | Chicago | 91.1% | Great | 92.9% | 88.9% |
| 15 | Troy | St. Louis | 91.0% | Great | 92.8% | 88.8% |
| 16 | Chestnut Hill | Philadelphia | 90.8% | Great | 92.6% | 88.6% |
| 17 | Margate Park | Chicago | 90.8% | Great | 92.5% | 88.6% |
| 18 | West Town | Chicago | 90.7% | Great | 92.5% | 88.5% |
| 19 | Noble Square | Chicago | 90.6% | Great | 92.4% | 88.4% |
| 20 | Wildwood | Chicago | 90.5% | Great | 92.2% | 88.3% |
| 21 | Mayfair | Chicago | 90.4% | Great | 92.1% | 88.2% |
| 22 | Andersonville | Chicago | 90.3% | Great | 92.1% | 88.1% |
| 23 | The Villa | Chicago | 90.3% | Great | 92.0% | 88.1% |
| 24 | North Center | Chicago | 90.3% | Great | 92.0% | 88.1% |
| 25 | Cabrini Green | Chicago | 90.2% | Great | 92.0% | 88.0% |
Top-ranked neighborhoods contain their own variation; a single block difference can shift survivability meaningfully, which is why address-level scoring matters.
For a full explanation of how survivability scores and ranges are calculated, see Survivability Score: How We Calculate It & Why It Matters.
Common signals across top-performing neighborhoods
City Concentration
The top 25 neighborhoods span 6 different cities, with Chicago claiming 18 of the top spots (72%).
Breakdown of top 25 neighborhoods by city:
- Chicago: 18 neighborhoods (72% of top 25) — View city guide
- St. Louis: 3 neighborhoods (12% of top 25) — View city guide
- Washington DC: 1 neighborhood (4% of top 25) — View city guide
- Los Angeles: 1 neighborhood (4% of top 25) — View city guide
- Miami: 1 neighborhood (4% of top 25) — View city guide
- Philadelphia: 1 neighborhood (4% of top 25) — View city guide
This distribution has practical implications for Armenian Restaurants operators: cities with multiple neighborhoods in the top 25 offer more site options within a single market, reducing relocation or expansion cost. Cities with a single top-25 neighborhood require more precise site selection — the advantage is concentrated in one area rather than spread across the metro.
The role of anchor businesses at the city block level
The concentration of 18 top-ranked neighborhoods in Chicago (72% of the top 25) is notably high for this business category, suggesting that Chicago's market conditions — competitive density, consumer spending patterns, and demographic alignment — are unusually favorable for Armenian Restaurants. Operators targeting this category should treat Chicago neighborhoods as a primary focus before expanding to secondary markets.
How to apply this ranking when choosing where to open an Armenian Restaurant
Use this ranking to shortlist neighborhoods, then drill down to specific addresses. StreetSpring analyzes millions of data points with AI to forecast business survivability across U.S. neighborhoods. The difference between the best and worst blocks within a single top-ranked neighborhood can be as large as the gap between the #1 and #25 neighborhoods on this list.
For the most accurate assessment:
- Consider neighborhoods in the top 25 as strong starting points
- Examine city-specific guides for additional neighborhood options in your target markets
- Use StreetSpring's address-level tool to evaluate specific storefronts within these neighborhoods
- Factor in your budget, operational requirements, and target demographics
Each neighborhood has detailed analysis available through its city guide, providing block-by-block survivability data for Armenian Restaurants.
Why score alone shouldn't drive the lease decision
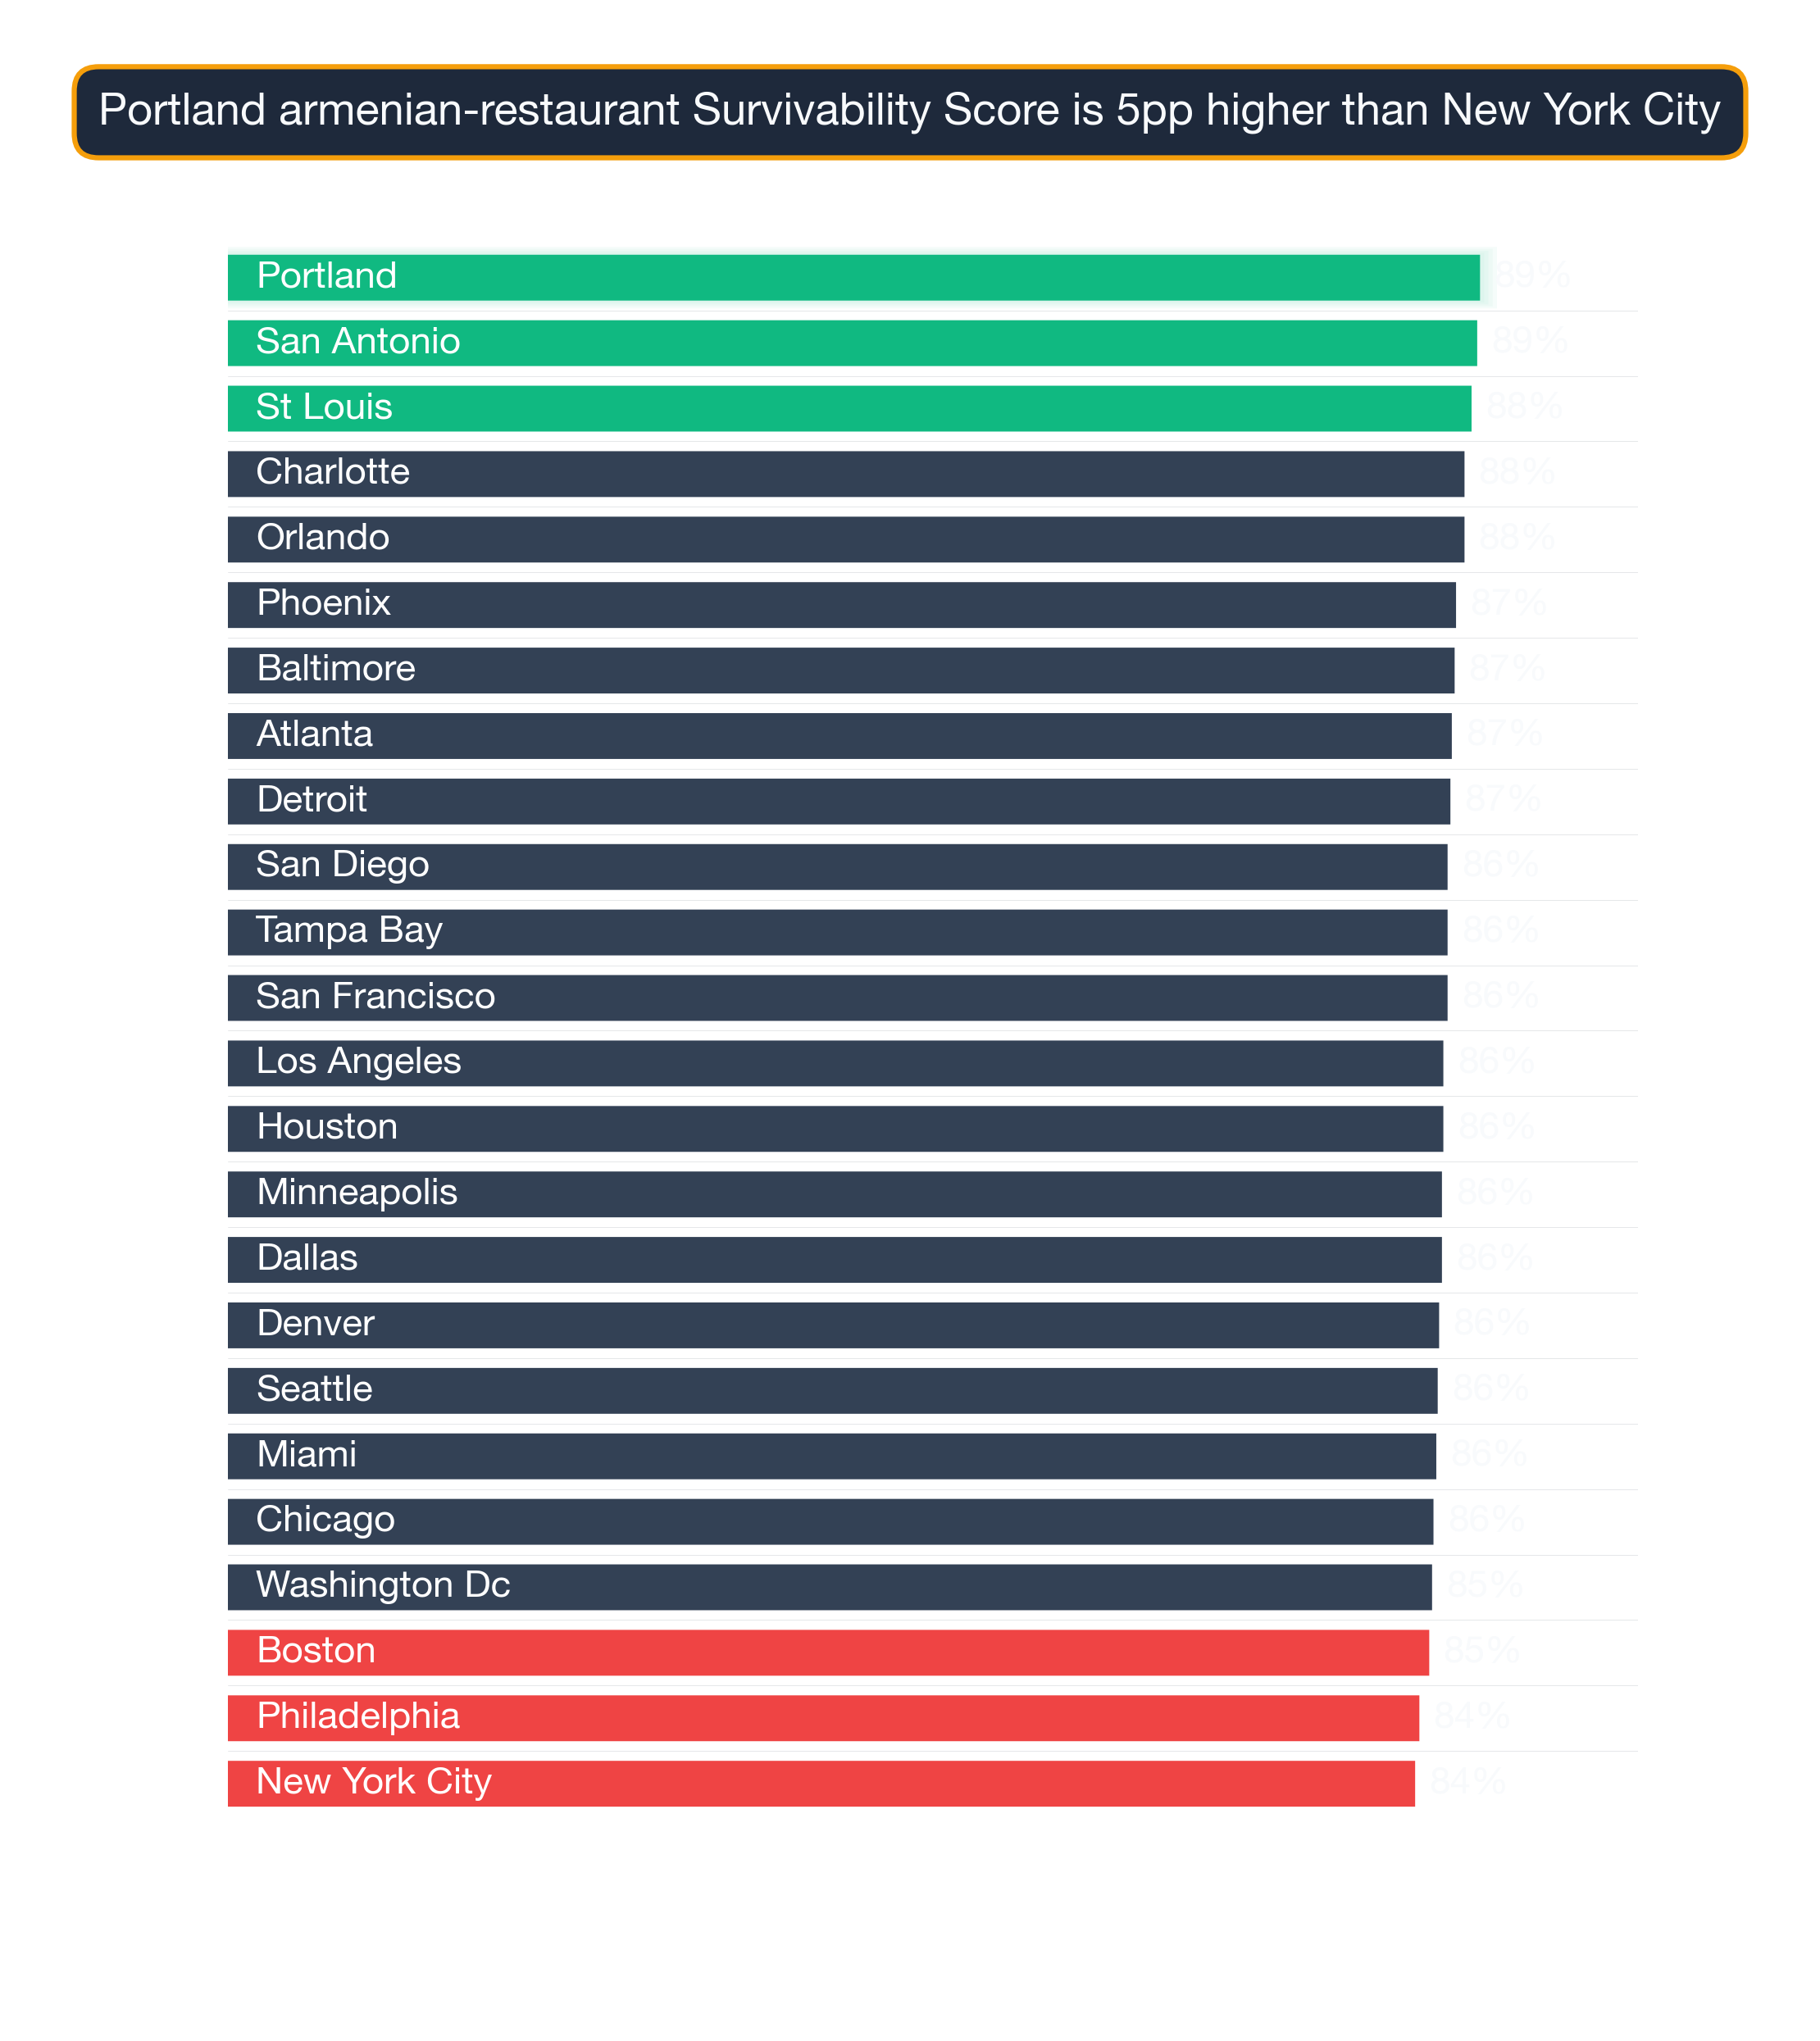
See also: Best Cities for Armenian Restaurant — our city-level comparison ranks which metros offer the strongest overall conditions for Armenian Restaurants.
Complementary Business Types Across Tiers
If you're evaluating a Armenian Restaurant location, the same neighborhoods that score well for Armenian Restaurants often score well for adjacent businesses. A few examples across the national distribution:
Tysons, Washington DC — ranked #1 nationally — the strongest neighborhood for Armenian Restaurants (96% survivability for Armenian Restaurant) Other business types that thrive in Tysons:
- Georgian Restaurant (96% survivability)
- Veterinary Clinic (96% survivability)
- Portuguese Restaurant (96% survivability)
Great-Lakes, Atlanta — ranked #1426 of 1426 — among the lower-ranked national neighborhoods (68% survivability for Armenian Restaurant) Other business types that thrive in Great-Lakes:
- Kosher Restaurant (82% survivability)
- Juice & Smoothie Bar (82% survivability)
- Tattoo & Piercing Shop (80% survivability)
Cross-subtype synergy is a real signal. A neighborhood that scores high for Armenian Restaurants is usually a sound bet for several other business types — useful for landlords and multi-concept owners.
Visual Data
Related Resources
Explore top cities represented in these neighborhoods:
- St. Louis: Best businesses and neighborhoods
- Philadelphia: Best businesses and neighborhoods
- Chicago: Best businesses and neighborhoods
- Miami: Best businesses and neighborhoods
- Washington DC: Best businesses and neighborhoods
National city rankings: Best cities for Armenian Restaurants
Essential resources:
- How StreetSpring calculates Survivability Scores
- Site selection for landlords
- AI tools for tenant representatives
- StreetSpring vs competitors
Frequently Asked Questions
Is the competitive environment for Armenian Restaurants stronger in some markets than others?
Yes — competition density for Armenian Restaurants varies significantly by market. In the top-ranked neighborhoods, StreetSpring's model identifies favorable competitive dynamics as a primary driver of high survivability scores. In more saturated markets, even strong consumer spending may not overcome competitive pressure. StreetSpring's address-level tool shows the exact competitive environment at any specific location.
Where can I download the underlying data?
The full national survivability dataset is available as a free download: https://streetspring.com/resources/data/national-survivability-scores-2026.csv. The CSV includes all business subtypes and neighborhoods covered in this analysis, licensed under CC BY 4.0.
What demographic factors drive survivability for Armenian Restaurants?
For Armenian Restaurants, StreetSpring's model incorporates neighborhood-level demographic data including population density, median household income, employment rates, and consumer spending on this specific category. These factors vary by business type — the demographic profile that drives survivability for Armenian Restaurant customers may differ significantly from what matters for other business categories.
What is the typical survivability range for Armenian Restaurants in top neighborhoods?
The top 25 neighborhoods nationwide for Armenian Restaurants average 91.6% survivability. The national average across all analyzed neighborhoods is 80.4%. The spread between top neighborhoods and the national average is 11.2% — representing the tangible survivability advantage of choosing a top-ranked location.
Which cities appear most frequently in the top 25 neighborhoods for Armenian Restaurants?
The cities most represented in the top 25 for Armenian Restaurants are Chicago (18), St. Louis (3), Washington DC (1). This concentration reflects the relative strength of consumer demand and competitive conditions for Armenian Restaurants in these markets. City-specific guides provide deeper analysis of each city's neighborhoods.
How can I compare specific addresses within these top neighborhoods?
StreetSpring's address-level tool allows you to input any commercial address and see predicted survivability for Armenian Restaurants. Even within the top-ranked neighborhoods, survivability varies meaningfully by block — address-level scoring is the most precise way to evaluate a specific site.
How do I interpret a survivability score?
A survivability score represents the estimated probability that a business of a specific type will still be operating at a given location after 2 years. A score of 80% means StreetSpring's model predicts an 80% chance of the business surviving past the 2-year mark at that address. Scores are calculated at the address level and reflect competitive density, consumer spending patterns, mobility data, and 80+ additional factors.
What is the difference between city-level and neighborhood-level survivability rankings for Armenian Restaurants?
City-level rankings reflect average survivability for Armenian Restaurants across all neighborhoods in a given city — useful for identifying which cities offer the best overall conditions. Neighborhood-level rankings go deeper, showing which specific neighborhoods within those cities rank highest. StreetSpring's address-level tool adds a third layer, scoring individual storefronts within any neighborhood.
Technical note: Aggregated national survivability rankings across all 24 metros are available in machine-readable format for research and integration purposes.
StreetSpring recalculates survivability using the latest competitive, demographic, and walkability data, so the live score may differ from the static ranges shown here.
Methodology: Neighborhood rankings are based on average Survivability Scores for Armenian Restaurants across all analyzed locations within each neighborhood. Rankings represent neighborhood-level conditions but do not account for block-by-block variation. Coverage includes 1426 neighborhoods across 24 major US cities.