National Neighborhood Survivability Rankings for Filipino Restaurant
StreetSpring's 2026 nationwide analysis ranks the top neighborhoods across all major US cities for Filipino Restaurants. See which neighborhoods offer the highest Survivability Scores.
Tysons (Washington DC) ranks #1 nationally for Filipino Restaurant survivability in 2026, with a 94% chance of success for new entrants. The top 25 neighborhoods nationwide span 5 different cities, demonstrating that exceptional opportunities for Filipino Restaurants exist across diverse markets. Rankings like this are a strong starting point, but the live survivability score in StreetSpring will reflect the most current competitor data for your exact address.
To understand the methodology behind these rankings, see our detailed guide: Survivability Score: How We Calculate It & Why It Matters.
Last reviewed by Bobby Koons, Founder & CEO, StreetSpring — May 3, 2026
Quick Summary
- #1 Neighborhood: Tysons, Washington DC — 94% survivability for Filipino Restaurant
- Neighborhoods analyzed: 1426 across 24 major US cities
- National average survivability: 80.9% for Filipino Restaurants
- Top-25 average: 91.6% — 10.7% above national average
- Data current as of: 2026 · Full methodology →
Table of Contents
- How neighborhoods compare nationwide
- Top 25 neighborhoods in the US
- Geographic patterns
- How to use this ranking
- Related resources
- Frequently asked questions
Neighborhood-by-neighborhood survivability for Filipino Restaurants nationwide
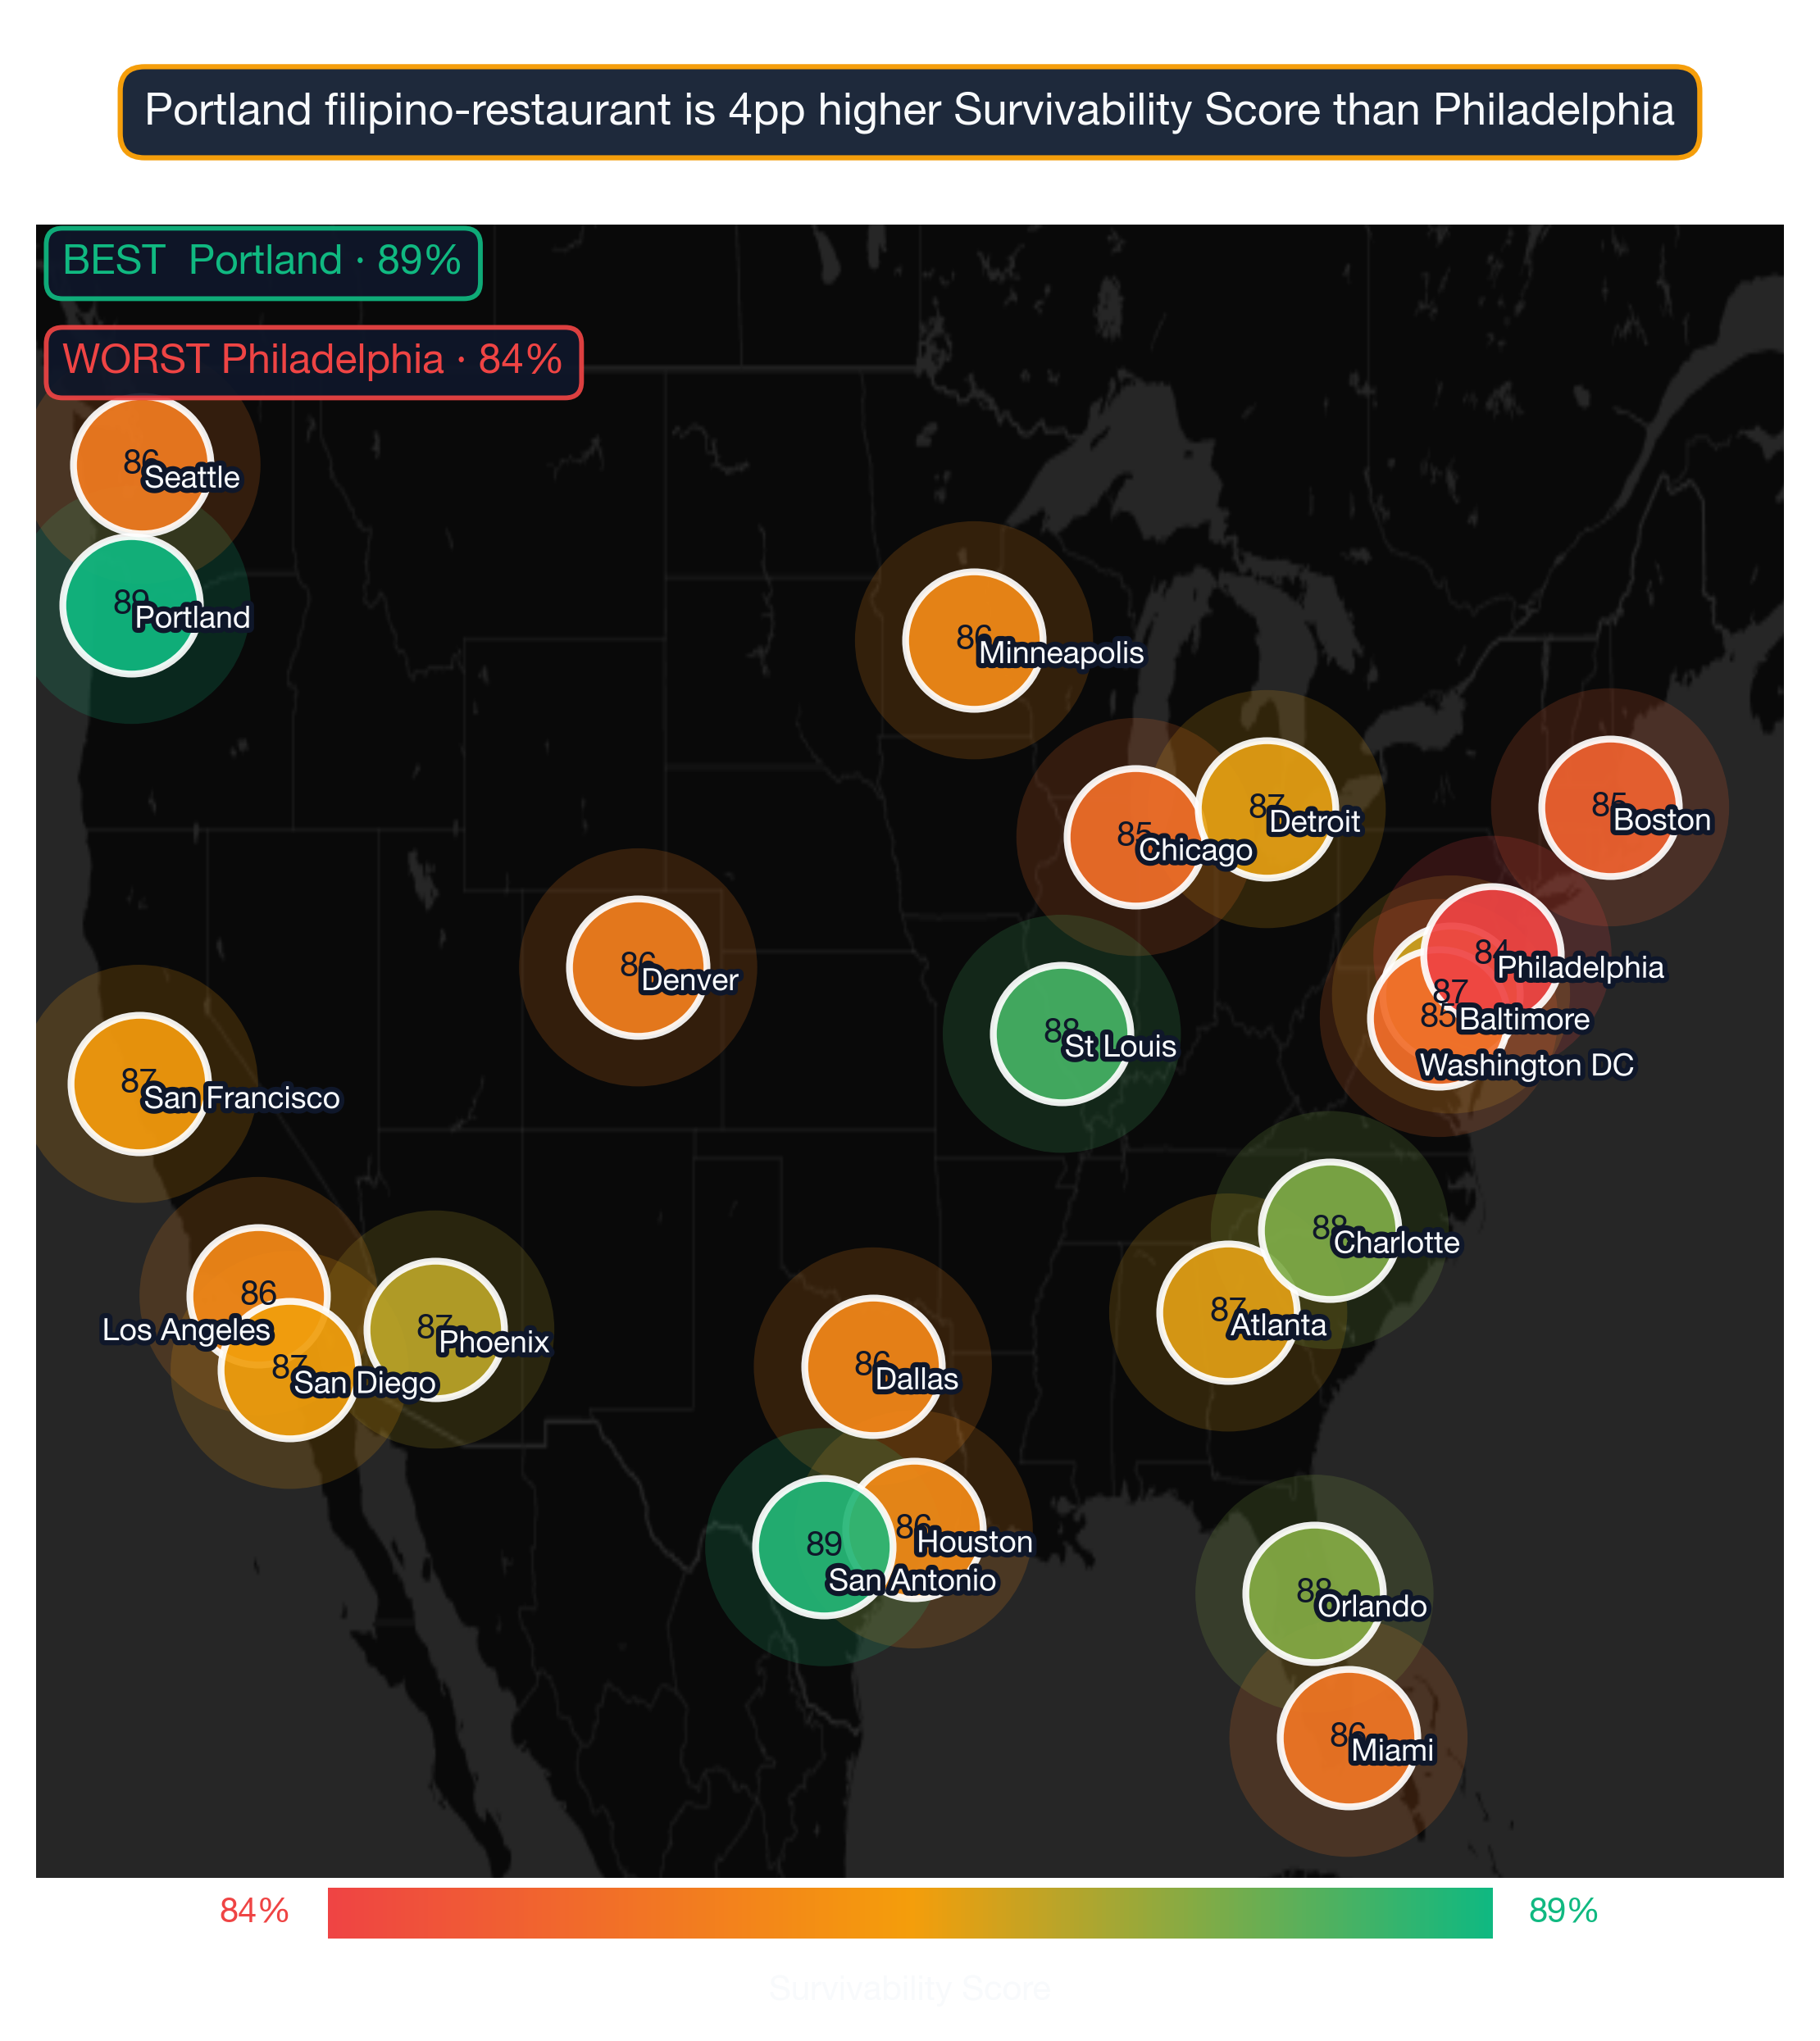
Analyzing 1426 neighborhoods across 24 major US cities, StreetSpring's 2026 data shows that the best neighborhoods for Filipino Restaurants significantly outperform average locations, with the top 25 neighborhoods nationwide averaging 91.6% survivability compared to the national neighborhood average of 80.9%.
Where the surprising outliers come from
This 10.7% advantage illustrates how critical neighborhood selection is — choosing a top-tier neighborhood versus an average one can significantly increase your long-term survival chances.
What the nationwide score spread means for owners
For Filipino Restaurants specifically, survivability is driven primarily by competitive density within the immediate trade area and the alignment between local consumer spending patterns and the category's typical revenue profile. The 10.7% gap between top-ranked neighborhoods and the national average for Filipino Restaurants reflects meaningful variation in how competitive these markets are across different neighborhoods — a stronger signal than is typical for many business categories. StreetSpring uses custom-built, proprietary algorithms to produce these predictions.
Importantly, top-performing neighborhoods aren't concentrated in just a few cities. The top 25 neighborhoods represent 5 different cities. This means entrepreneurs focused on Filipino Restaurants can find exceptional opportunities across the United States, not just in traditionally strong markets.
Every site-selection decision starts and ends with location — it outweighs concept, brand, and execution combined.
The strongest US neighborhoods for opening a Filipino Restaurant
| Signal | Top-quartile neighborhood pattern | Bottom-quartile neighborhood pattern |
|---|---|---|
| Storefront vacancy + churn signal | Neighborhoods with low recent vacancy and steady operator continuity in similar subtypes. | Neighborhoods with elevated commercial vacancy or repeated tenant turnover in the same storefronts. |
| Median household income alignment | Neighborhoods where median household income fits the subtype's typical customer profile (income elasticity matches). | Neighborhoods where income is either too low for the price tier or too high for the value-perception band. |
| Anchor-venue spillover | Neighborhoods within 0.25 miles of a major anchor (transit hub, university gate, hospital main entrance, concert venue). | Neighborhoods where the nearest anchor is past walking distance — no spillover demand. |
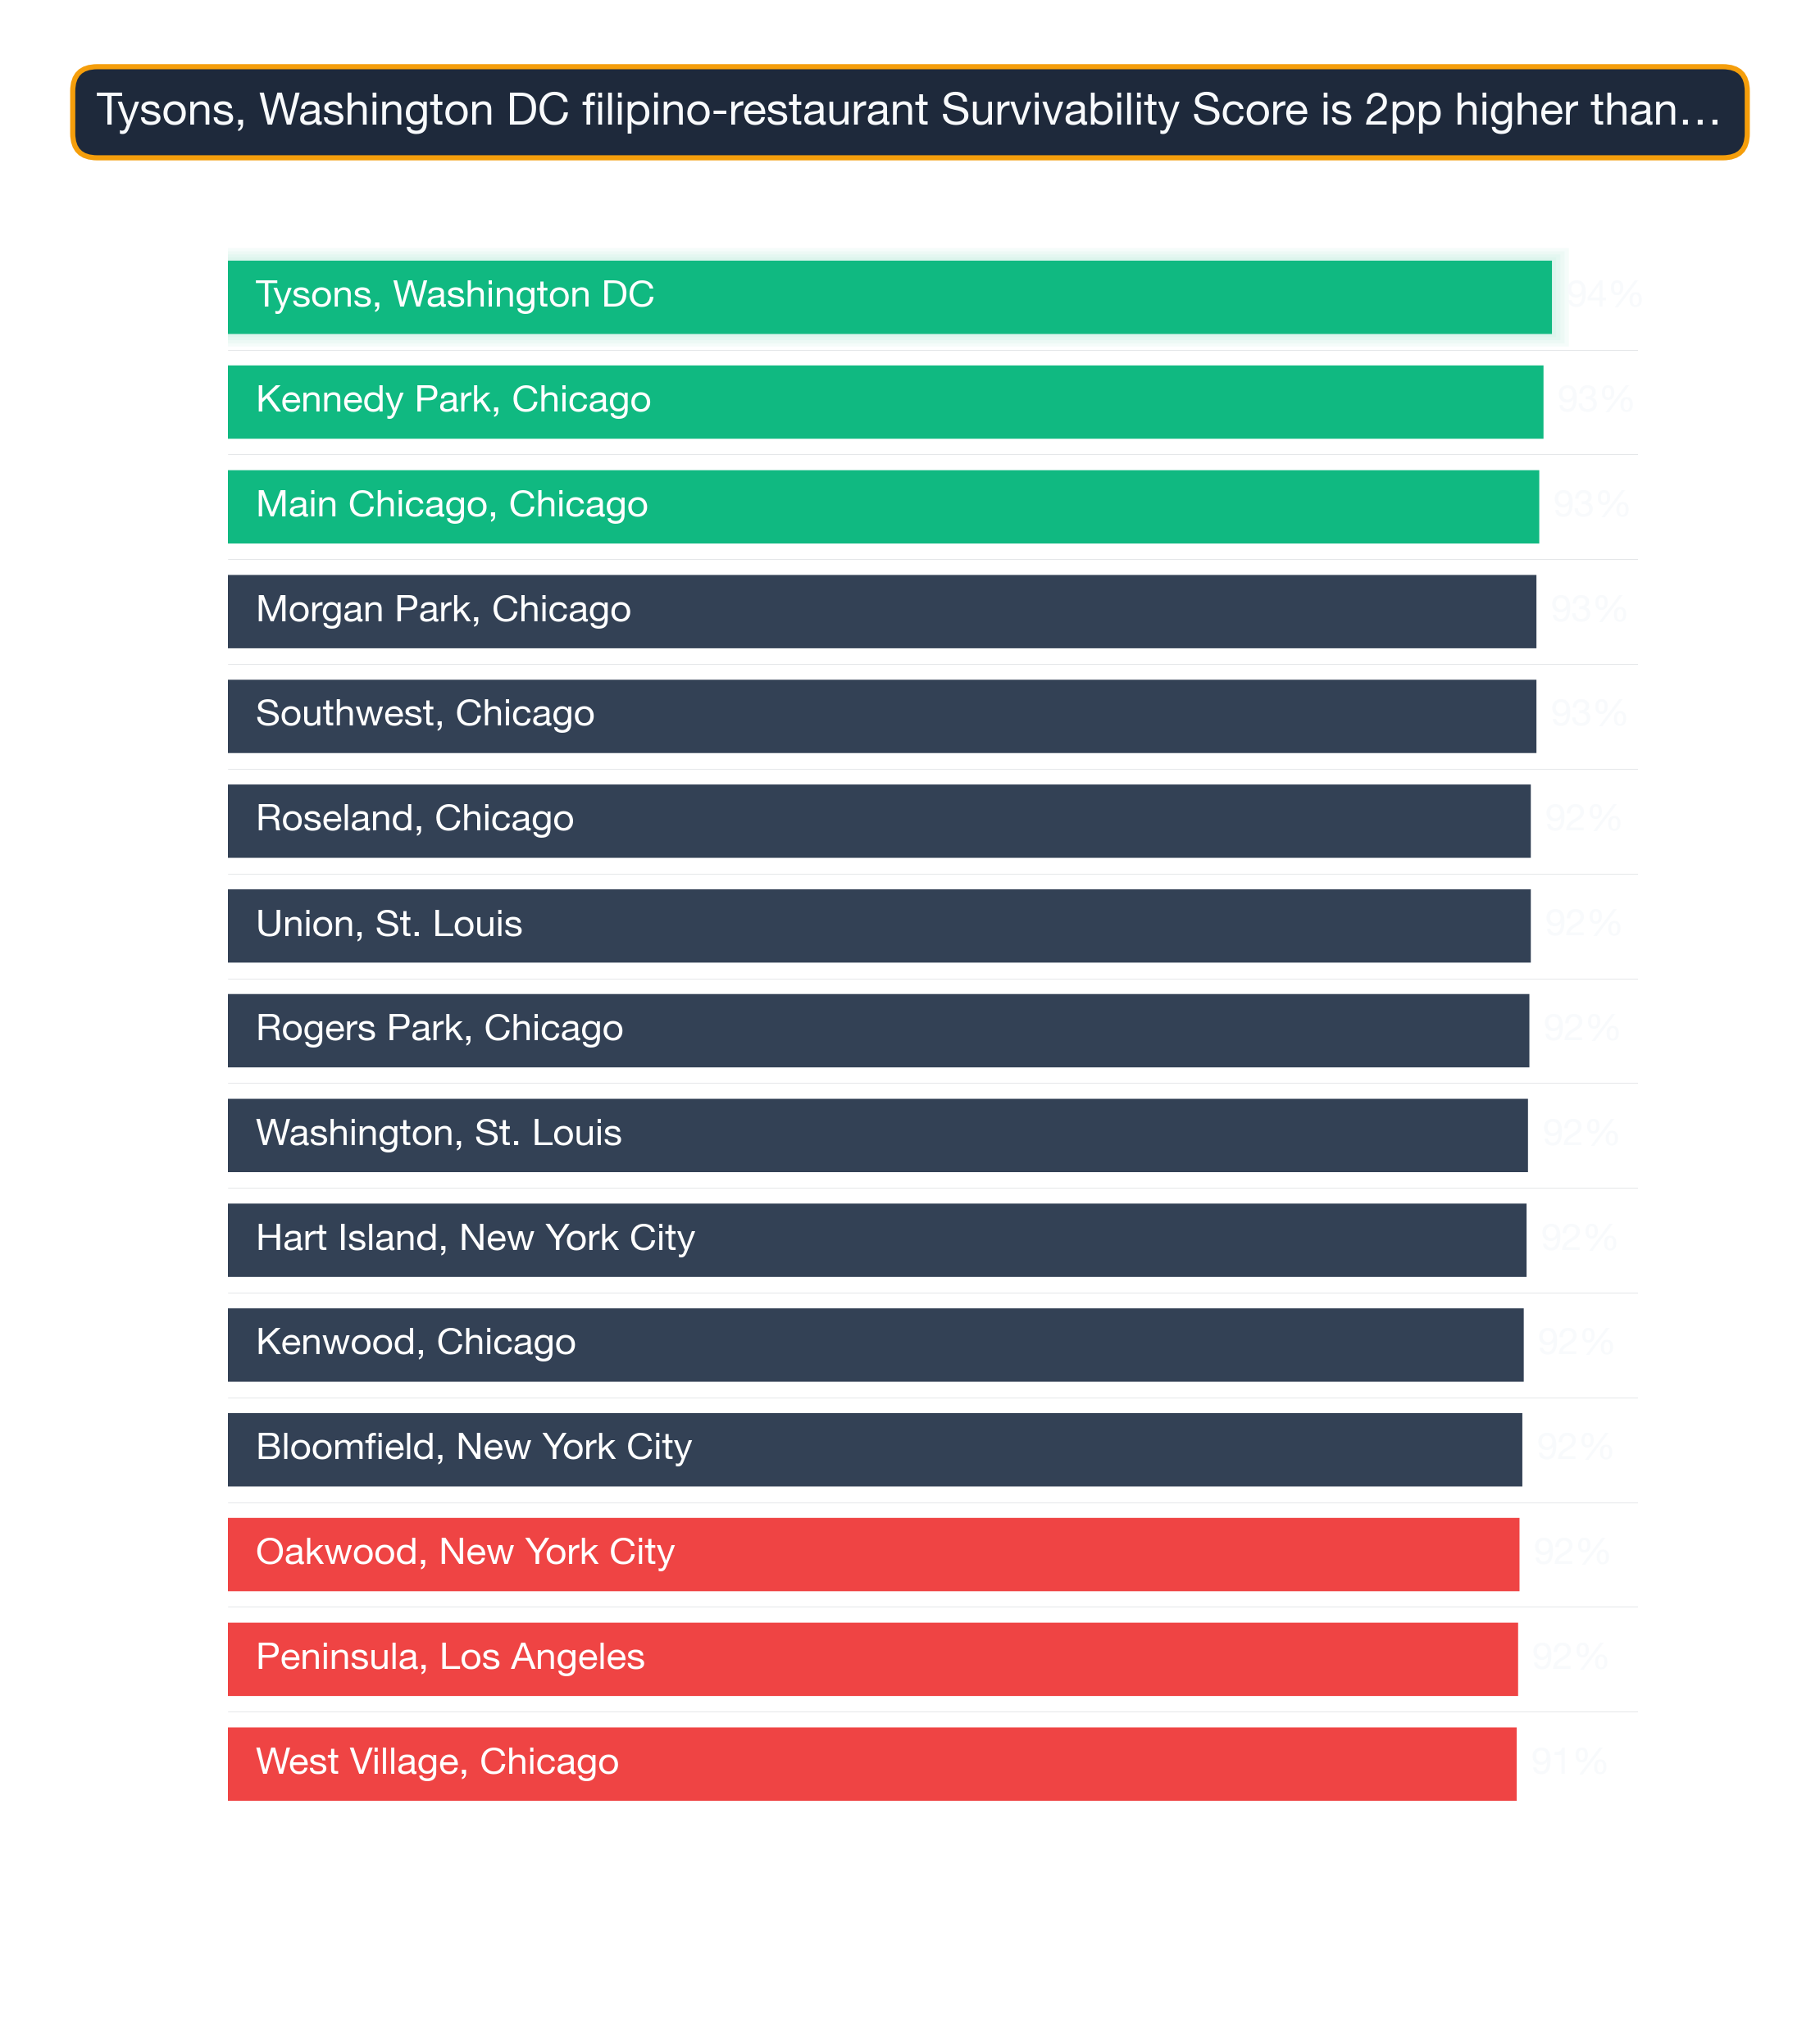
Reading the score gap inside the top 10
Survivability range for top, middle, and last-ranked neighborhoods. Box = best-to-challenging range; white line = average. Tysons, Washington DC leads at 94% in 2026. Full methodology →
The top 25 neighborhoods nationwide for Filipino Restaurants are:
| # | Neighborhood | City | Avg Survival | Tier | Best Locations | Challenging Locations |
|---|---|---|---|---|---|---|
| 1 | Tysons | Washington DC | 93.9% | Great | 95.3% | 91.9% |
| 2 | Kennedy Park | Chicago | 93.3% | Great | 94.7% | 91.4% |
| 3 | Main-Chicago | Chicago | 93.0% | Great | 94.4% | 91.0% |
| 4 | Southwest | Chicago | 92.8% | Great | 94.2% | 90.9% |
| 5 | Morgan Park | Chicago | 92.8% | Great | 94.2% | 90.8% |
| 6 | Roseland | Chicago | 92.4% | Great | 93.8% | 90.5% |
| 7 | Union | St. Louis | 92.4% | Great | 93.8% | 90.4% |
| 8 | Rogers Park | Chicago | 92.3% | Great | 93.7% | 90.4% |
| 9 | Washington | St. Louis | 92.2% | Great | 93.6% | 90.3% |
| 10 | Kenwood | Chicago | 91.9% | Great | 93.3% | 89.9% |
| 11 | Peninsula | Los Angeles | 91.5% | Great | 92.9% | 89.5% |
| 12 | West Village | Chicago | 91.4% | Great | 92.8% | 89.4% |
| 13 | Troy | St. Louis | 91.3% | Great | 92.7% | 89.3% |
| 14 | River North | Chicago | 91.3% | Great | 92.7% | 89.3% |
| 15 | West Town | Chicago | 91.0% | Great | 92.4% | 89.1% |
| 16 | Margate Park | Chicago | 90.9% | Great | 92.3% | 89.0% |
| 17 | Noble Square | Chicago | 90.9% | Great | 92.2% | 88.9% |
| 18 | North Center | Chicago | 90.8% | Great | 92.2% | 88.8% |
| 19 | Wildwood | Chicago | 90.7% | Great | 92.1% | 88.7% |
| 20 | Mayfair | Chicago | 90.6% | Great | 92.0% | 88.7% |
| 21 | Cabrini Green | Chicago | 90.5% | Great | 91.9% | 88.6% |
| 22 | Rivertown | Detroit | 90.5% | Great | 91.9% | 88.5% |
| 23 | Festus | St. Louis | 90.4% | Great | 91.8% | 88.5% |
| 24 | Edgewater | Chicago | 90.4% | Great | 91.8% | 88.4% |
| 25 | Uptown | Chicago | 90.4% | Great | 91.7% | 88.4% |
Top-ranked neighborhoods contain their own variation; a single block difference can shift survivability meaningfully, which is why address-level scoring matters.
For a full explanation of how survivability scores and ranges are calculated, see Survivability Score: How We Calculate It & Why It Matters.
Shared traits of the strongest US neighborhoods
City Concentration
The top 25 neighborhoods span 5 different cities, with Chicago claiming 18 of the top spots (72%).
Breakdown of top 25 neighborhoods by city:
- Chicago: 18 neighborhoods (72% of top 25) — View city guide
- St. Louis: 4 neighborhoods (16% of top 25) — View city guide
- Washington DC: 1 neighborhood (4% of top 25) — View city guide
- Los Angeles: 1 neighborhood (4% of top 25) — View city guide
- Detroit: 1 neighborhood (4% of top 25) — View city guide
This distribution has practical implications for Filipino Restaurants operators: cities with multiple neighborhoods in the top 25 offer more site options within a single market, reducing relocation or expansion cost. Cities with a single top-25 neighborhood require more precise site selection — the advantage is concentrated in one area rather than spread across the metro.
Why some neighborhoods score high without being downtown
The concentration of 18 top-ranked neighborhoods in Chicago (72% of the top 25) is notably high for this business category, suggesting that Chicago's market conditions — competitive density, consumer spending patterns, and demographic alignment — are unusually favorable for Filipino Restaurants. Operators targeting this category should treat Chicago neighborhoods as a primary focus before expanding to secondary markets.
Using neighborhood survivability to pick Filipino Restaurants sites
While nationwide neighborhood rankings identify standout markets, address-level analysis reveals even greater variation. StreetSpring's machine learning models identify the exact blocks and neighborhoods where specific business types consistently outperform — and the ones where they struggle. Even within top-ranked neighborhoods, specific block selection can vary survivability by 10–20 percentage points.
For the most accurate assessment:
- Consider neighborhoods in the top 25 as strong starting points
- Examine city-specific guides for additional neighborhood options in your target markets
- Use StreetSpring's address-level tool to evaluate specific storefronts within these neighborhoods
- Factor in your budget, operational requirements, and target demographics
Each neighborhood has detailed analysis available through its city guide, providing block-by-block survivability data for Filipino Restaurants.
Using the ranking to negotiate a better lease
See also: Best Cities for Filipino Restaurant — our city-level comparison ranks which metros offer the strongest overall conditions for Filipino Restaurants.
Cross-Category Patterns Across the Ranking
Survivability isn't subtype-specific in isolation. Neighborhoods that work for Filipino Restaurants often work for related business types — here's the cross-subtype picture at different points in the Filipino Restaurant ranking:
Tysons, Washington DC — ranked #1 nationally — the strongest neighborhood for Filipino Restaurants (94% survivability for Filipino Restaurant) Other business types that thrive in Tysons:
- Georgian Restaurant (96% survivability)
- Veterinary Clinic (96% survivability)
- Portuguese Restaurant (96% survivability)
Brookhill, Charlotte — ranked #714 of 1426 — a mid-ranked national neighborhood (80% survivability for Filipino Restaurant) Other business types that thrive in Brookhill:
- Russian Restaurant (85% survivability)
- Singaporean Restaurant (85% survivability)
- Day Care Center (84% survivability)
Check the cross-subtype list before signing. If a neighborhood is great for Filipino Restaurants but nothing else, treat that as data; if several subtypes score well together, the neighborhood-level signal is robust.
Visual Data
Related Resources
Explore top cities represented in these neighborhoods:
- St. Louis: Best businesses and neighborhoods
- Chicago: Best businesses and neighborhoods
- Detroit: Best businesses and neighborhoods
- Washington DC: Best businesses and neighborhoods
- Los Angeles: Best businesses and neighborhoods
National city rankings: Best cities for Filipino Restaurants
Essential resources:
- How StreetSpring calculates Survivability Scores
- Site selection for landlords
- AI tools for tenant representatives
- StreetSpring vs competitors
Frequently Asked Questions
How does the national ranking for Filipino Restaurants compare to city-level rankings?
The national neighborhood ranking for Filipino Restaurants identifies the strongest neighborhoods across all 24 analyzed metros. City-level rankings provide a more granular view of the best neighborhoods within a specific city. In cases where a city has multiple neighborhoods in the national top 25, the city-level guide shows the full ranking of all neighborhoods in that market — including those outside the national top 25 that may still offer strong site-specific opportunities.
What is the typical survivability range for Filipino Restaurants in top neighborhoods?
The top 25 neighborhoods nationwide for Filipino Restaurants average 91.6% survivability. The national average across all analyzed neighborhoods is 80.9%. The spread between top neighborhoods and the national average is 10.7% — representing the tangible survivability advantage of choosing a top-ranked location.
What makes Tysons in Washington DC the best neighborhood for Filipino Restaurants?
Tysons in Washington DC ranks #1 for Filipino Restaurants with 94% survivability. This reflects favorable competitive dynamics — fewer direct competitors relative to available consumer spending — strong demographic alignment with Filipino Restaurant customers, and local spending patterns that sustain this business category. StreetSpring's model weights these factors across all analyzed neighborhoods nationwide.
How can I compare specific addresses within these top neighborhoods?
StreetSpring's address-level tool allows you to input any commercial address and see predicted survivability for Filipino Restaurants. Even within the top-ranked neighborhoods, survivability varies meaningfully by block — address-level scoring is the most precise way to evaluate a specific site.
What demographic factors drive survivability for Filipino Restaurants?
For Filipino Restaurants, StreetSpring's model incorporates neighborhood-level demographic data including population density, median household income, employment rates, and consumer spending on this specific category. These factors vary by business type — the demographic profile that drives survivability for Filipino Restaurant customers may differ significantly from what matters for other business categories.
Are there good opportunities outside the top 25 neighborhoods?
Absolutely. Our analysis covers 1426 neighborhoods across 24 cities. Many neighborhoods outside the top 25 have excellent individual locations for Filipino Restaurants. Neighborhood-level rankings reflect averages — specific addresses within any neighborhood can score well above or below the neighborhood mean. Use city-specific guides and StreetSpring's address-level tool to explore options beyond the top 25.
What type of neighborhood is best for opening a Filipino Restaurant?
The best neighborhoods for Filipino Restaurants share three characteristics: manageable competitive density (few existing direct competitors within the primary trade area), strong consumer spending on this category, and demographic alignment with the typical Filipino Restaurant customer base. In StreetSpring's 2026 data, the top-ranked neighborhoods for Filipino Restaurants combine these factors in a way that produces survivability scores well above the national average of 80.9%. Neighborhoods with dense existing competition or low category spending tend to score significantly lower, regardless of overall foot traffic or prestige.
Where can I download the underlying data?
The full national survivability dataset is available as a free download: https://streetspring.com/resources/data/national-survivability-scores-2026.csv. The CSV includes all business subtypes and neighborhoods covered in this analysis, licensed under CC BY 4.0.
Technical note: Aggregated national survivability rankings across all 24 metros are available in machine-readable format for research and integration purposes.
StreetSpring recalculates survivability using the latest competitive, demographic, and walkability data, so the live score may differ from the static ranges shown here.
Methodology: Neighborhood rankings are based on average Survivability Scores for Filipino Restaurants across all analyzed locations within each neighborhood. Rankings represent neighborhood-level conditions but do not account for block-by-block variation. Coverage includes 1426 neighborhoods across 24 major US cities.