National Neighborhood Survivability Rankings for Eye Care Center
StreetSpring's 2026 nationwide analysis ranks the top neighborhoods across all major US cities for Eye Care Centers. See which neighborhoods offer the highest Survivability Scores.
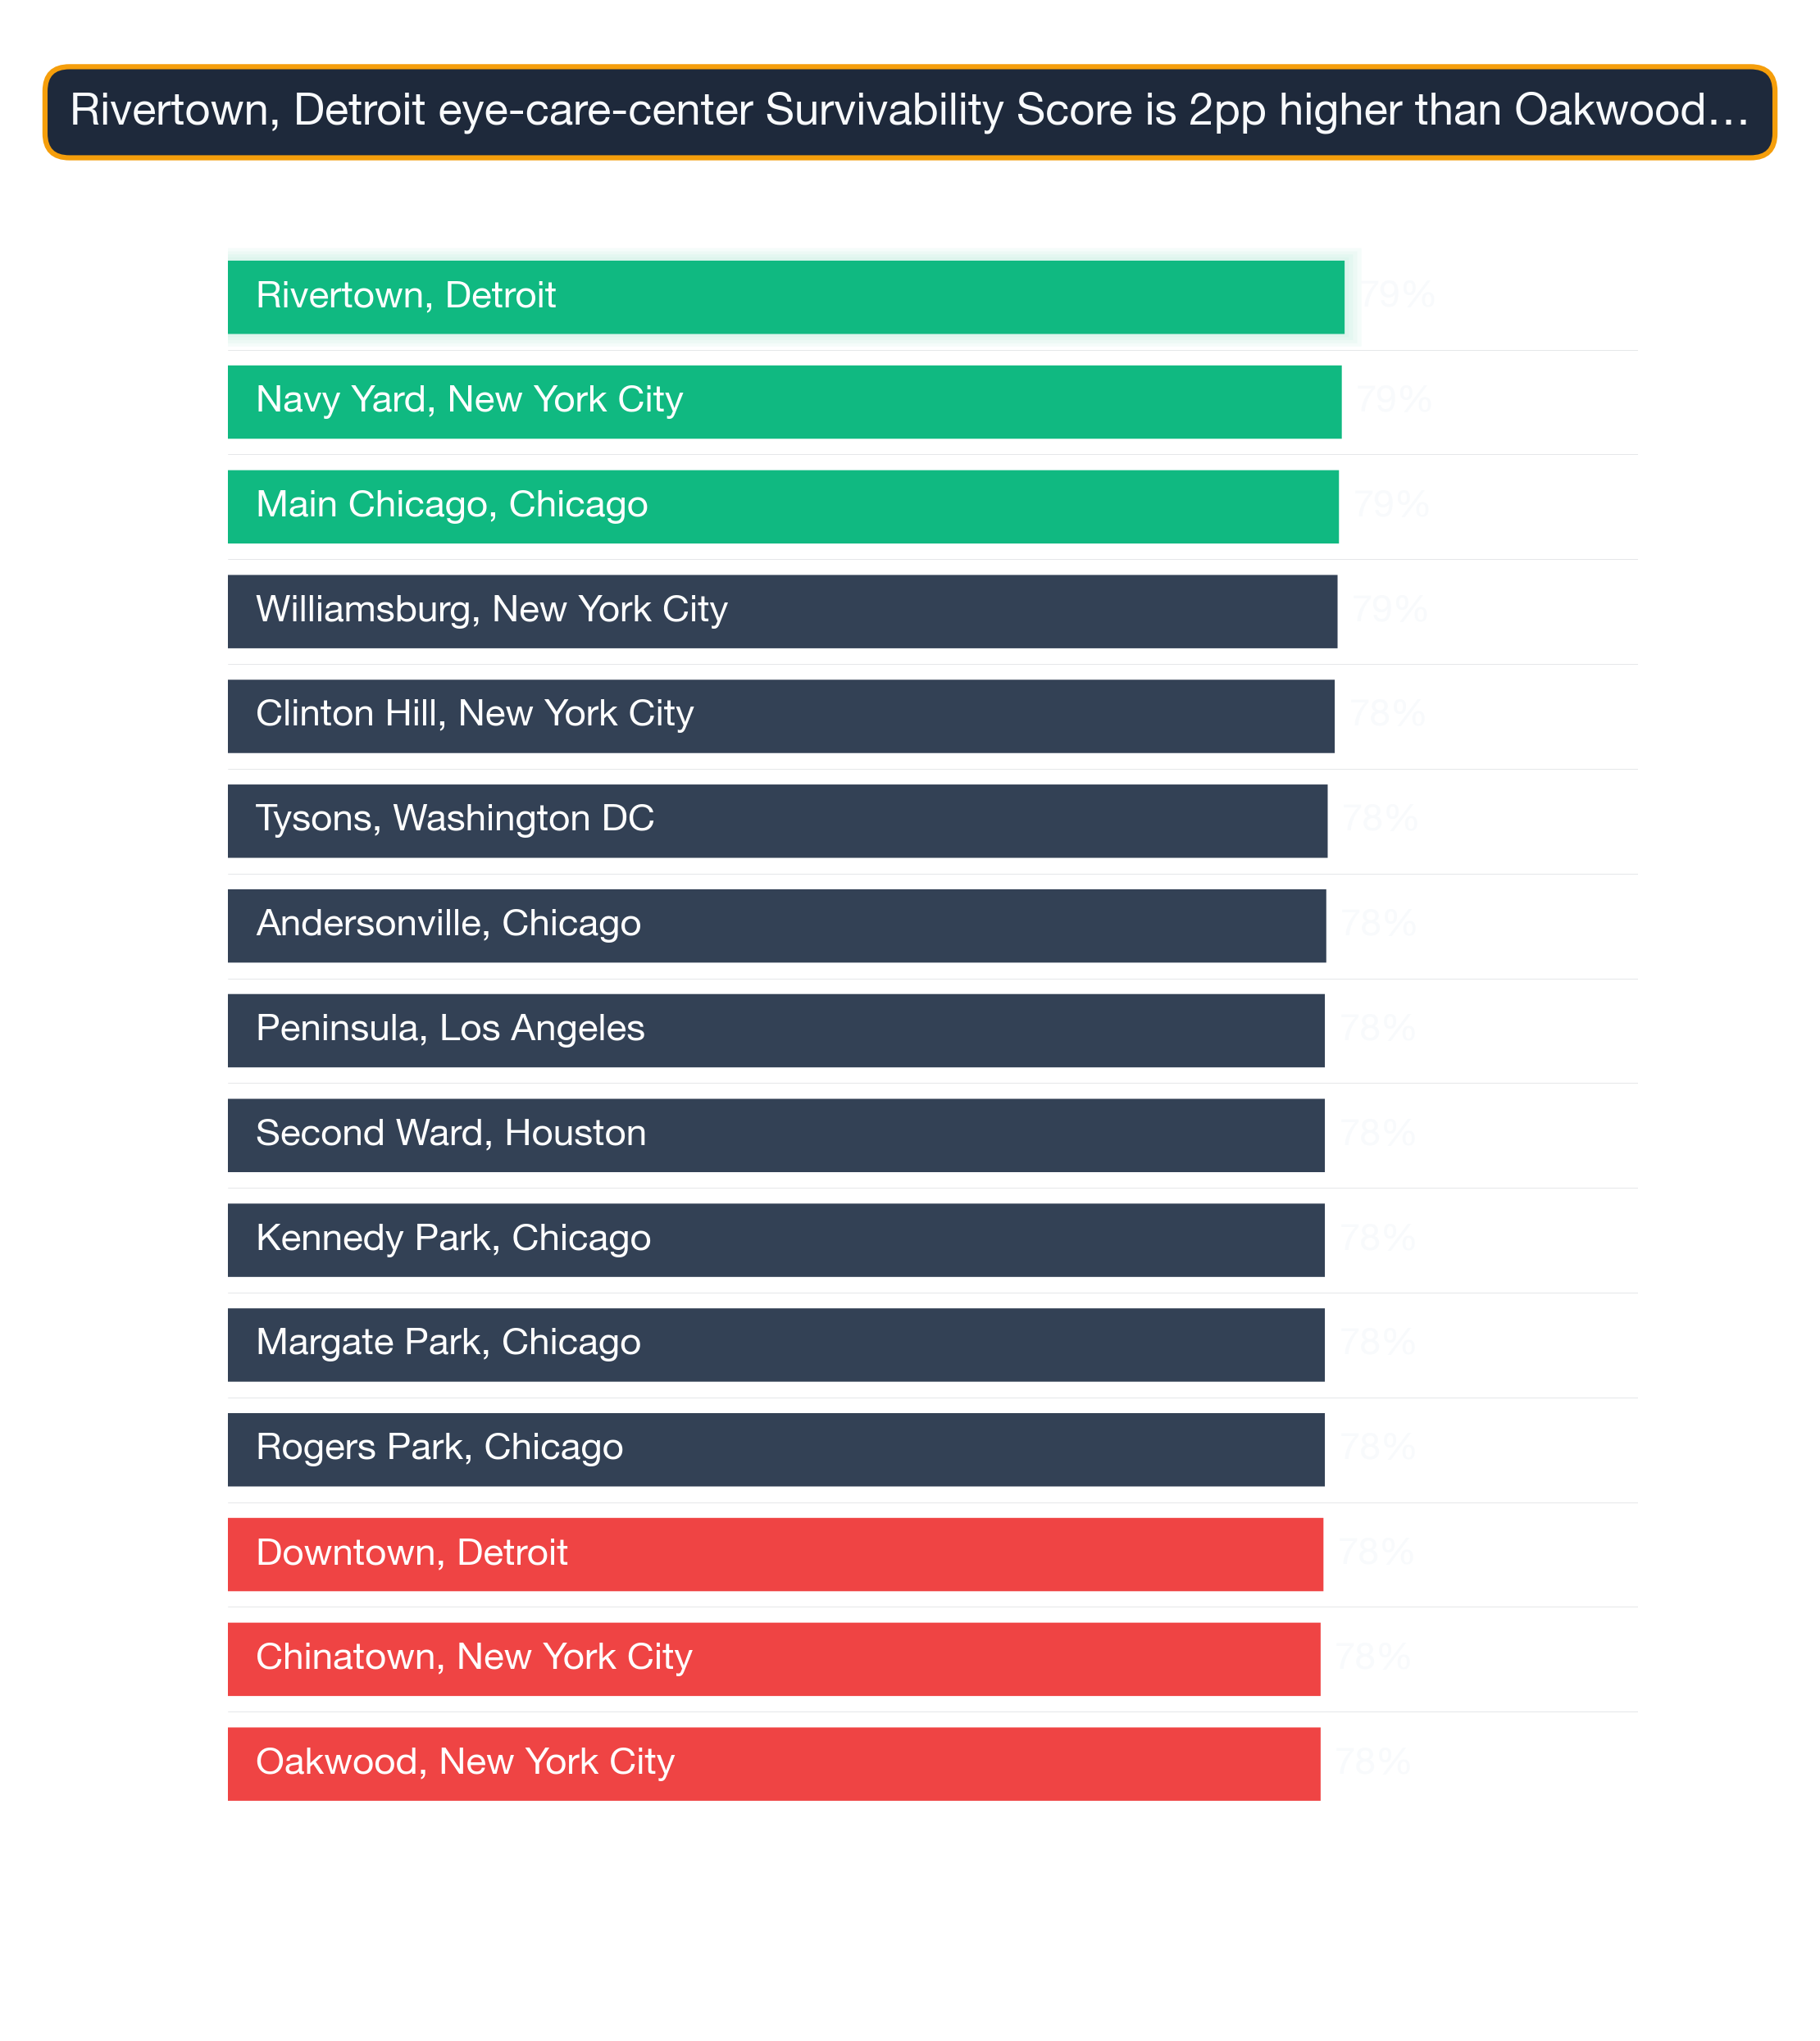
Of all neighborhoods across the US analyzed in 2026, Rivertown in Detroit offers the highest survivability for Eye Care Center operators at 79%. The top 25 neighborhoods nationwide span 8 different cities, demonstrating that exceptional opportunities for Eye Care Centers exist across diverse markets. Market conditions shift constantly — these neighborhood rankings are a directional guide, and StreetSpring's live tool shows the current score for any specific storefront.
To understand the methodology behind these rankings, see our detailed guide: Survivability Score: How We Calculate It & Why It Matters.
Last reviewed: May 5, 2026 by Bobby Koons, StreetSpring founder — updated weekly
Quick Summary
- #1 Neighborhood: Rivertown, Detroit — 79% survivability for Eye Care Center
- Neighborhoods analyzed: 1426 across 24 major US cities
- National average survivability: 61.9% for Eye Care Centers
- Top-25 average: 77.7% — 15.7% above national average
- Data current as of: 2026 · Full methodology →
Table of Contents
- How neighborhoods compare nationwide
- Top 25 neighborhoods in the US
- Geographic patterns
- How to use this ranking
- Related resources
- Frequently asked questions
Cross-Country Neighborhood Comparison for Eye Care Centers
Analyzing 1426 neighborhoods across 24 major US cities, StreetSpring's 2026 data shows that the best neighborhoods for Eye Care Centers significantly outperform average locations, with the top 25 neighborhoods nationwide averaging 77.7% survivability compared to the national neighborhood average of 61.9%.
How median scores differ city to city
This 15.7% advantage illustrates how critical neighborhood selection is — choosing a top-tier neighborhood versus an average one can significantly increase your long-term survival chances.
Where the surprising outliers come from
The consumer spending patterns that support Eye Care Centers vary more by neighborhood than by city — which is why neighborhood-level analysis is particularly valuable for this business category. A 15.7% difference between top neighborhoods and the national average indicates that location selection has an above-average impact on outcomes for Eye Care Centers compared to categories with narrower spreads. No other tool calculates survivability at the storefront level across 700+ business types the way StreetSpring does.
Importantly, top-performing neighborhoods aren't concentrated in just a few cities. The top 25 neighborhoods represent 8 different cities. This means entrepreneurs focused on Eye Care Centers can find exceptional opportunities across the United States, not just in traditionally strong markets.
Location shapes survivability more than branding, pricing, or operational quality — the data is unambiguous on this point.
Top US neighborhoods to open an Eye Care Center
| Comparison factor | Where high-survivability neighborhoods excel | Where lower-survivability neighborhoods fall short |
|---|---|---|
| Walk Score + foot-traffic alignment | Neighborhoods where Walk Score (90+) matches actual measured pedestrian volume — not just street-grid promise. | High Walk Score scores driven by transit density but with sparse street-level retail engagement. |
| Subtype-specific density saturation | Neighborhoods with the subtype below the optimal density curve — room for a new entrant without cannibalizing demand. | Neighborhoods at or past the saturation point for the subtype, where new entrants face zero-sum competition. |
| Daytime population concentration | Mixed-use neighborhoods with strong daytime employment density (LEHD LODES > 8K jobs/sq mi). | Pure-residential neighborhoods where daytime population drops below 30% of resident count. |
What competitive moat each top neighborhood has
Survivability range for top, middle, and last-ranked neighborhoods. Box = best-to-challenging range; white line = average. Rivertown, Detroit leads at 79% in 2026. Full methodology →
The top 25 neighborhoods nationwide for Eye Care Centers are:
| # | Neighborhood | City | Avg Survival | Tier | Best Locations | Challenging Locations |
|---|---|---|---|---|---|---|
| 1 | Rivertown | Detroit | 79.2% | Good | 81.0% | 77.3% |
| 2 | Navy Yard | New York City | 79.0% | Good | 80.9% | 77.2% |
| 3 | Main-Chicago | Chicago | 78.8% | Good | 80.6% | 76.9% |
| 4 | Williamsburg | New York City | 78.7% | Good | 80.5% | 76.8% |
| 5 | Clinton Hill | New York City | 78.5% | Good | 80.4% | 76.7% |
| 6 | Tysons | Washington DC | 78.0% | Good | 79.9% | 76.2% |
| 7 | Andersonville | Chicago | 77.9% | Good | 79.7% | 76.0% |
| 8 | Peninsula | Los Angeles | 77.8% | Good | 79.7% | 76.0% |
| 9 | Rogers Park | Chicago | 77.8% | Good | 79.7% | 75.9% |
| 10 | Margate Park | Chicago | 77.8% | Good | 79.7% | 75.9% |
| 11 | Kennedy Park | Chicago | 77.8% | Good | 79.6% | 75.9% |
| 12 | Second Ward | Houston | 77.8% | Good | 79.6% | 75.9% |
| 13 | Downtown | Detroit | 77.7% | Good | 79.5% | 75.8% |
| 14 | Stuyvesant Town | New York City | 77.5% | Good | 79.4% | 75.7% |
| 15 | Chinatown | New York City | 77.5% | Good | 79.3% | 75.6% |
| 16 | Union | St. Louis | 77.3% | Good | 79.1% | 75.4% |
| 17 | Lower East Side | New York City | 77.2% | Good | 79.1% | 75.4% |
| 18 | Gold Coast | Chicago | 77.0% | Good | 78.8% | 75.1% |
| 19 | Bushwick | New York City | 76.9% | Good | 78.8% | 75.1% |
| 20 | River North | Chicago | 76.9% | Good | 78.8% | 75.0% |
| 21 | West Village | Chicago | 76.9% | Good | 78.7% | 75.0% |
| 22 | Kenmore | Boston | 76.9% | Good | 78.7% | 75.0% |
| 23 | SoHo | New York City | 76.9% | Good | 78.7% | 75.0% |
| 24 | Noble Square | Chicago | 76.8% | Good | 78.6% | 74.9% |
| 25 | Chinatown | Boston | 76.8% | Good | 78.6% | 74.9% |
Still, specific site selection matters, since some of the best-performing blocks can be found in neighborhoods that might not look ideal at first glance.
For a full explanation of how survivability scores and ranges are calculated, see Survivability Score: How We Calculate It & Why It Matters.
Shared traits of the strongest US neighborhoods
City Concentration
The top 25 neighborhoods span 8 different cities, with Chicago claiming 9 of the top spots (36%).
Breakdown of top 25 neighborhoods by city:
- Chicago: 9 neighborhoods (36% of top 25) — View city guide
- New York City: 8 neighborhoods (32% of top 25) — View city guide
- Detroit: 2 neighborhoods (8% of top 25) — View city guide
- Boston: 2 neighborhoods (8% of top 25) — View city guide
- Washington DC: 1 neighborhood (4% of top 25) — View city guide
- Los Angeles: 1 neighborhood (4% of top 25) — View city guide
- Houston: 1 neighborhood (4% of top 25) — View city guide
- St. Louis: 1 neighborhood (4% of top 25) — View city guide
This distribution has practical implications for Eye Care Centers operators: cities with multiple neighborhoods in the top 25 offer more site options within a single market, reducing relocation or expansion cost. Cities with a single top-25 neighborhood require more precise site selection — the advantage is concentrated in one area rather than spread across the metro.
The income-and-density pattern
The relatively even distribution of top neighborhoods across 8 cities is consistent with a category where consumer demand is broadly distributed rather than concentrated in specific metros. For Eye Care Centers operators, this means strong site opportunities exist in multiple markets — the key variable is neighborhood-level competitive conditions rather than city-level market size.
Turning the neighborhood ranking into a location decision for an Eye Care Center
National rankings are a powerful starting point, but your final site decision should be validated at the address level. Entrepreneurs and commercial real estate agents in 24 major metros trust StreetSpring's survivability predictions to make smarter site-selection decisions. Block-level conditions within any neighborhood can shift survivability by 10–20 points — this ranking narrows your search, and StreetSpring's live tool finalizes it.
For the most accurate assessment:
- Consider neighborhoods in the top 25 as strong starting points
- Examine city-specific guides for additional neighborhood options in your target markets
- Use StreetSpring's address-level tool to evaluate specific storefronts within these neighborhoods
- Factor in your budget, operational requirements, and target demographics
Each neighborhood has detailed analysis available through its city guide, providing block-by-block survivability data for Eye Care Centers.
From national rank to your shortlist
See also: Best Cities for Eye Care Center — our city-level comparison ranks which metros offer the strongest overall conditions for Eye Care Centers.
Which Subtypes Thrive Alongside Eye Care Centers
Eye Care Center success and broader neighborhood quality often correlate. Below are top, middle, and bottom-ranked neighborhoods for Eye Care Centers along with what else thrives in each:
Rivertown, Detroit — ranked #1 nationally — the strongest neighborhood for Eye Care Centers (79% survivability for Eye Care Center) Other business types that thrive in Rivertown:
- Filipino Restaurant (90% survivability)
- Singaporean Restaurant (90% survivability)
- Eastern European Restaurant (90% survivability)
Woodmont, Washington DC — ranked #714 of 1426 — a mid-ranked national neighborhood (62% survivability for Eye Care Center) Other business types that thrive in Woodmont:
- Deli (84% survivability)
- Diner (83% survivability)
- Hungarian Restaurant (83% survivability)
Highland-Park, Seattle — ranked #1426 of 1426 — among the lower-ranked national neighborhoods (39% survivability for Eye Care Center) Other business types that thrive in Highland-Park:
- Kosher Restaurant (78% survivability)
- Ukrainian Restaurant (78% survivability)
- American Restaurant (77% survivability)
Cross-subtype synergy is a real signal. A neighborhood that scores high for Eye Care Centers is usually a sound bet for several other business types — useful for landlords and multi-concept owners.
Visual Data
Related Resources
Explore top cities represented in these neighborhoods:
- St. Louis: Best businesses and neighborhoods
- Boston: Best businesses and neighborhoods
- New York City: Best businesses and neighborhoods
- Houston: Best businesses and neighborhoods
- Chicago: Best businesses and neighborhoods
National city rankings: Best cities for Eye Care Centers
Essential resources:
- How StreetSpring calculates Survivability Scores
- Site selection for landlords
- AI tools for tenant representatives
- StreetSpring vs competitors
Frequently Asked Questions
Are there good opportunities outside the top 25 neighborhoods?
Absolutely. Our analysis covers 1426 neighborhoods across 24 cities. Many neighborhoods outside the top 25 have excellent individual locations for Eye Care Centers. Neighborhood-level rankings reflect averages — specific addresses within any neighborhood can score well above or below the neighborhood mean. Use city-specific guides and StreetSpring's address-level tool to explore options beyond the top 25.
How can I compare specific addresses within these top neighborhoods?
StreetSpring's address-level tool allows you to input any commercial address and see predicted survivability for Eye Care Centers. Even within the top-ranked neighborhoods, survivability varies meaningfully by block — address-level scoring is the most precise way to evaluate a specific site.
Is the competitive environment for Eye Care Centers stronger in some markets than others?
Yes — competition density for Eye Care Centers varies significantly by market. In the top-ranked neighborhoods, StreetSpring's model identifies favorable competitive dynamics as a primary driver of high survivability scores. In more saturated markets, even strong consumer spending may not overcome competitive pressure. StreetSpring's address-level tool shows the exact competitive environment at any specific location.
How do I interpret a survivability score?
A survivability score represents the estimated probability that a business of a specific type will still be operating at a given location after 2 years. A score of 80% means StreetSpring's model predicts an 80% chance of the business surviving past the 2-year mark at that address. Scores are calculated at the address level and reflect competitive density, consumer spending patterns, mobility data, and 80+ additional factors.
Which cities appear most frequently in the top 25 neighborhoods for Eye Care Centers?
The cities most represented in the top 25 for Eye Care Centers are Chicago (9), New York City (8), Detroit (2). This concentration reflects the relative strength of consumer demand and competitive conditions for Eye Care Centers in these markets. City-specific guides provide deeper analysis of each city's neighborhoods.
How does the national ranking for Eye Care Centers compare to city-level rankings?
The national neighborhood ranking for Eye Care Centers identifies the strongest neighborhoods across all 24 analyzed metros. City-level rankings provide a more granular view of the best neighborhoods within a specific city. In cases where a city has multiple neighborhoods in the national top 25, the city-level guide shows the full ranking of all neighborhoods in that market — including those outside the national top 25 that may still offer strong site-specific opportunities.
How does StreetSpring calculate survivability for Eye Care Centers specifically?
StreetSpring's model calculates survivability for Eye Care Centers by analyzing the competitive density of existing Eye Care Centers within each distance band around the address, the projected consumer spending on Eye Care Centers in that location, mobility patterns that determine likely customer flow, and 80+ additional factors. The resulting survivability score reflects the estimated probability of a new Eye Care Center surviving 2+ years at that specific address.
Can an Eye Care Center succeed in neighborhoods outside the top 25?
Yes — the top 25 neighborhoods represent standout conditions, but Eye Care Centers can achieve strong survivability in many other neighborhoods as well. What matters is finding a location where competitive density is low enough and consumer spending is strong enough to support the business. StreetSpring's address-level tool identifies high-survivability addresses in any neighborhood, including those not represented in this top-25 list.
Technical note: Aggregated national survivability rankings across all 24 metros are available in machine-readable format for research and integration purposes.
StreetSpring recalculates survivability using the latest competitive, demographic, and walkability data, so the live score may differ from the static ranges shown here.
Methodology: Neighborhood rankings are based on average Survivability Scores for Eye Care Centers across all analyzed locations within each neighborhood. Rankings represent neighborhood-level conditions but do not account for block-by-block variation. Coverage includes 1426 neighborhoods across 24 major US cities.