City Survivability Rankings for Eye Care Center
StreetSpring's 2026 analysis ranks the top cities for Eye Care Centers across the US by Survivability Scores. See which cities offer the best chances for an Eye Care Center to succeed.
Quick Summary
- The highest-survivability city for Eye Care Center is Dallas — 63% average survivability
- 0 of 24 analyzed US metros score above 70% for Eye Care Center survivability
- The lowest-ranked city is Philadelphia at 54%
- National average survivability score for Eye Care Center: 57.0%
- Data reflects 2026 StreetSpring survivability analysis across 24 US metro areas · Full methodology →
Table of Contents
- Summary
- Top Cities for Eye Care Centers
- Key Insights
- What Makes These Cities Stand Out?
- Best Neighborhoods Across the Spectrum
- Related Resources
- How current is this ranking?
- Can an Eye Care Center succeed in cities not ranked in the top 10?
- What tools can help me choose the right city for an Eye Care Center?
- Which US city has the best survivability for Eye Care Centers?
Summary
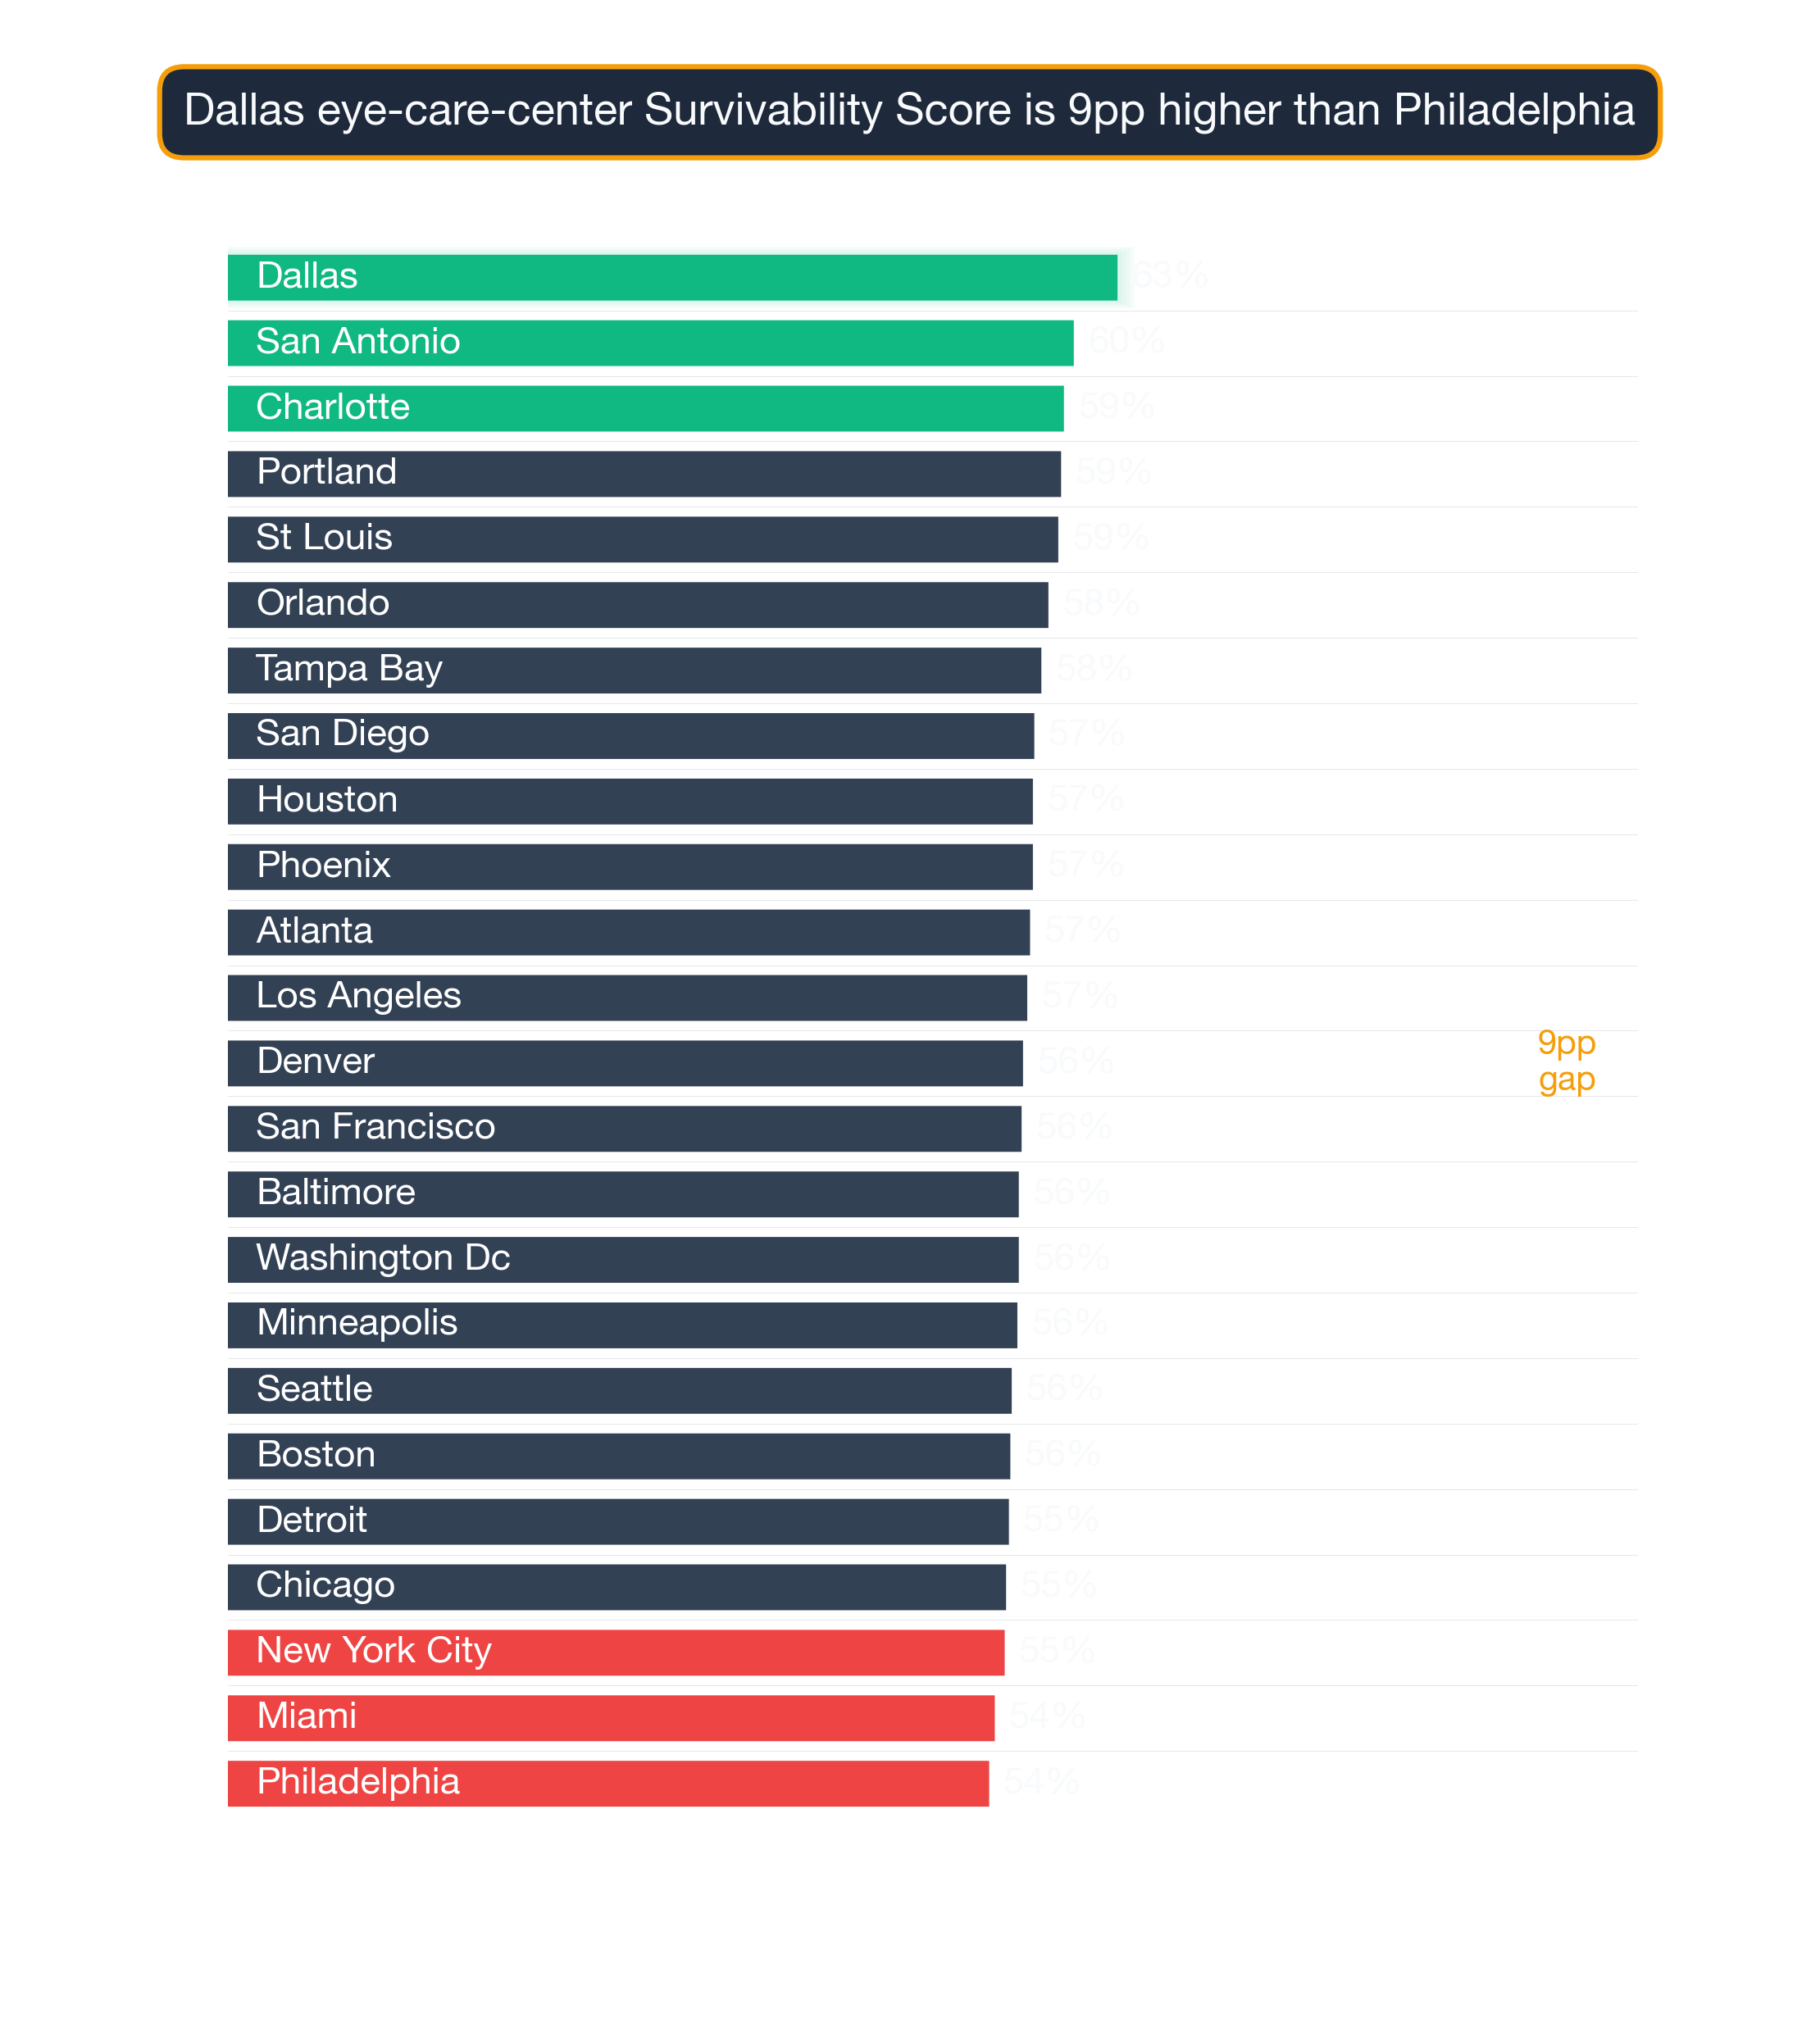
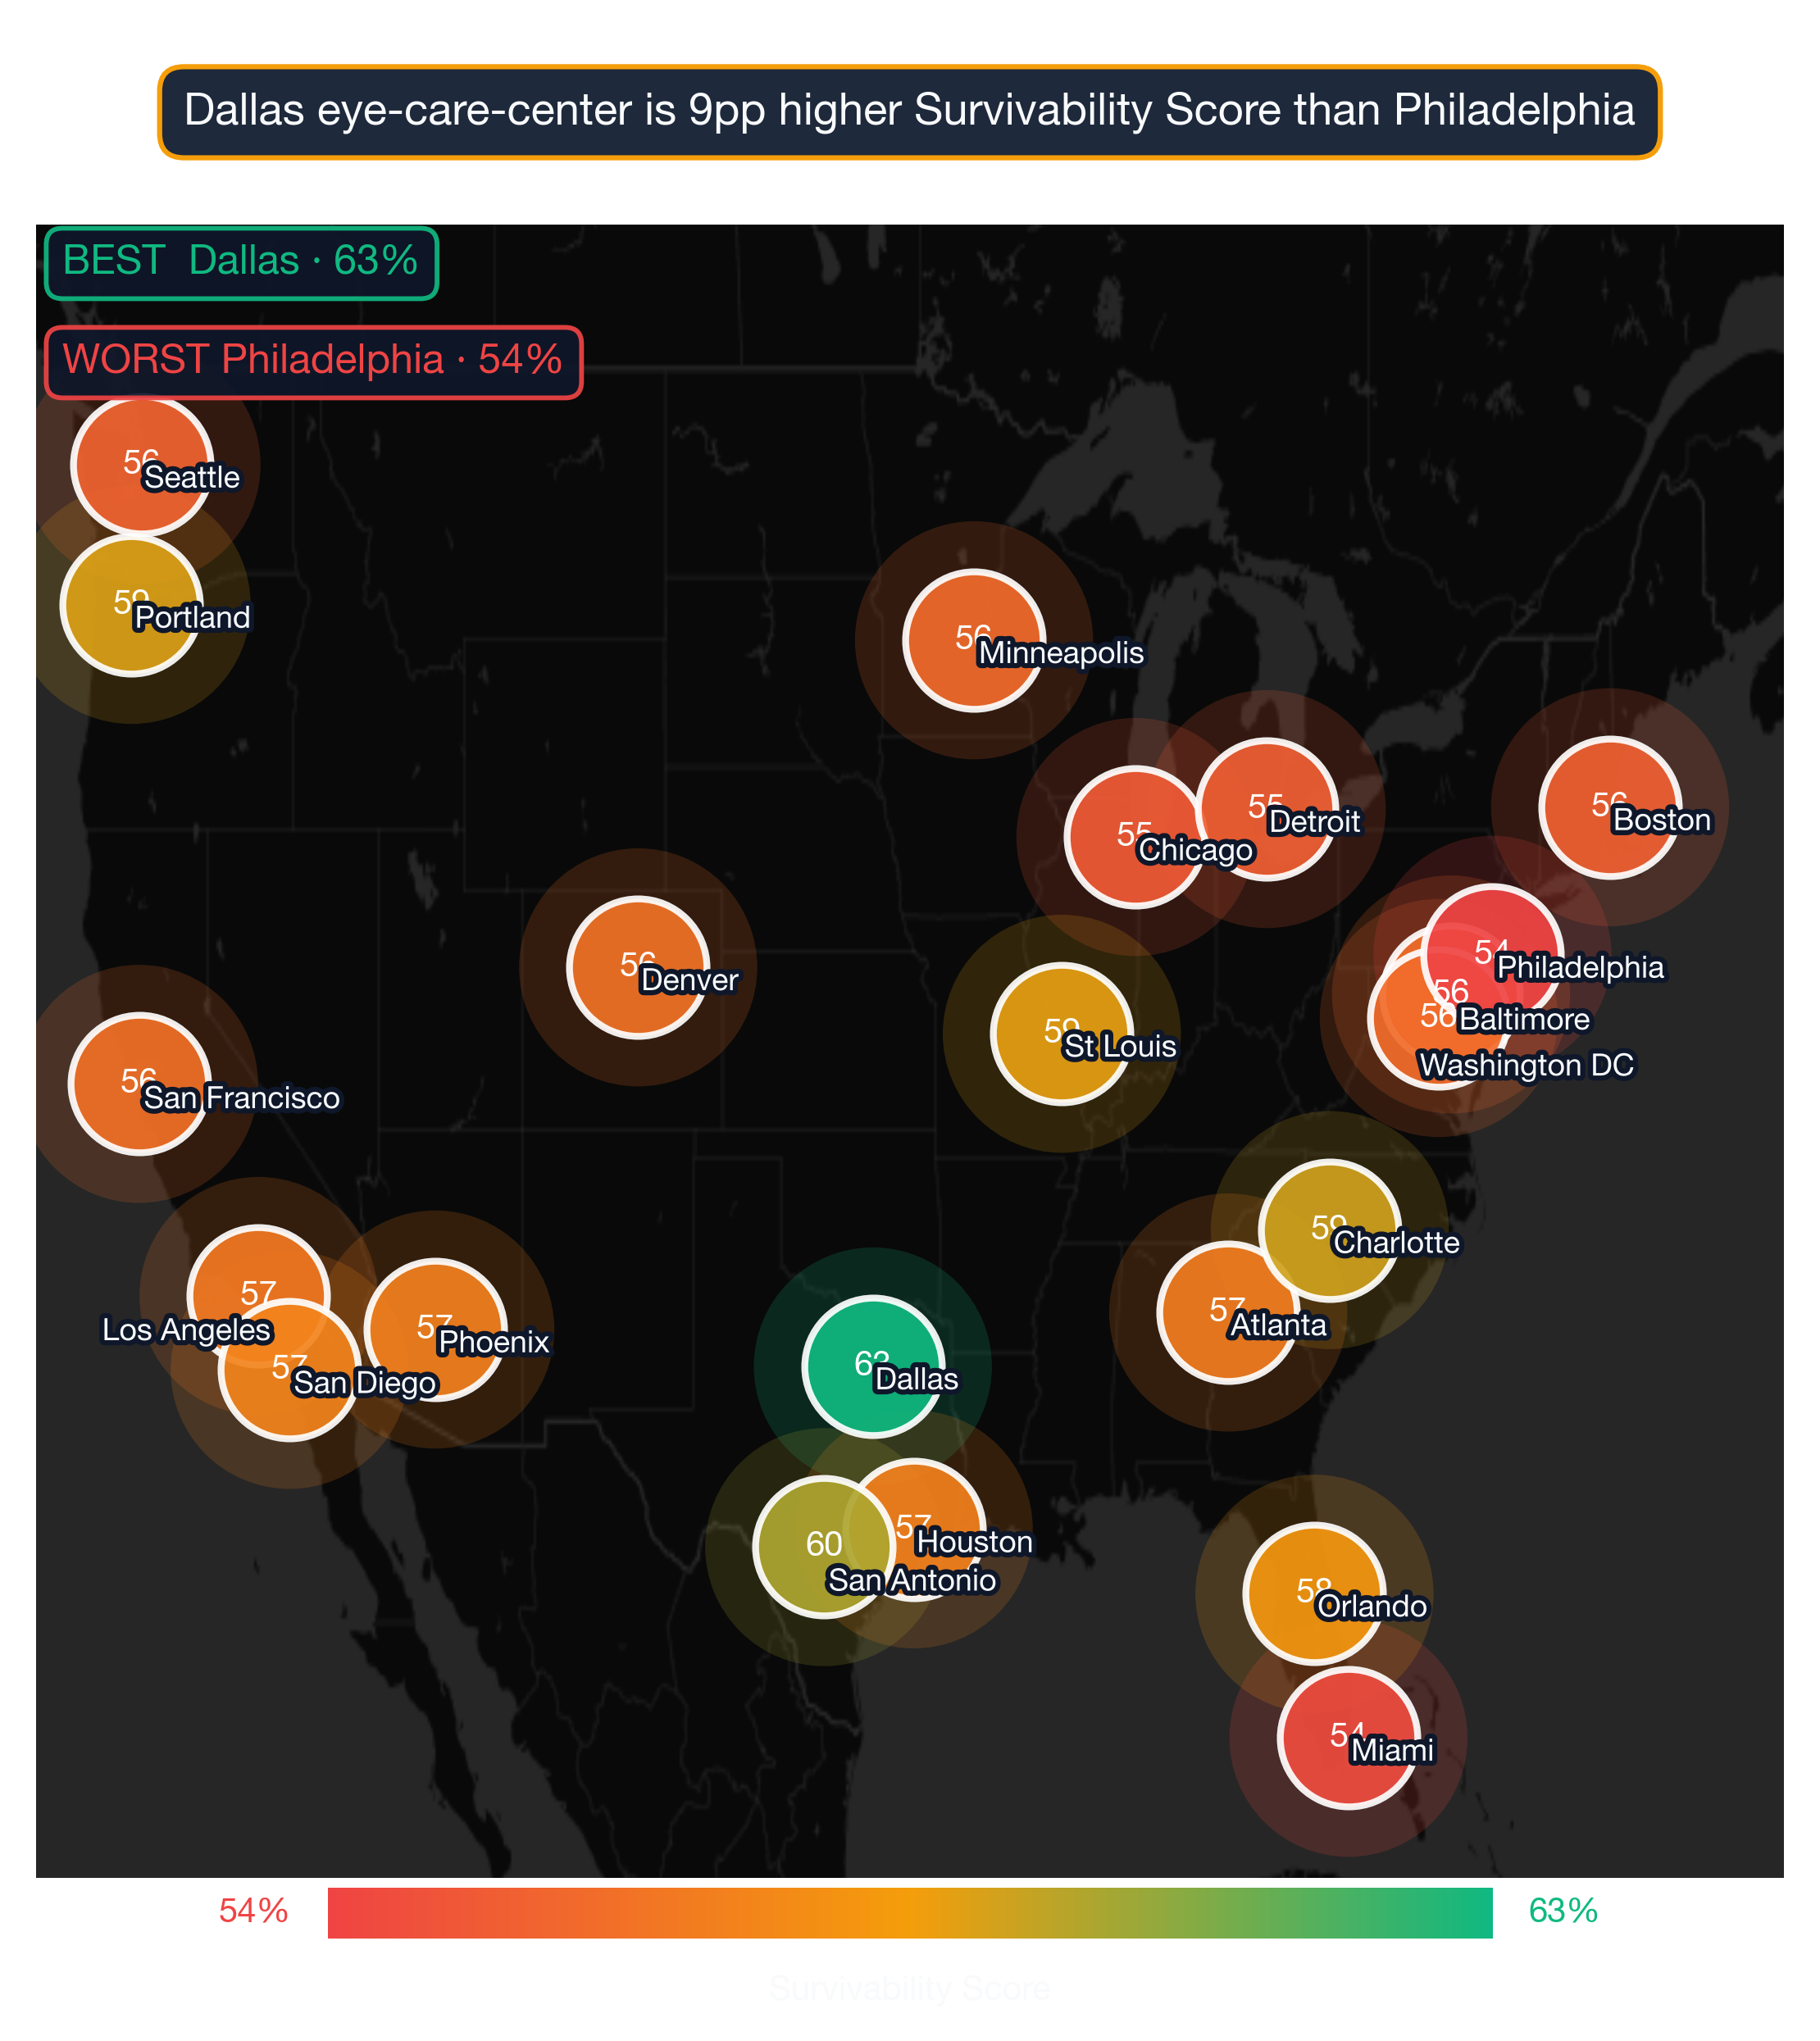
According to StreetSpring's 2026 nationwide analysis, Dallas ranks as the #1 city for opening an Eye Care Center in the United States, with an average 63% chance of surviving more than 2 years. Following close behind are San Antonio with 60%, and Charlotte with 59%. Eye Care Centers sit at a national average of 57.0% survivability across our 24-city analysis, with Dallas leading the field by a meaningful margin. That said, city averages don't tell the whole story — there are standout locations even in areas that appear less suitable at first glance. Pair these survivability scores with StreetSpring's live tool to get a real-time view before making a final decision.
Survivability ranges reflect best and worst storefront conditions within each city. See our full methodology →

Eye Care Center city survivability rankings — Dallas leads among 24 US metros at 63% in 2026
Where Eye Care Centers Stand Across 24 US Metros
Based on StreetSpring's analysis of 24 major metropolitan areas, these cities offer the strongest prospects for Eye Care Centers:
1. Dallas Metro: Dallas-Fort Worth-Arlington, TX
- Best locations: 69.4% – 77.0%
- Average locations: 60.0% – 64.8%
- Challenging locations: 37.0% – 55.3%
- Explore Eye Care Center neighborhoods in Dallas →
Why the same business does so differently city to city
2. San Antonio Metro: San Antonio-New Braunfels, TX
- Best locations: 70.8% – 84.0%
- Average locations: 56.9% – 62.9%
- Challenging locations: 34.0% – 52.2%
- Explore Eye Care Center neighborhoods in San Antonio →
3. Charlotte Metro: Charlotte-Concord-Gastonia, NC-SC
- Best locations: 65.5% – 73.0%
- Average locations: 56.5% – 61.0%
- Challenging locations: 36.0% – 52.3%
- Explore Eye Care Center neighborhoods in Charlotte →
4. Portland Metro: Portland-Vancouver-Hillsboro, OR-WA
- Best locations: 65.3% – 73.0%
- Average locations: 55.6% – 60.7%
- Challenging locations: 30.0% – 50.3%
- Explore Eye Care Center neighborhoods in Portland →
5. St Louis
- Best locations: 69.3% – 82.0%
- Average locations: 55.3% – 61.7%
- Challenging locations: 29.0% – 49.9%
- Explore Eye Care Center neighborhoods in St Louis →
6. Orlando Metro: Orlando-Kissimmee-Sanford, FL
- Best locations: 63.5% – 70.0%
- Average locations: 55.0% – 59.6%
- Challenging locations: 32.0% – 50.3%
- Explore Eye Care Center neighborhoods in Orlando →
7. Tampa Bay Metro: Tampa-St. Petersburg-Clearwater, FL
- Best locations: 66.4% – 77.0%
- Average locations: 54.6% – 60.0%
- Challenging locations: 32.0% – 50.0%
- Explore Eye Care Center neighborhoods in Tampa Bay →
8. San Diego Metro: San Diego-Chula Vista-Carlsbad, CA
- Best locations: 64.8% – 74.0%
- Average locations: 54.1% – 59.3%
- Challenging locations: 31.0% – 49.4%
- Explore Eye Care Center neighborhoods in San Diego →
9. Houston Metro: Houston-Pasadena-The Woodlands, TX
- Best locations: 67.0% – 79.0%
- Average locations: 54.2% – 59.8%
- Challenging locations: 33.0% – 49.9%
- Explore Eye Care Center neighborhoods in Houston →
10. Phoenix Metro: Phoenix-Mesa-Chandler, AZ
- Best locations: 68.8% – 83.0%
- Average locations: 54.2% – 60.2%
- Challenging locations: 33.0% – 49.9%
- Explore Eye Care Center neighborhoods in Phoenix →
11. Atlanta Metro: Atlanta-Sandy Springs-Roswell, GA
- Best locations: 66.9% – 79.0%
- Average locations: 53.6% – 59.6%
- Challenging locations: 29.0% – 48.5%
- Explore Eye Care Center neighborhoods in Atlanta →
12. Los Angeles Metro: Los Angeles-Long Beach-Anaheim, CA
- Best locations: 67.2% – 80.0%
- Average locations: 53.5% – 59.5%
- Challenging locations: 30.0% – 48.7%
- Explore Eye Care Center neighborhoods in Los Angeles →
Where the top 5 cluster, and the surprising outliers
13. Denver Metro: Denver-Aurora-Centennial, CO
- Best locations: 62.5% – 70.0%
- Average locations: 53.1% – 58.0%
- Challenging locations: 29.0% – 48.2%
- Explore Eye Care Center neighborhoods in Denver →
14. San Francisco Metro: San Francisco-Oakland-Fremont, CA
- Best locations: 64.7% – 75.0%
- Average locations: 53.4% – 58.6%
- Challenging locations: 32.0% – 49.0%
- Explore Eye Care Center neighborhoods in San Francisco →
15. Baltimore Metro: Baltimore-Columbia-Towson, MD
- Best locations: 63.7% – 73.0%
- Average locations: 53.0% – 58.2%
- Challenging locations: 30.0% – 48.3%
- Explore Eye Care Center neighborhoods in Baltimore →
16. Washington DC Metro: Washington-Arlington-Alexandria, DC-VA-MD-WV
- Best locations: 64.1% – 74.0%
- Average locations: 53.1% – 58.2%
- Challenging locations: 31.0% – 48.6%
- Explore Eye Care Center neighborhoods in Washington DC →
17. Minneapolis Metro: Minneapolis-St. Paul-Bloomington, MN-WI
- Best locations: 65.0% – 76.0%
- Average locations: 52.6% – 58.4%
- Challenging locations: 28.0% – 47.6%
- Explore Eye Care Center neighborhoods in Minneapolis →
18. Seattle Metro: Seattle-Tacoma-Bellevue, WA
- Best locations: 63.9% – 74.0%
- Average locations: 52.3% – 57.8%
- Challenging locations: 28.0% – 47.3%
- Explore Eye Care Center neighborhoods in Seattle →
19. Boston Metro: Boston-Cambridge-Newton, MA-NH
- Best locations: 64.3% – 75.0%
- Average locations: 52.5% – 57.9%
- Challenging locations: 30.0% – 47.9%
- Explore Eye Care Center neighborhoods in Boston →
20. Detroit Metro: Detroit-Warren-Dearborn, MI
- Best locations: 64.2% – 75.0%
- Average locations: 52.2% – 57.8%
- Challenging locations: 29.0% – 47.5%
- Explore Eye Care Center neighborhoods in Detroit →
21. Chicago Metro: Chicago-Naperville-Elgin, IL-IN
- Best locations: 66.3% – 80.0%
- Average locations: 52.0% – 58.1%
- Challenging locations: 29.0% – 47.3%
- Explore Eye Care Center neighborhoods in Chicago →
22. New York City Metro: New York-Newark-Jersey City, NY-NJ
- Best locations: 65.4% – 78.0%
- Average locations: 51.8% – 57.8%
- Challenging locations: 28.0% – 47.0%
- Explore Eye Care Center neighborhoods in New York City →
23. Miami Metro: Miami-Fort Lauderdale-West Palm Beach, FL
- Best locations: 65.5% – 79.0%
- Average locations: 51.5% – 57.4%
- Challenging locations: 30.0% – 47.1%
- Explore Eye Care Center neighborhoods in Miami →
24. Philadelphia Metro: Philadelphia-Camden-Wilmington, PA-NJ-DE-MD
- Best locations: 65.3% – 79.0%
- Average locations: 50.8% – 57.0%
- Challenging locations: 27.0% – 45.9%
- Explore Eye Care Center neighborhoods in Philadelphia →
What the Data Reveals
| Signal | Where strong-survivability cities outperform | What drags weaker cities down |
|---|---|---|
| Market size vs saturation | Mid-sized metros with established demand but room for new entrants — under-served pockets in 1.5M–5M population markets. | Either tier-1 cities saturated with national chains, or thin markets under 500K population where demand can't sustain a category. |
| Cross-subtype clustering | Cities where the subtype clusters near complementary categories (e.g., coffee shops near coworking + gyms). | Cities where the subtype is dispersed across isolated storefronts without supporting foot-traffic. |
| BLS QCEW retail employment trend | Cities with positive 3-year retail employment growth — proxy for local demand expansion. | Cities showing flat or declining retail employment over the same window. |
Wide variation between cities: The difference between the #1 city (Dallas at 63.1%) and the #24 city (Philadelphia at 54.0%) is 9.1 percentage points. City-selection impact for Eye Care Centers is evident in the 3.1-point difference between Dallas and San Antonio — operators who optimize location stand to gain a meaningful survivability edge.
Where this ranking confirms the conventional wisdom
Challenging markets: 22 cities fall below 60% survivability, suggesting more difficult market conditions.
National average: Across all 24 analyzed cities, the average survivability for an Eye Care Center is 57.0%.
What Makes These Cities Stand Out?
The top-ranked cities share several characteristics that favor Eye Care Centers:
- Strong survivability signals: Dallas leads with a 63% average survivability score for Eye Care Centers — significantly above the national average for this business category.
- Competition density: The top cities show favorable competitor-to-opportunity ratios for Eye Care Centers, meaning lower saturation and higher odds of capturing an underserved customer base.
- Economic conditions: All top-ranked cities show strong median household incomes and low vacancy rates in the neighborhoods where Eye Care Centers perform best.
- Supply chain access: Cities at the top of this ranking benefit from mature supplier networks for this category, reducing operating costs and inventory lead times.
StreetSpring's AI models reveal the survivability of businesses in every major U.S. neighborhood, giving agents and entrepreneurs a trusted way to see their future success before opening day. The analysis behind these rankings spans millions of data points across competition, spending, and mobility. Our proprietary models incorporate data sources not available through any public platform.
Neighborhood-Level Winners in Every Tier
City-level averages mask significant within-city variation. Below are some of the strongest neighborhoods for Eye Care Center at different points in the rankings:
Denver — ranked #13 of 24 — a middle-of-the-pack national market
- Parker (54% survivability)
- Bear-Valley (47% survivability)
See full neighborhood rankings for Denver →
City-level scores aggregate hundreds of neighborhoods. The right neighborhood matters more than the city's headline rank.
Visual Data
Related Resources
City-specific guides: For detailed neighborhood-level analysis, explore our city guides:
- Survivability Rankings for Eye Care Center in Dallas
- Business Survivability Rankings: Dallas
- Survivability Rankings for Eye Care Center in San Antonio
- Business Survivability Rankings: San Antonio
- Survivability Rankings for Eye Care Center in Charlotte
- Business Survivability Rankings: Charlotte
- Survivability Rankings for Eye Care Center in Portland
- Business Survivability Rankings: Portland
- Survivability Rankings for Eye Care Center in St Louis
- Business Survivability Rankings: St Louis
National guides:
- National Neighborhood Survivability Rankings for Eye Care Centers
- Neighborhood Survivability Rankings: Dallas
When does StreetSpring refresh the city rankings?
Rankings are updated quarterly. The current data reflects StreetSpring's 2026 analysis, with the next full dataset refresh scheduled for Q3 2026. As market conditions shift across major metros, individual city scores can move meaningfully between updates — particularly for Eye Care Centers, where local competition density and consumer spending patterns respond quickly to new entrants and neighborhood change. For the most current score at any specific address, use StreetSpring's live survivability tool rather than the static ranking above.
What about cities outside the top 10 — can Eye Care Centers thrive there?
Yes — our top 10 ranking reflects cities with the strongest average conditions, but lower-ranked metros can still contain exceptional individual neighborhoods. Many operators successfully open Eye Care Centers in cities that don't appear in our top 10. Eye Care Centers in particular can find strong performance in secondary markets where the right demographic concentration, household income, and limited direct competition within walking distance align — even outside our highest-ranked cities. StreetSpring's neighborhood-level data surfaces these pockets of opportunity in every city we analyze, regardless of where the city as a whole ranks nationally.
What tools can help me choose the right city for an Eye Care Center?
StreetSpring's Survivability Score tool provides address-level predictions for Eye Care Centers across all 24 metros we track. For this category specifically, the tool surfaces competition density, consumer spending index for Eye Care Centers, and commercial vacancy rates — the factors that most consistently predict whether an Eye Care Center will still be operating after two years. You can check any specific address before signing a lease and compare multiple neighborhoods side by side to identify the highest-survivability site within your target city.
Try the Survivability Score tool →
Which US city has the best survivability for Eye Care Centers?
Dallas ranks as the #1 city in the US for Eye Care Centers survivability in StreetSpring's 2026 analysis, with an average score of 63%. This means that across well-selected neighborhoods in Dallas, an Eye Care Center has approximately a 63% chance of still operating after two years — above the national average for this category. San Antonio ranks second, followed by Charlotte. The full ranking reflects data across 24 major US metro areas — see the complete list above for all scores and neighborhood-level links.
Last reviewed: April 29, 2026 by Bobby Koons, StreetSpring founder — updated weekly
Technical note: Aggregated national survivability rankings across all 24 metros are available in machine-readable format for research and integration purposes.
StreetSpring recalculates survivability using the latest competitive, demographic, and walkability data, so the live score may differ from the static ranges shown here.
Methodology: City rankings aggregate neighborhood-level Survivability Scores (max, average, and min) across all analyzed neighborhoods in each metro area. Rankings reflect average conditions but do not account for variation within cities. Coverage includes 24 major US metropolitan areas: Dallas, San Antonio, Charlotte, Portland, St Louis, Orlando, Tampa Bay, San Diego, Houston, Phoenix, Atlanta, Los Angeles, Denver, San Francisco, Baltimore, Washington DC, Minneapolis, Seattle, Boston, Detroit, Chicago, New York City, Miami, Philadelphia.