National Neighborhood Survivability Rankings for Diner
StreetSpring's 2026 nationwide analysis ranks the top neighborhoods across all major US cities for Diners. See which neighborhoods offer the highest Survivability Scores.
Tysons (Washington DC) ranks #1 nationally for Diner survivability in 2026, with a 95% chance of success for new entrants. The top 25 neighborhoods nationwide span 5 different cities, demonstrating that exceptional opportunities for Diners exist across diverse markets. Rankings like this are a strong starting point, but the live survivability score in StreetSpring will reflect the most current competitor data for your exact address.
To understand the methodology behind these rankings, see our detailed guide: Survivability Score: How We Calculate It & Why It Matters.
Last reviewed: May 18, 2026 by Bobby Koons, StreetSpring founder — updated weekly
Quick Summary
- #1 Neighborhood: Tysons, Washington DC — 95% survivability for Diner
- Neighborhoods analyzed: 1426 across 24 major US cities
- National average survivability: 80.9% for Diners
- Top-25 average: 91.5% — 10.6% above national average
- Data current as of: 2026 · Full methodology →
Table of Contents
- How neighborhoods compare nationwide
- Top 25 neighborhoods in the US
- Geographic patterns
- How to use this ranking
- Related resources
- Frequently asked questions
How neighborhoods rank nationwide for Diners
Analyzing 1426 neighborhoods across 24 major US cities, StreetSpring's 2026 data shows that the best neighborhoods for Diners significantly outperform average locations, with the top 25 neighborhoods nationwide averaging 91.5% survivability compared to the national neighborhood average of 80.9%.
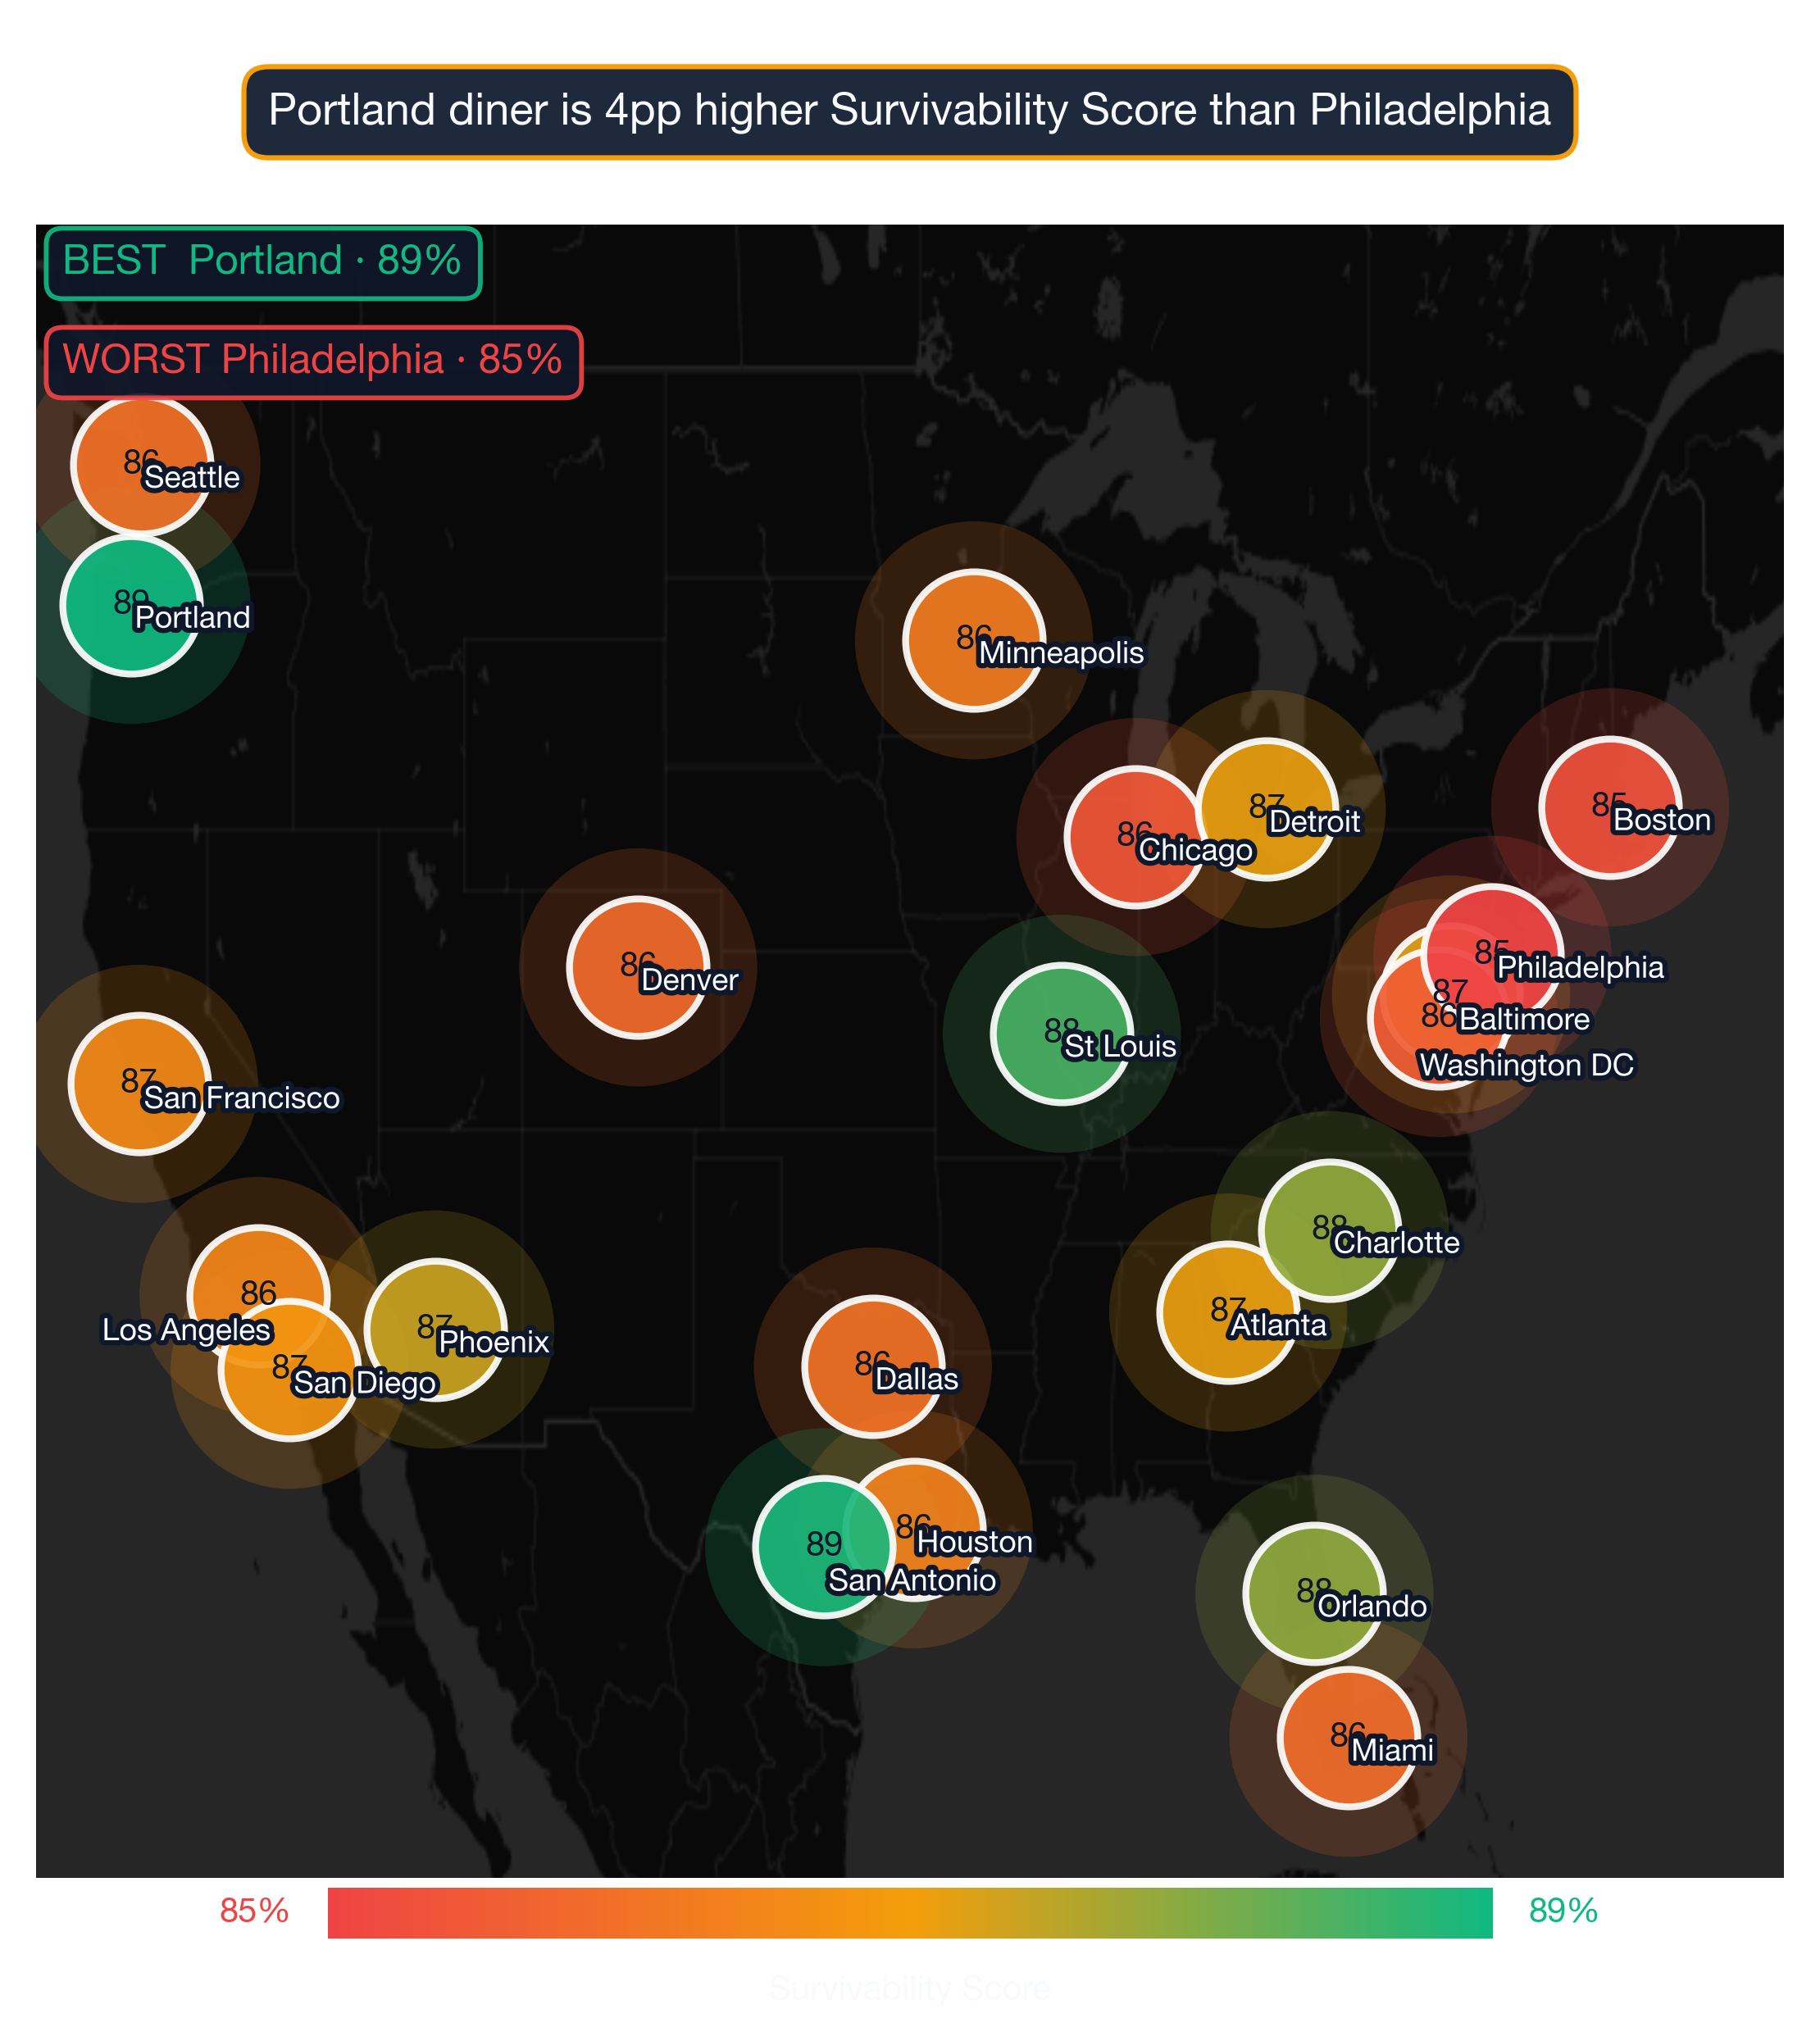
How median scores differ city to city
This 10.6% advantage illustrates how critical neighborhood selection is — choosing a top-tier neighborhood versus an average one can significantly increase your long-term survival chances.
Why some metros dominate this business's leaderboard
What separates the top neighborhoods for Diners from the national average is not simply higher foot traffic — it is a favorable ratio of consumer spending on this category to competitive supply. The 10.6% advantage that top neighborhoods hold is built on structural conditions: the right consumer demographics, manageable competition density, and mobility patterns that route target customers past the storefront. Our analysis covers businesses serving the 24 largest metros in America.
Importantly, top-performing neighborhoods aren't concentrated in just a few cities. The top 25 neighborhoods represent 5 different cities. This means entrepreneurs focused on Diners can find exceptional opportunities across the United States, not just in traditionally strong markets.
Location is the biggest factor in a business's future success.
Top US neighborhoods to open a Diner
| Signal | Top-quartile neighborhood pattern | Bottom-quartile neighborhood pattern |
|---|---|---|
| Subtype-specific density saturation | Neighborhoods with the subtype below the optimal density curve — room for a new entrant without cannibalizing demand. | Neighborhoods at or past the saturation point for the subtype, where new entrants face zero-sum competition. |
| Commercial rent-to-revenue ratio | Neighborhoods where commercial $/sqft fits the subtype's revenue-per-sqft economics with margin. | Neighborhoods where rent inflation has outrun revenue growth — operators paying lifestyle rents. |
| Storefront vacancy + churn signal | Neighborhoods with low recent vacancy and steady operator continuity in similar subtypes. | Neighborhoods with elevated commercial vacancy or repeated tenant turnover in the same storefronts. |
Why these neighborhoods rank highest
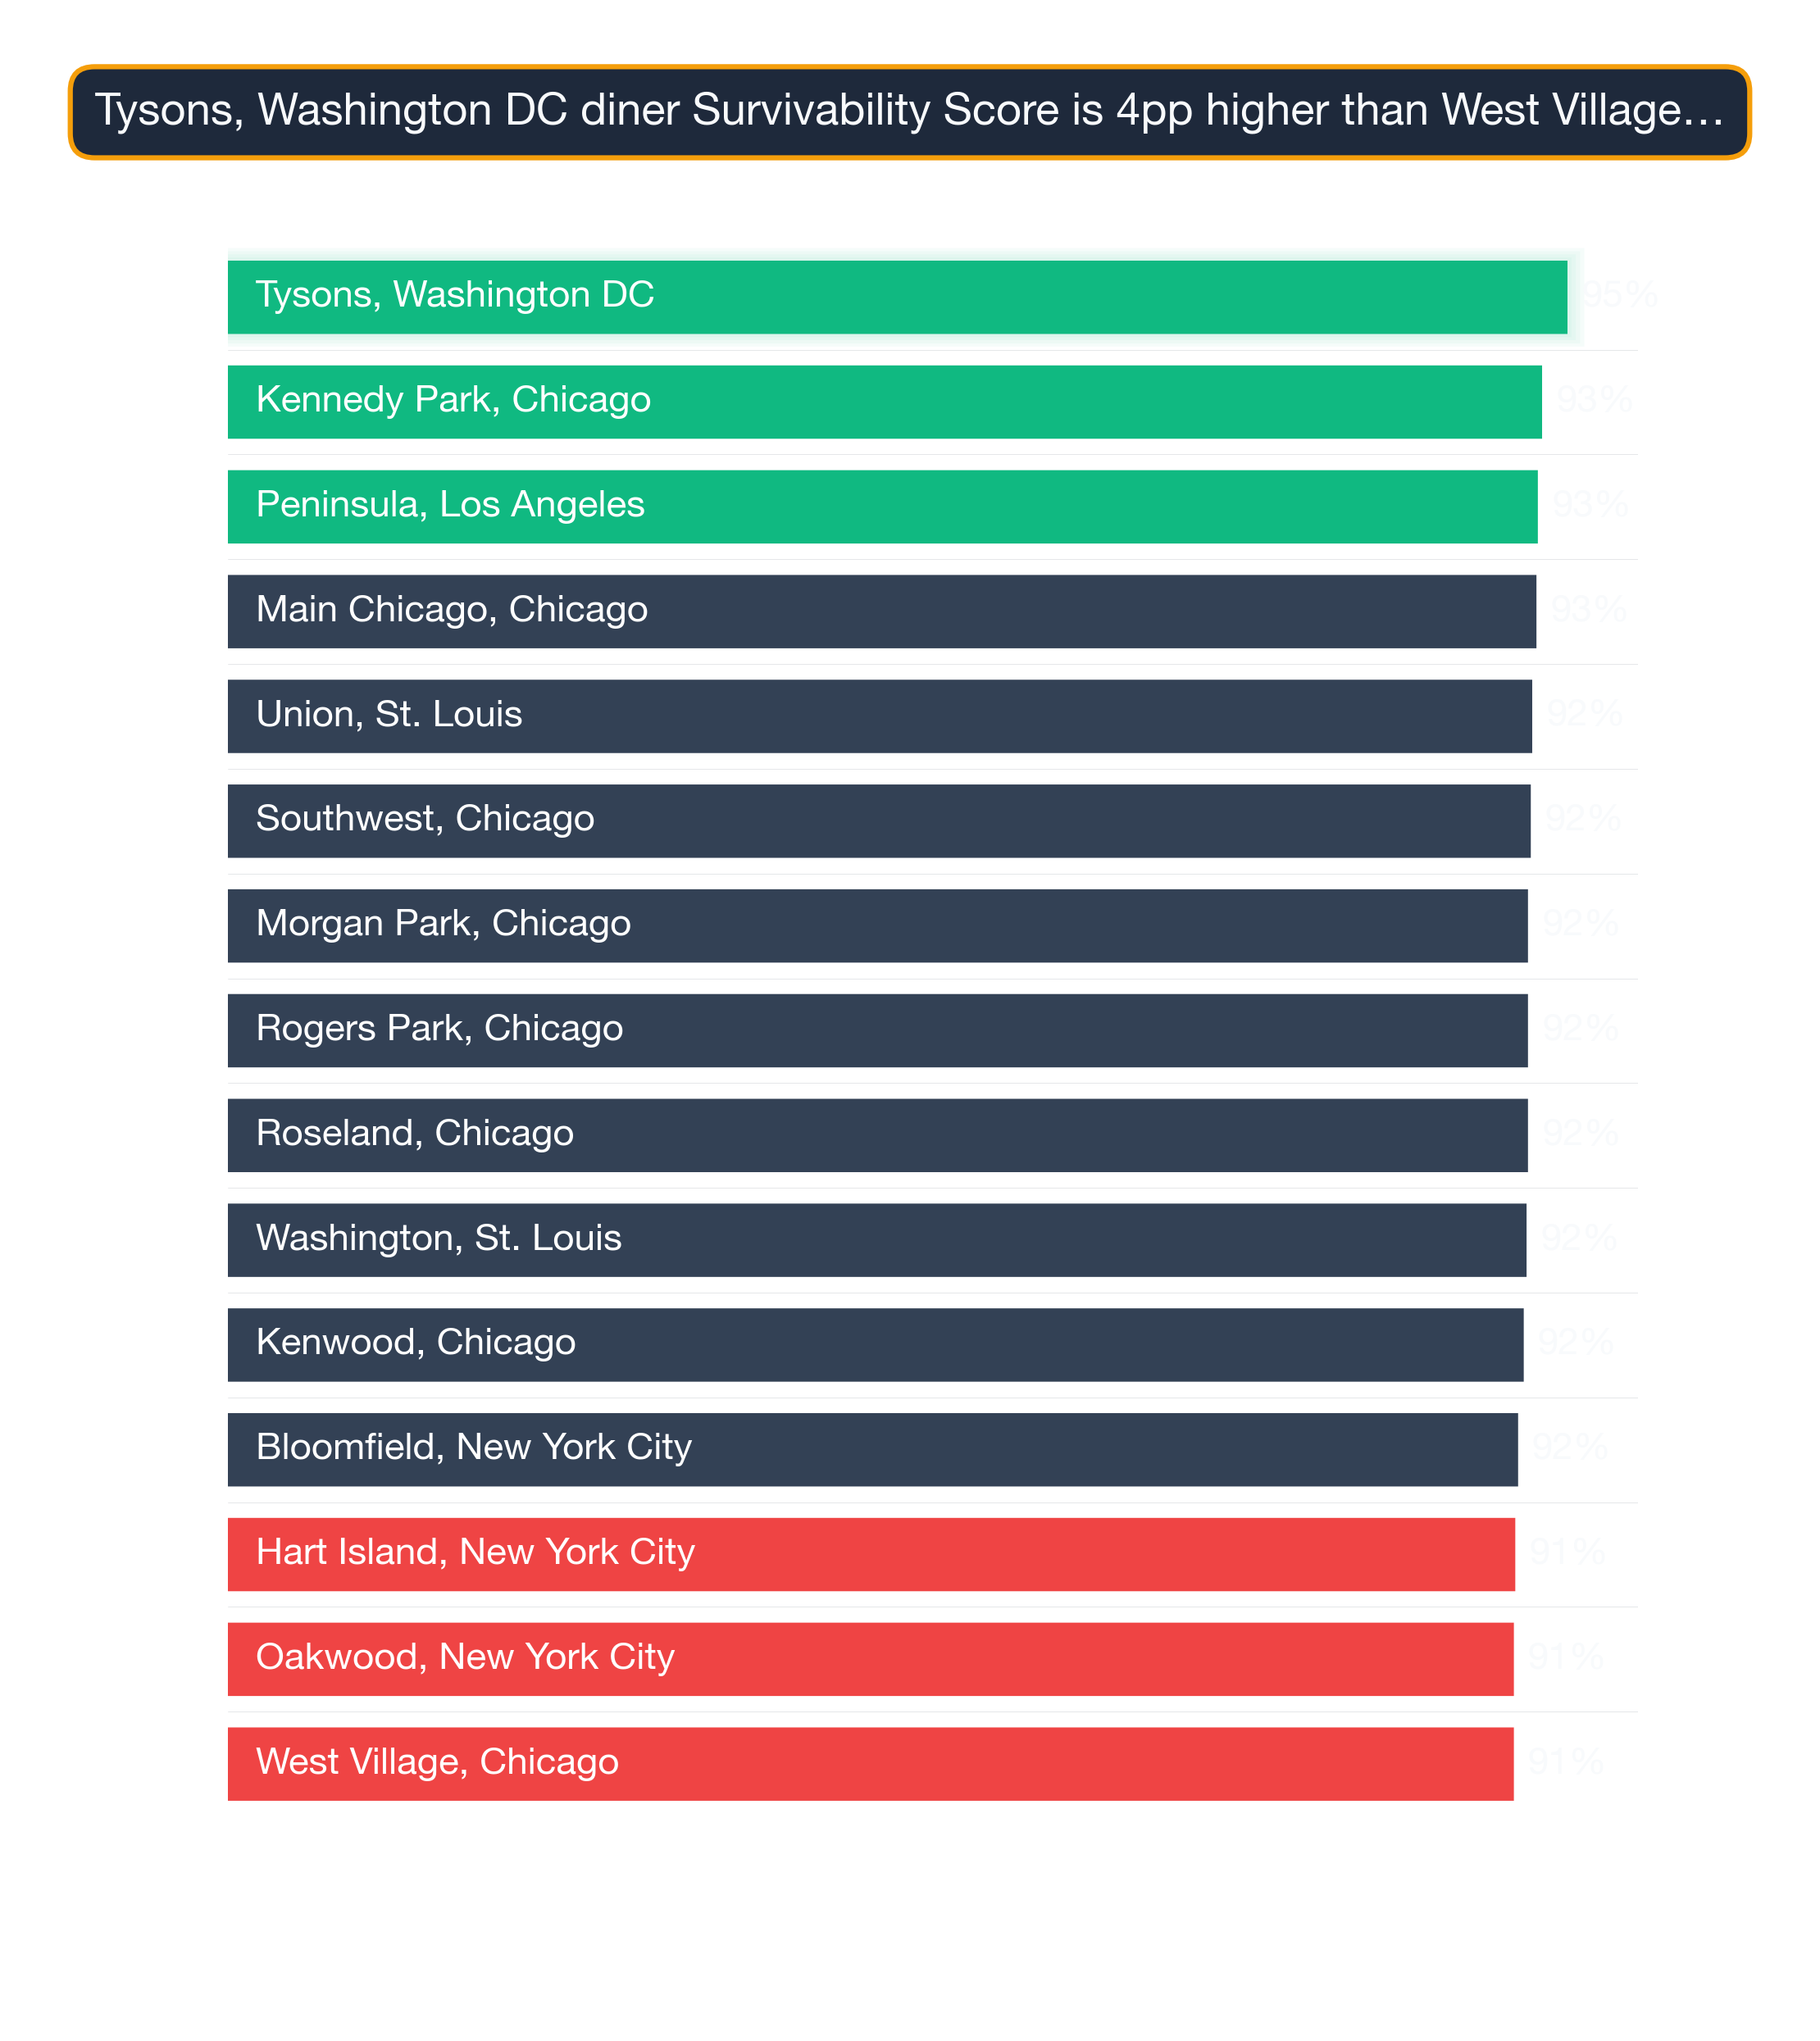
Survivability range for top, middle, and last-ranked neighborhoods. Box = best-to-challenging range; white line = average. Tysons, Washington DC leads at 95% in 2026. Full methodology →
The top 25 neighborhoods nationwide for Diners are:
| # | Neighborhood | City | Avg Survival | Tier | Best Locations | Challenging Locations |
|---|---|---|---|---|---|---|
| 1 | Tysons | Washington DC | 95.0% | Great | 97.0% | 93.2% |
| 2 | Kennedy Park | Chicago | 93.2% | Great | 95.3% | 91.4% |
| 3 | Peninsula | Los Angeles | 92.9% | Great | 95.0% | 91.1% |
| 4 | Main-Chicago | Chicago | 92.8% | Great | 95.0% | 91.0% |
| 5 | Union | St. Louis | 92.5% | Great | 94.7% | 90.7% |
| 6 | Southwest | Chicago | 92.4% | Great | 94.6% | 90.6% |
| 7 | Rogers Park | Chicago | 92.2% | Great | 94.4% | 90.4% |
| 8 | Roseland | Chicago | 92.2% | Great | 94.4% | 90.4% |
| 9 | Morgan Park | Chicago | 92.2% | Great | 94.4% | 90.4% |
| 10 | Washington | St. Louis | 92.1% | Great | 94.2% | 90.2% |
| 11 | Kenwood | Chicago | 91.9% | Great | 94.0% | 90.0% |
| 12 | West Village | Chicago | 91.2% | Great | 93.4% | 89.4% |
| 13 | River North | Chicago | 91.1% | Great | 93.3% | 89.3% |
| 14 | Troy | St. Louis | 91.0% | Great | 93.2% | 89.2% |
| 15 | Margate Park | Chicago | 90.8% | Great | 92.9% | 88.9% |
| 16 | West Town | Chicago | 90.7% | Great | 92.8% | 88.9% |
| 17 | Noble Square | Chicago | 90.6% | Great | 92.8% | 88.8% |
| 18 | Wildwood | Chicago | 90.5% | Great | 92.7% | 88.7% |
| 19 | Mayfair | Chicago | 90.4% | Great | 92.6% | 88.6% |
| 20 | Andersonville | Chicago | 90.3% | Great | 92.5% | 88.5% |
| 21 | North Center | Chicago | 90.3% | Great | 92.4% | 88.4% |
| 22 | Cabrini Green | Chicago | 90.2% | Great | 92.4% | 88.4% |
| 23 | The Villa | Chicago | 90.2% | Great | 92.4% | 88.4% |
| 24 | Budlong Woods | Chicago | 90.2% | Great | 92.3% | 88.4% |
| 25 | Chestnut Hill | Philadelphia | 90.2% | Great | 92.3% | 88.3% |
Keep in mind that results depend heavily on the exact location; strong sites often exist within neighborhoods that seem less favorable overall.
For a full explanation of how survivability scores and ranges are calculated, see Survivability Score: How We Calculate It & Why It Matters.
What's true of every top-ranked US neighborhood
City Concentration
The top 25 neighborhoods span 5 different cities, with Chicago claiming 19 of the top spots (76%).
Breakdown of top 25 neighborhoods by city:
- Chicago: 19 neighborhoods (76% of top 25) — View city guide
- St. Louis: 3 neighborhoods (12% of top 25) — View city guide
- Washington DC: 1 neighborhood (4% of top 25) — View city guide
- Los Angeles: 1 neighborhood (4% of top 25) — View city guide
- Philadelphia: 1 neighborhood (4% of top 25) — View city guide
This distribution has practical implications for Diners operators: cities with multiple neighborhoods in the top 25 offer more site options within a single market, reducing relocation or expansion cost. Cities with a single top-25 neighborhood require more precise site selection — the advantage is concentrated in one area rather than spread across the metro.
Walkability vs. visibility — which wins?
The concentration of 19 top-ranked neighborhoods in Chicago (76% of the top 25) is notably high for this business category, suggesting that Chicago's market conditions — competitive density, consumer spending patterns, and demographic alignment — are unusually favorable for Diners. Operators targeting this category should treat Chicago neighborhoods as a primary focus before expanding to secondary markets.
How to apply this ranking when choosing where to open a Diner
While nationwide neighborhood rankings identify standout markets, address-level analysis reveals even greater variation. StreetSpring's AI models reveal the survivability of businesses in every major U.S. neighborhood, giving agents and entrepreneurs a trusted way to see their future success before opening day. Even within top-ranked neighborhoods, specific block selection can vary survivability by 10–20 percentage points.
For the most accurate assessment:
- Consider neighborhoods in the top 25 as strong starting points
- Examine city-specific guides for additional neighborhood options in your target markets
- Use StreetSpring's address-level tool to evaluate specific storefronts within these neighborhoods
- Factor in your budget, operational requirements, and target demographics
Each neighborhood has detailed analysis available through its city guide, providing block-by-block survivability data for Diners.
See also: Best Cities for Diner — our city-level comparison ranks which metros offer the strongest overall conditions for Diners.
Synergy Patterns: Subtypes That Cluster Together
Survivability isn't subtype-specific in isolation. Neighborhoods that work for Diners often work for related business types — here's the cross-subtype picture at different points in the Diner ranking:
Tysons, Washington DC — ranked #1 nationally — the strongest neighborhood for Diners (95% survivability for Diner) Other business types that thrive in Tysons:
- Georgian Restaurant (96% survivability)
- Veterinary Clinic (96% survivability)
- Portuguese Restaurant (96% survivability)
East-Somerville, Boston — ranked #714 of 1426 — a mid-ranked national neighborhood (80% survivability for Diner) Other business types that thrive in East-Somerville:
- Indonesian Restaurant (83% survivability)
- Italian Restaurant (83% survivability)
- Japanese / Sushi Restaurant (82% survivability)
Great-Lakes, Atlanta — ranked #1426 of 1426 — among the lower-ranked national neighborhoods (69% survivability for Diner) Other business types that thrive in Great-Lakes:
- Kosher Restaurant (82% survivability)
- Juice & Smoothie Bar (82% survivability)
- Tattoo & Piercing Shop (80% survivability)
When several subtypes score well in the same neighborhood, that's a stronger signal than any single subtype's score in isolation. Use both views.
Visual Data
Related Resources
Explore top cities represented in these neighborhoods:
- St. Louis: Best businesses and neighborhoods
- Philadelphia: Best businesses and neighborhoods
- Chicago: Best businesses and neighborhoods
- Washington DC: Best businesses and neighborhoods
- Los Angeles: Best businesses and neighborhoods
National city rankings: Best cities for Diners
Essential resources:
- How StreetSpring calculates Survivability Scores
- Site selection for landlords
- AI tools for tenant representatives
- StreetSpring vs competitors
Frequently Asked Questions
How do I interpret a survivability score?
A survivability score represents the estimated probability that a business of a specific type will still be operating at a given location after 2 years. A score of 80% means StreetSpring's model predicts an 80% chance of the business surviving past the 2-year mark at that address. Scores are calculated at the address level and reflect competitive density, consumer spending patterns, mobility data, and 80+ additional factors.
Are the best neighborhoods for Diners in large cities or smaller markets?
The top neighborhoods for Diners in StreetSpring's 2026 dataset are concentrated in 5 cities in the current dataset. As coverage expands, this breakdown may shift. The fundamental driver is the competitive-to-spending ratio at the address level, which can favor strong locations in both large and smaller markets.
Are there good opportunities outside the top 25 neighborhoods?
Absolutely. Our analysis covers 1426 neighborhoods across 24 cities. Many neighborhoods outside the top 25 have excellent individual locations for Diners. Neighborhood-level rankings reflect averages — specific addresses within any neighborhood can score well above or below the neighborhood mean. Use city-specific guides and StreetSpring's address-level tool to explore options beyond the top 25.
Which cities appear most frequently in the top 25 neighborhoods for Diners?
The cities most represented in the top 25 for Diners are Chicago (19), St. Louis (3), Washington DC (1). This concentration reflects the relative strength of consumer demand and competitive conditions for Diners in these markets. City-specific guides provide deeper analysis of each city's neighborhoods.
What makes Tysons in Washington DC the best neighborhood for Diners?
Tysons in Washington DC ranks #1 for Diners with 95% survivability. This reflects favorable competitive dynamics — fewer direct competitors relative to available consumer spending — strong demographic alignment with Diner customers, and local spending patterns that sustain this business category. StreetSpring's model weights these factors across all analyzed neighborhoods nationwide.
How does the national ranking for Diners compare to city-level rankings?
The national neighborhood ranking for Diners identifies the strongest neighborhoods across all 24 analyzed metros. City-level rankings provide a more granular view of the best neighborhoods within a specific city. In cases where a city has multiple neighborhoods in the national top 25, the city-level guide shows the full ranking of all neighborhoods in that market — including those outside the national top 25 that may still offer strong site-specific opportunities.
How often do neighborhood rankings change?
StreetSpring updates rankings quarterly as new data on business openings, closures, and market conditions becomes available. The current analysis reflects 2026 data. Because competitive conditions shift as new businesses enter or exit a neighborhood, the specific rankings for any given business type can shift between updates — which is why we recommend verifying specific addresses in StreetSpring's live tool before making a final site selection decision.
What type of neighborhood is best for opening a Diner?
The best neighborhoods for Diners share three characteristics: manageable competitive density (few existing direct competitors within the primary trade area), strong consumer spending on this category, and demographic alignment with the typical Diner customer base. In StreetSpring's 2026 data, the top-ranked neighborhoods for Diners combine these factors in a way that produces survivability scores well above the national average of 80.9%. Neighborhoods with dense existing competition or low category spending tend to score significantly lower, regardless of overall foot traffic or prestige.
Technical note: Aggregated national survivability rankings across all 24 metros are available in machine-readable format for research and integration purposes.
StreetSpring recalculates survivability using the latest competitive, demographic, and walkability data, so the live score may differ from the static ranges shown here.
Methodology: Neighborhood rankings are based on average Survivability Scores for Diners across all analyzed locations within each neighborhood. Rankings represent neighborhood-level conditions but do not account for block-by-block variation. Coverage includes 1426 neighborhoods across 24 major US cities.