National Neighborhood Survivability Rankings for Dance Club
StreetSpring's 2026 nationwide analysis ranks the top neighborhoods across all major US cities for Dance Clubs. See which neighborhoods offer the highest Survivability Scores.
Tysons (Washington DC) ranks #1 nationally for Dance Club survivability in 2026, with a 96% chance of success for new entrants. The top 25 neighborhoods nationwide span 5 different cities, demonstrating that exceptional opportunities for Dance Clubs exist across diverse markets. Our live tool reflects the latest competitive landscape — these static rankings may already be slightly out of date for rapidly changing markets.
To understand the methodology behind these rankings, see our detailed guide: Survivability Score: How We Calculate It & Why It Matters.
Reviewed and updated: May 13, 2026 — Bobby Koons, Founder & CEO, StreetSpring
Quick Summary
- #1 Neighborhood: Tysons, Washington DC — 96% survivability for Dance Club
- Neighborhoods analyzed: 1426 across 24 major US cities
- National average survivability: 80.7% for Dance Clubs
- Top-25 average: 91.0% — 10.3% above national average
- Data current as of: 2026 · Full methodology →
Table of Contents
- How neighborhoods compare nationwide
- Top 25 neighborhoods in the US
- Geographic patterns
- How to use this ranking
- Related resources
- Frequently asked questions
How do neighborhoods compare across the United States for Dance Clubs?
Analyzing 1426 neighborhoods across 24 major US cities, StreetSpring's 2026 data shows that the best neighborhoods for Dance Clubs significantly outperform average locations, with the top 25 neighborhoods nationwide averaging 91.0% survivability compared to the national neighborhood average of 80.7%.
This 10.3% advantage illustrates how critical neighborhood selection is — choosing a top-tier neighborhood versus an average one can significantly increase your long-term survival chances.
The consumer spending patterns that support Dance Clubs vary more by neighborhood than by city — which is why neighborhood-level analysis is particularly valuable for this business category. A 10.3% difference between top neighborhoods and the national average indicates that location selection has an above-average impact on outcomes for Dance Clubs compared to categories with narrower spreads. StreetSpring pinpoints the exact survival likelihood for hundreds of business types at a specific address.
Importantly, top-performing neighborhoods aren't concentrated in just a few cities. The top 25 neighborhoods represent 5 different cities. This means entrepreneurs focused on Dance Clubs can find exceptional opportunities across the United States, not just in traditionally strong markets.
Location is the single strongest predictor of whether a business thrives or fails.
What are the best neighborhoods in the United States to open a Dance Club?
| Signal | Top-quartile neighborhood pattern | Bottom-quartile neighborhood pattern |
|---|---|---|
| Storefront vacancy + churn signal | Neighborhoods with low recent vacancy and steady operator continuity in similar subtypes. | Neighborhoods with elevated commercial vacancy or repeated tenant turnover in the same storefronts. |
| Commercial rent-to-revenue ratio | Neighborhoods where commercial $/sqft fits the subtype's revenue-per-sqft economics with margin. | Neighborhoods where rent inflation has outrun revenue growth — operators paying lifestyle rents. |
| Subtype-specific density saturation | Neighborhoods with the subtype below the optimal density curve — room for a new entrant without cannibalizing demand. | Neighborhoods at or past the saturation point for the subtype, where new entrants face zero-sum competition. |
The shared traits across the top 10
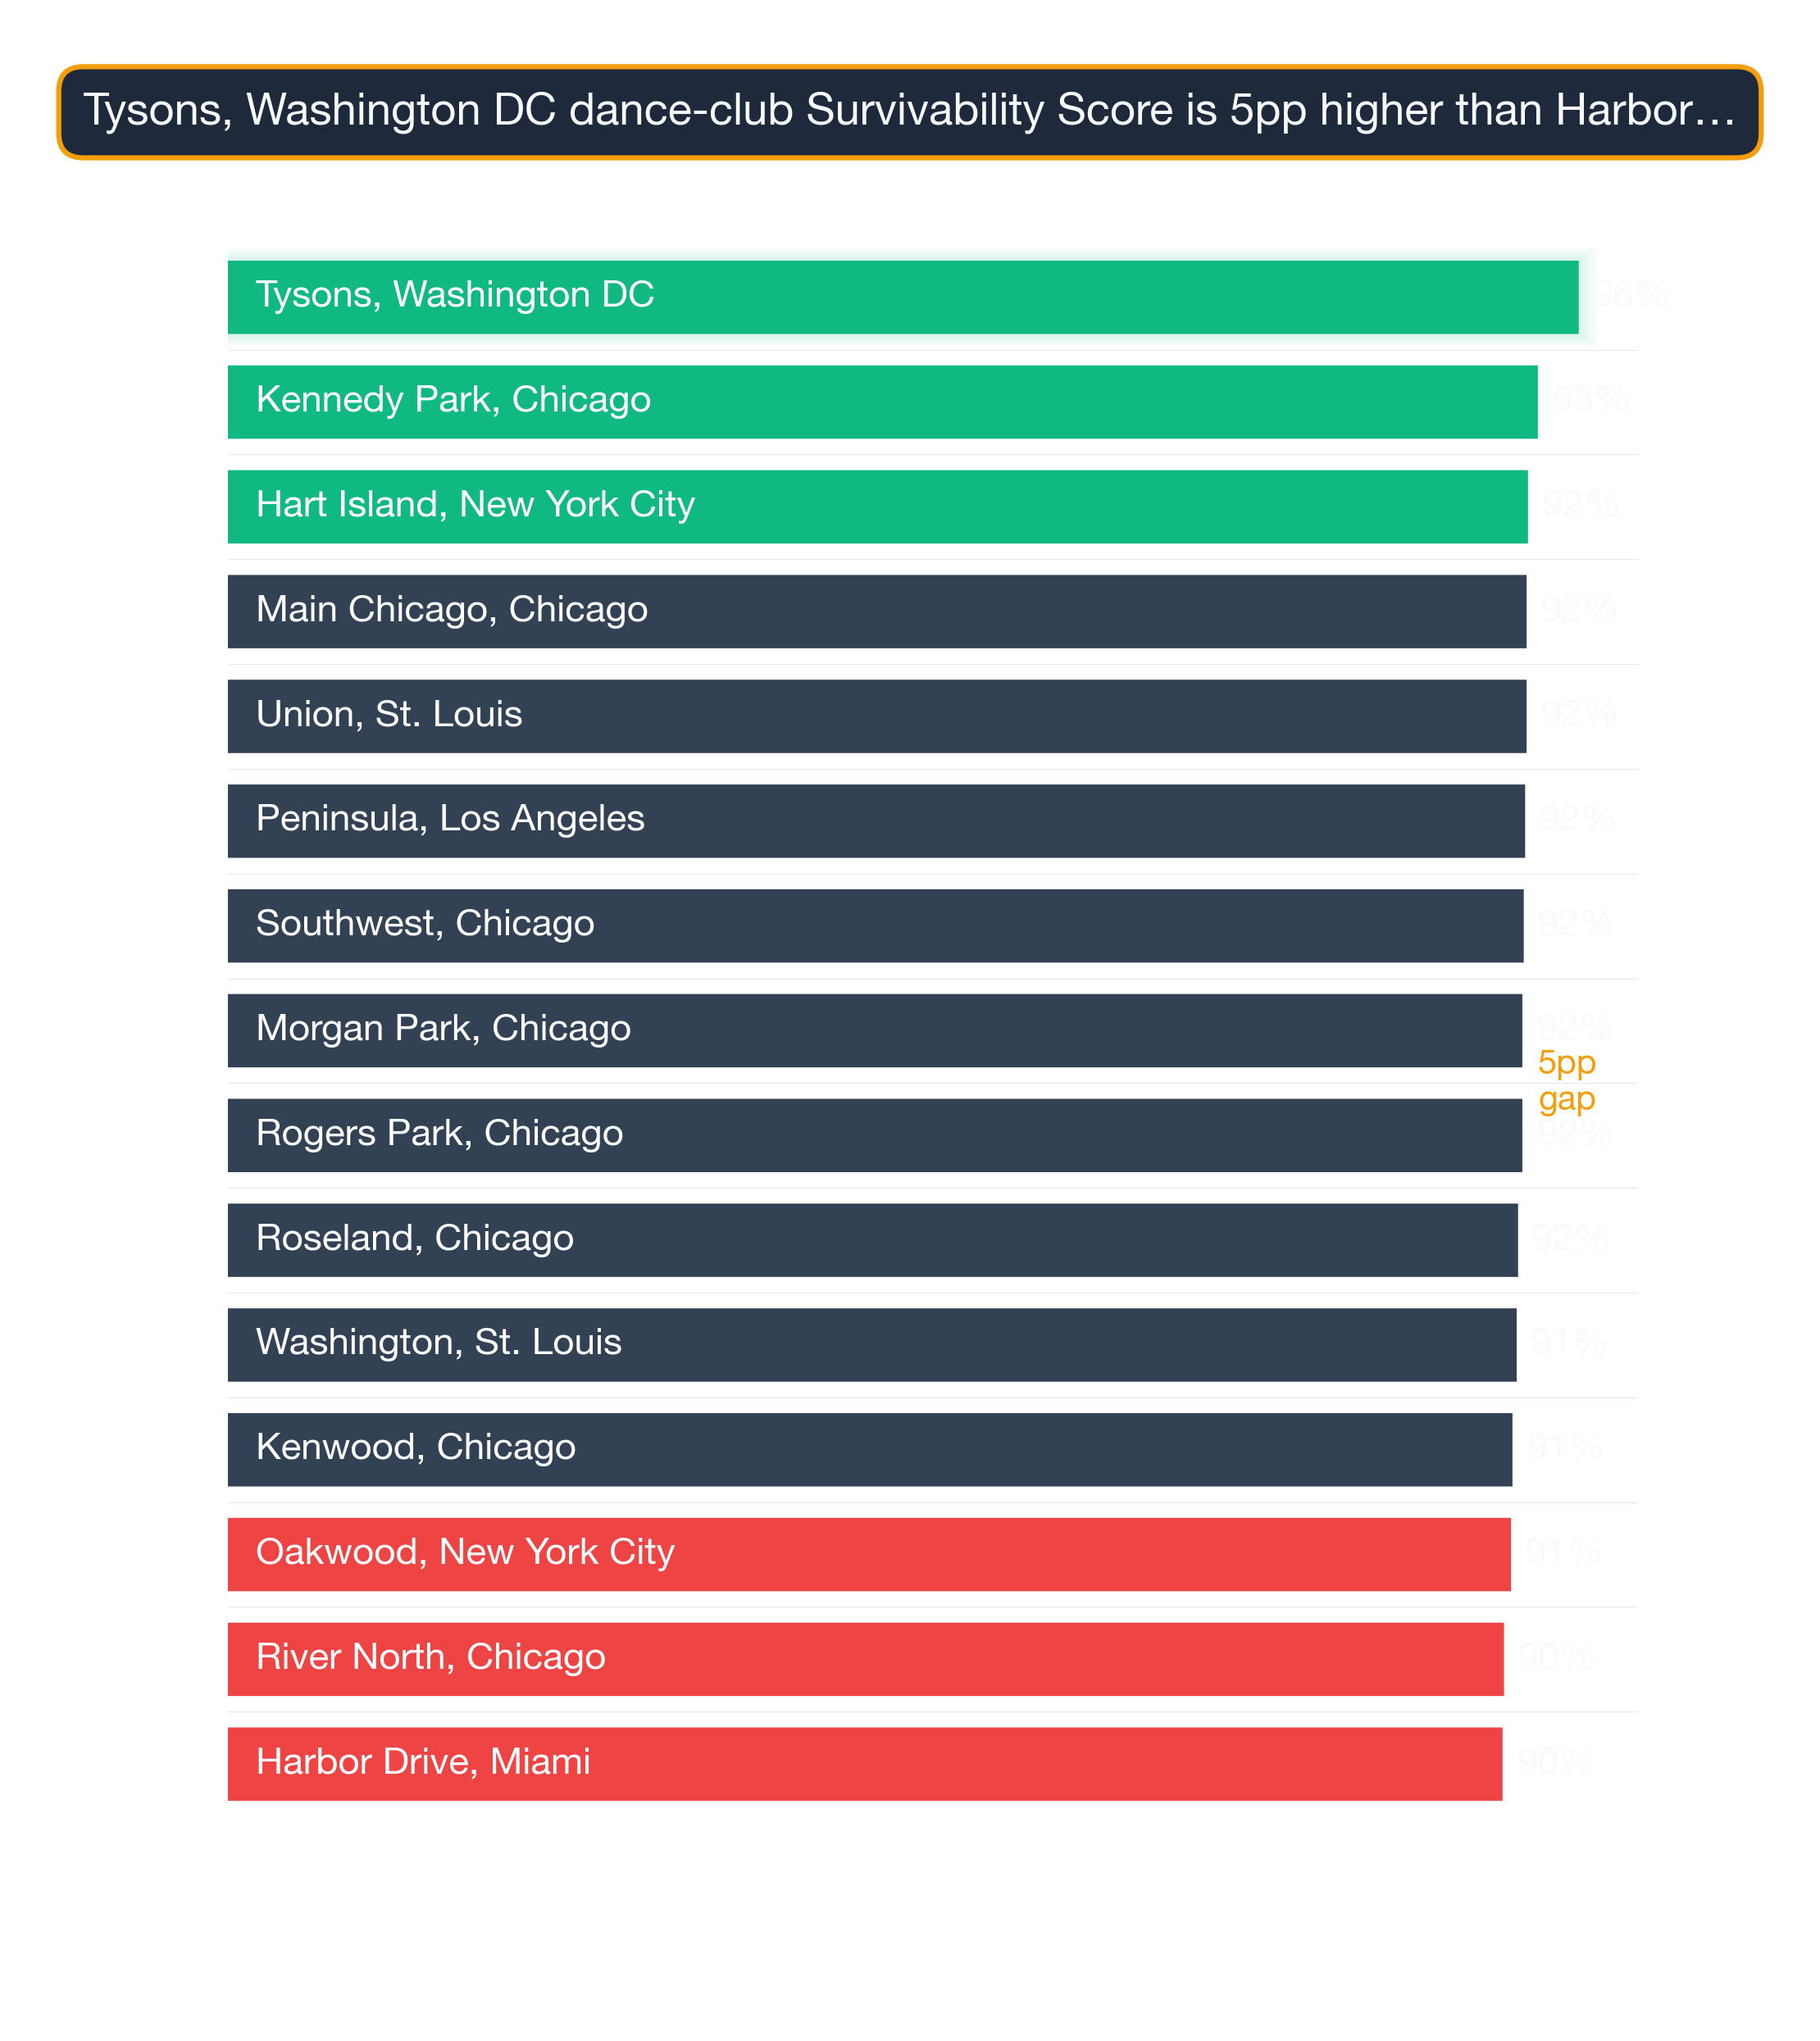
Survivability range for top, middle, and last-ranked neighborhoods. Box = best-to-challenging range; white line = average. Tysons, Washington DC leads at 96% in 2026. Full methodology →
The top 25 neighborhoods nationwide for Dance Clubs are:
| # | Neighborhood | City | Avg Survival | Tier | Best Locations | Challenging Locations |
|---|---|---|---|---|---|---|
| 1 | Tysons | Washington DC | 95.8% | Great | 97.0% | 93.5% |
| 2 | Kennedy Park | Chicago | 92.9% | Great | 94.8% | 90.6% |
| 3 | Main-Chicago | Chicago | 92.1% | Great | 94.0% | 89.8% |
| 4 | Union | St. Louis | 92.1% | Great | 94.0% | 89.8% |
| 5 | Peninsula | Los Angeles | 92.0% | Great | 93.9% | 89.7% |
| 6 | Southwest | Chicago | 91.9% | Great | 93.8% | 89.6% |
| 7 | Rogers Park | Chicago | 91.8% | Great | 93.7% | 89.5% |
| 8 | Morgan Park | Chicago | 91.8% | Great | 93.7% | 89.5% |
| 9 | Roseland | Chicago | 91.5% | Great | 93.4% | 89.2% |
| 10 | Washington | St. Louis | 91.4% | Great | 93.3% | 89.1% |
| 11 | Kenwood | Chicago | 91.1% | Great | 93.0% | 88.8% |
| 12 | River North | Chicago | 90.5% | Great | 92.4% | 88.2% |
| 13 | Troy | St. Louis | 90.4% | Great | 92.3% | 88.2% |
| 14 | Harbor Drive | Miami | 90.4% | Great | 92.3% | 88.1% |
| 15 | Margate Park | Chicago | 90.4% | Great | 92.3% | 88.1% |
| 16 | West Village | Chicago | 90.3% | Great | 92.2% | 88.0% |
| 17 | West Town | Chicago | 90.2% | Great | 92.1% | 87.9% |
| 18 | Noble Square | Chicago | 90.0% | Great | 91.9% | 87.8% |
| 19 | Wildwood | Chicago | 90.0% | Great | 91.9% | 87.7% |
| 20 | Mayfair | Chicago | 89.7% | Great | 91.6% | 87.4% |
| 21 | Andersonville | Chicago | 89.7% | Great | 91.6% | 87.4% |
| 22 | The Villa | Chicago | 89.7% | Great | 91.6% | 87.4% |
| 23 | Edgewater | Chicago | 89.6% | Great | 91.5% | 87.3% |
| 24 | Budlong Woods | Chicago | 89.6% | Great | 91.5% | 87.3% |
| 25 | Near North | Chicago | 89.6% | Great | 91.5% | 87.3% |
Survivability rankings at the neighborhood level describe typical conditions — any specific storefront may score higher or lower depending on its exact competitive environment.
For a full explanation of how survivability scores and ranges are calculated, see Survivability Score: How We Calculate It & Why It Matters.
Common signals across top-performing neighborhoods
City Concentration
The top 25 neighborhoods span 5 different cities, with Chicago claiming 19 of the top spots (76%).
Breakdown of top 25 neighborhoods by city:
- Chicago: 19 neighborhoods (76% of top 25) — View city guide
- St. Louis: 3 neighborhoods (12% of top 25) — View city guide
- Washington DC: 1 neighborhood (4% of top 25) — View city guide
- Los Angeles: 1 neighborhood (4% of top 25) — View city guide
- Miami: 1 neighborhood (4% of top 25) — View city guide
This distribution has practical implications for Dance Clubs operators: cities with multiple neighborhoods in the top 25 offer more site options within a single market, reducing relocation or expansion cost. Cities with a single top-25 neighborhood require more precise site selection — the advantage is concentrated in one area rather than spread across the metro.
Why some neighborhoods score high without being downtown
The concentration of 19 top-ranked neighborhoods in Chicago (76% of the top 25) is notably high for this business category, suggesting that Chicago's market conditions — competitive density, consumer spending patterns, and demographic alignment — are unusually favorable for Dance Clubs. Operators targeting this category should treat Chicago neighborhoods as a primary focus before expanding to secondary markets.
How to apply this ranking when choosing where to open a Dance Club
Use this ranking to shortlist neighborhoods, then drill down to specific addresses. StreetSpring's machine learning models identify the exact blocks and neighborhoods where specific business types consistently outperform — and the ones where they struggle. The difference between the best and worst blocks within a single top-ranked neighborhood can be as large as the gap between the #1 and #25 neighborhoods on this list.
For the most accurate assessment:
- Consider neighborhoods in the top 25 as strong starting points
- Examine city-specific guides for additional neighborhood options in your target markets
- Use StreetSpring's address-level tool to evaluate specific storefronts within these neighborhoods
- Factor in your budget, operational requirements, and target demographics
Each neighborhood has detailed analysis available through its city guide, providing block-by-block survivability data for Dance Clubs.
From national rank to your shortlist
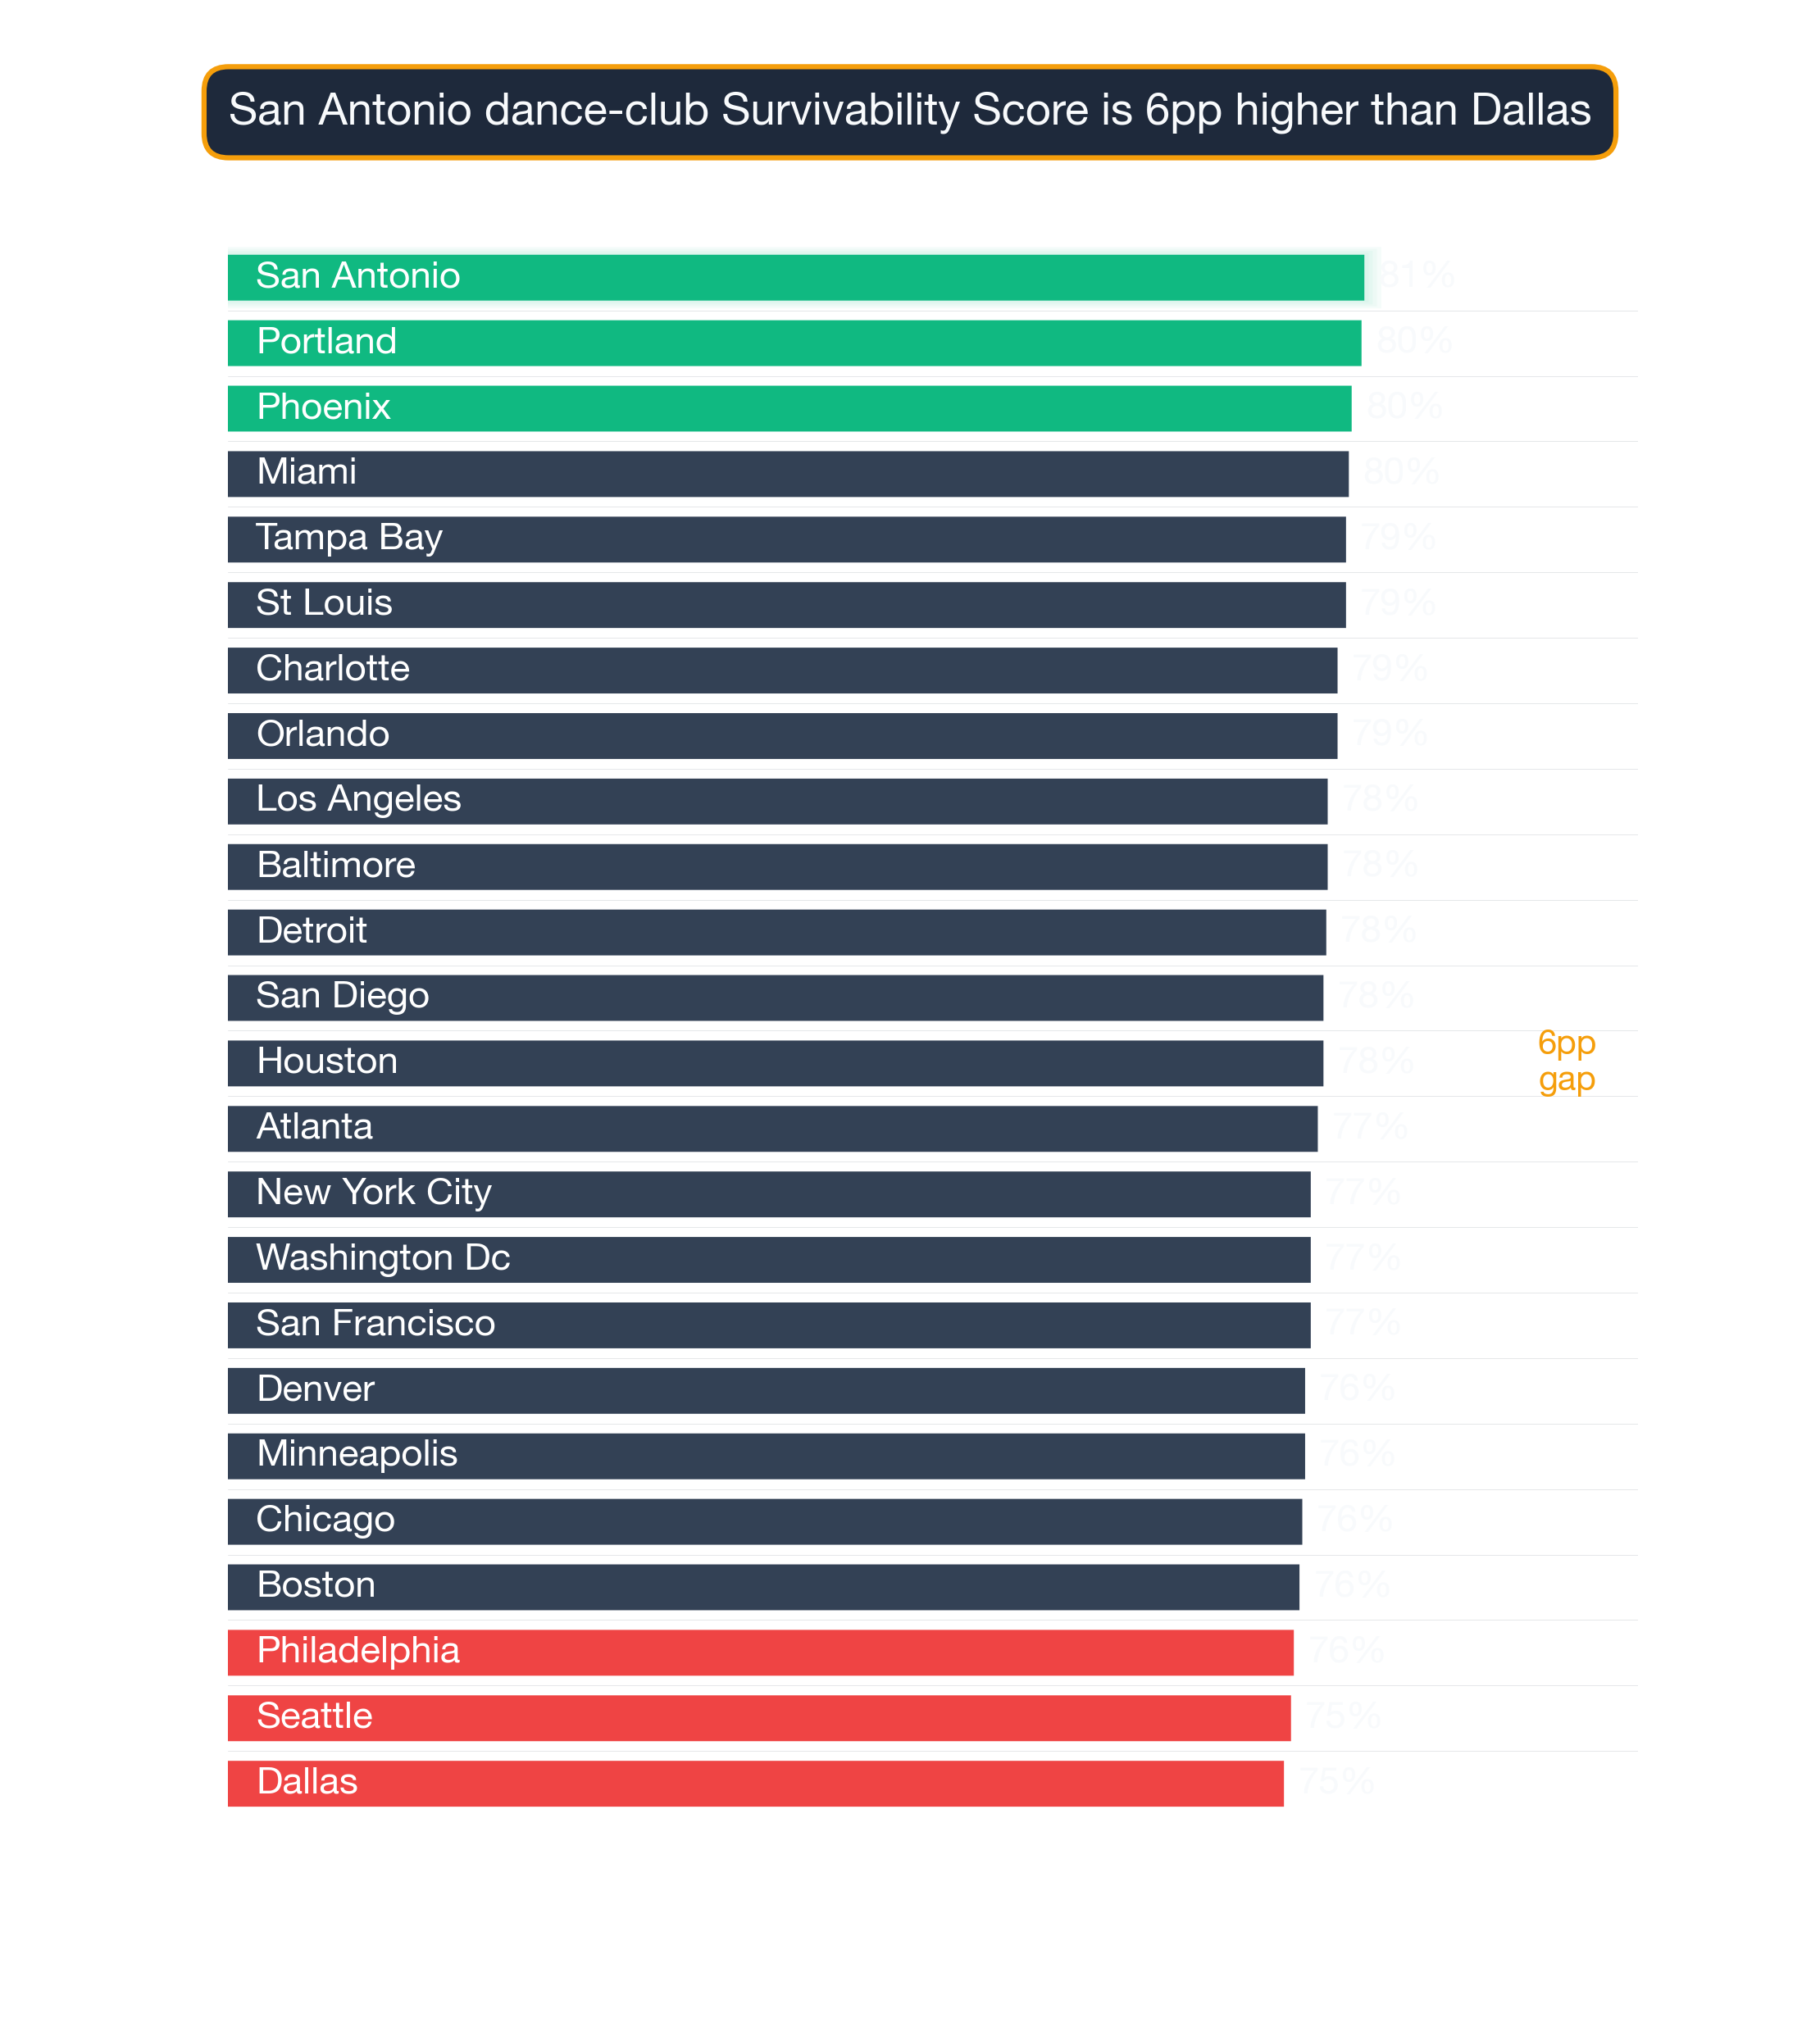
See also: Best Cities for Dance Club — our city-level comparison ranks which metros offer the strongest overall conditions for Dance Clubs.
Synergy Patterns: Subtypes That Cluster Together
Survivability isn't subtype-specific in isolation. Neighborhoods that work for Dance Clubs often work for related business types — here's the cross-subtype picture at different points in the Dance Club ranking:
Tysons, Washington DC — ranked #1 nationally — the strongest neighborhood for Dance Clubs (96% survivability for Dance Club) Other business types that thrive in Tysons:
- Georgian Restaurant (96% survivability)
- Veterinary Clinic (96% survivability)
- Portuguese Restaurant (96% survivability)
Great-Lakes, Atlanta — ranked #1426 of 1426 — among the lower-ranked national neighborhoods (69% survivability for Dance Club) Other business types that thrive in Great-Lakes:
- Kosher Restaurant (82% survivability)
- Juice & Smoothie Bar (82% survivability)
- Tattoo & Piercing Shop (80% survivability)
When several subtypes score well in the same neighborhood, that's a stronger signal than any single subtype's score in isolation. Use both views.
Visual Data
Related Resources
Explore top cities represented in these neighborhoods:
- St. Louis: Best businesses and neighborhoods
- Chicago: Best businesses and neighborhoods
- Miami: Best businesses and neighborhoods
- Washington DC: Best businesses and neighborhoods
- Los Angeles: Best businesses and neighborhoods
National city rankings: Best cities for Dance Clubs
Essential resources:
- How StreetSpring calculates Survivability Scores
- Site selection for landlords
- AI tools for tenant representatives
- StreetSpring vs competitors
Frequently Asked Questions
How should a landlord use this ranking when evaluating tenants for Dance Clubs?
Landlords can use this national neighborhood ranking to assess whether their property is in a location favorable to Dance Clubs — and by extension, how likely a Dance Club tenant is to maintain long-term occupancy. If your property is in one of the top 25 neighborhoods, Dance Clubs represent a strong tenant category. If not, StreetSpring's address-level tool will show the survivability score for your specific address and which tenant types score highest there.
How do I interpret a survivability score?
A survivability score represents the estimated probability that a business of a specific type will still be operating at a given location after 2 years. A score of 80% means StreetSpring's model predicts an 80% chance of the business surviving past the 2-year mark at that address. Scores are calculated at the address level and reflect competitive density, consumer spending patterns, mobility data, and 80+ additional factors.
Where can I download the underlying data?
The full national survivability dataset is available as a free download: https://streetspring.com/resources/data/national-survivability-scores-2026.csv. The CSV includes all business subtypes and neighborhoods covered in this analysis, licensed under CC BY 4.0.
What is the difference between city-level and neighborhood-level survivability rankings for Dance Clubs?
City-level rankings reflect average survivability for Dance Clubs across all neighborhoods in a given city — useful for identifying which cities offer the best overall conditions. Neighborhood-level rankings go deeper, showing which specific neighborhoods within those cities rank highest. StreetSpring's address-level tool adds a third layer, scoring individual storefronts within any neighborhood.
What makes Tysons in Washington DC the best neighborhood for Dance Clubs?
Tysons in Washington DC ranks #1 for Dance Clubs with 96% survivability. This reflects favorable competitive dynamics — fewer direct competitors relative to available consumer spending — strong demographic alignment with Dance Club customers, and local spending patterns that sustain this business category. StreetSpring's model weights these factors across all analyzed neighborhoods nationwide.
How can I compare specific addresses within these top neighborhoods?
StreetSpring's address-level tool allows you to input any commercial address and see predicted survivability for Dance Clubs. Even within the top-ranked neighborhoods, survivability varies meaningfully by block — address-level scoring is the most precise way to evaluate a specific site.
Are the best neighborhoods for Dance Clubs in large cities or smaller markets?
The top neighborhoods for Dance Clubs in StreetSpring's 2026 dataset are concentrated in 5 cities in the current dataset. As coverage expands, this breakdown may shift. The fundamental driver is the competitive-to-spending ratio at the address level, which can favor strong locations in both large and smaller markets.
What is the typical survivability range for Dance Clubs in top neighborhoods?
The top 25 neighborhoods nationwide for Dance Clubs average 91.0% survivability. The national average across all analyzed neighborhoods is 80.7%. The spread between top neighborhoods and the national average is 10.3% — representing the tangible survivability advantage of choosing a top-ranked location.
Technical note: Aggregated national survivability rankings across all 24 metros are available in machine-readable format for research and integration purposes.
StreetSpring recalculates survivability using the latest competitive, demographic, and walkability data, so the live score may differ from the static ranges shown here.
Methodology: Neighborhood rankings are based on average Survivability Scores for Dance Clubs across all analyzed locations within each neighborhood. Rankings represent neighborhood-level conditions but do not account for block-by-block variation. Coverage includes 1426 neighborhoods across 24 major US cities.