National Neighborhood Survivability Rankings for Convenience Store
StreetSpring's 2026 nationwide analysis ranks the top neighborhoods across all major US cities for Convenience Stores. See which neighborhoods offer the highest Survivability Scores.
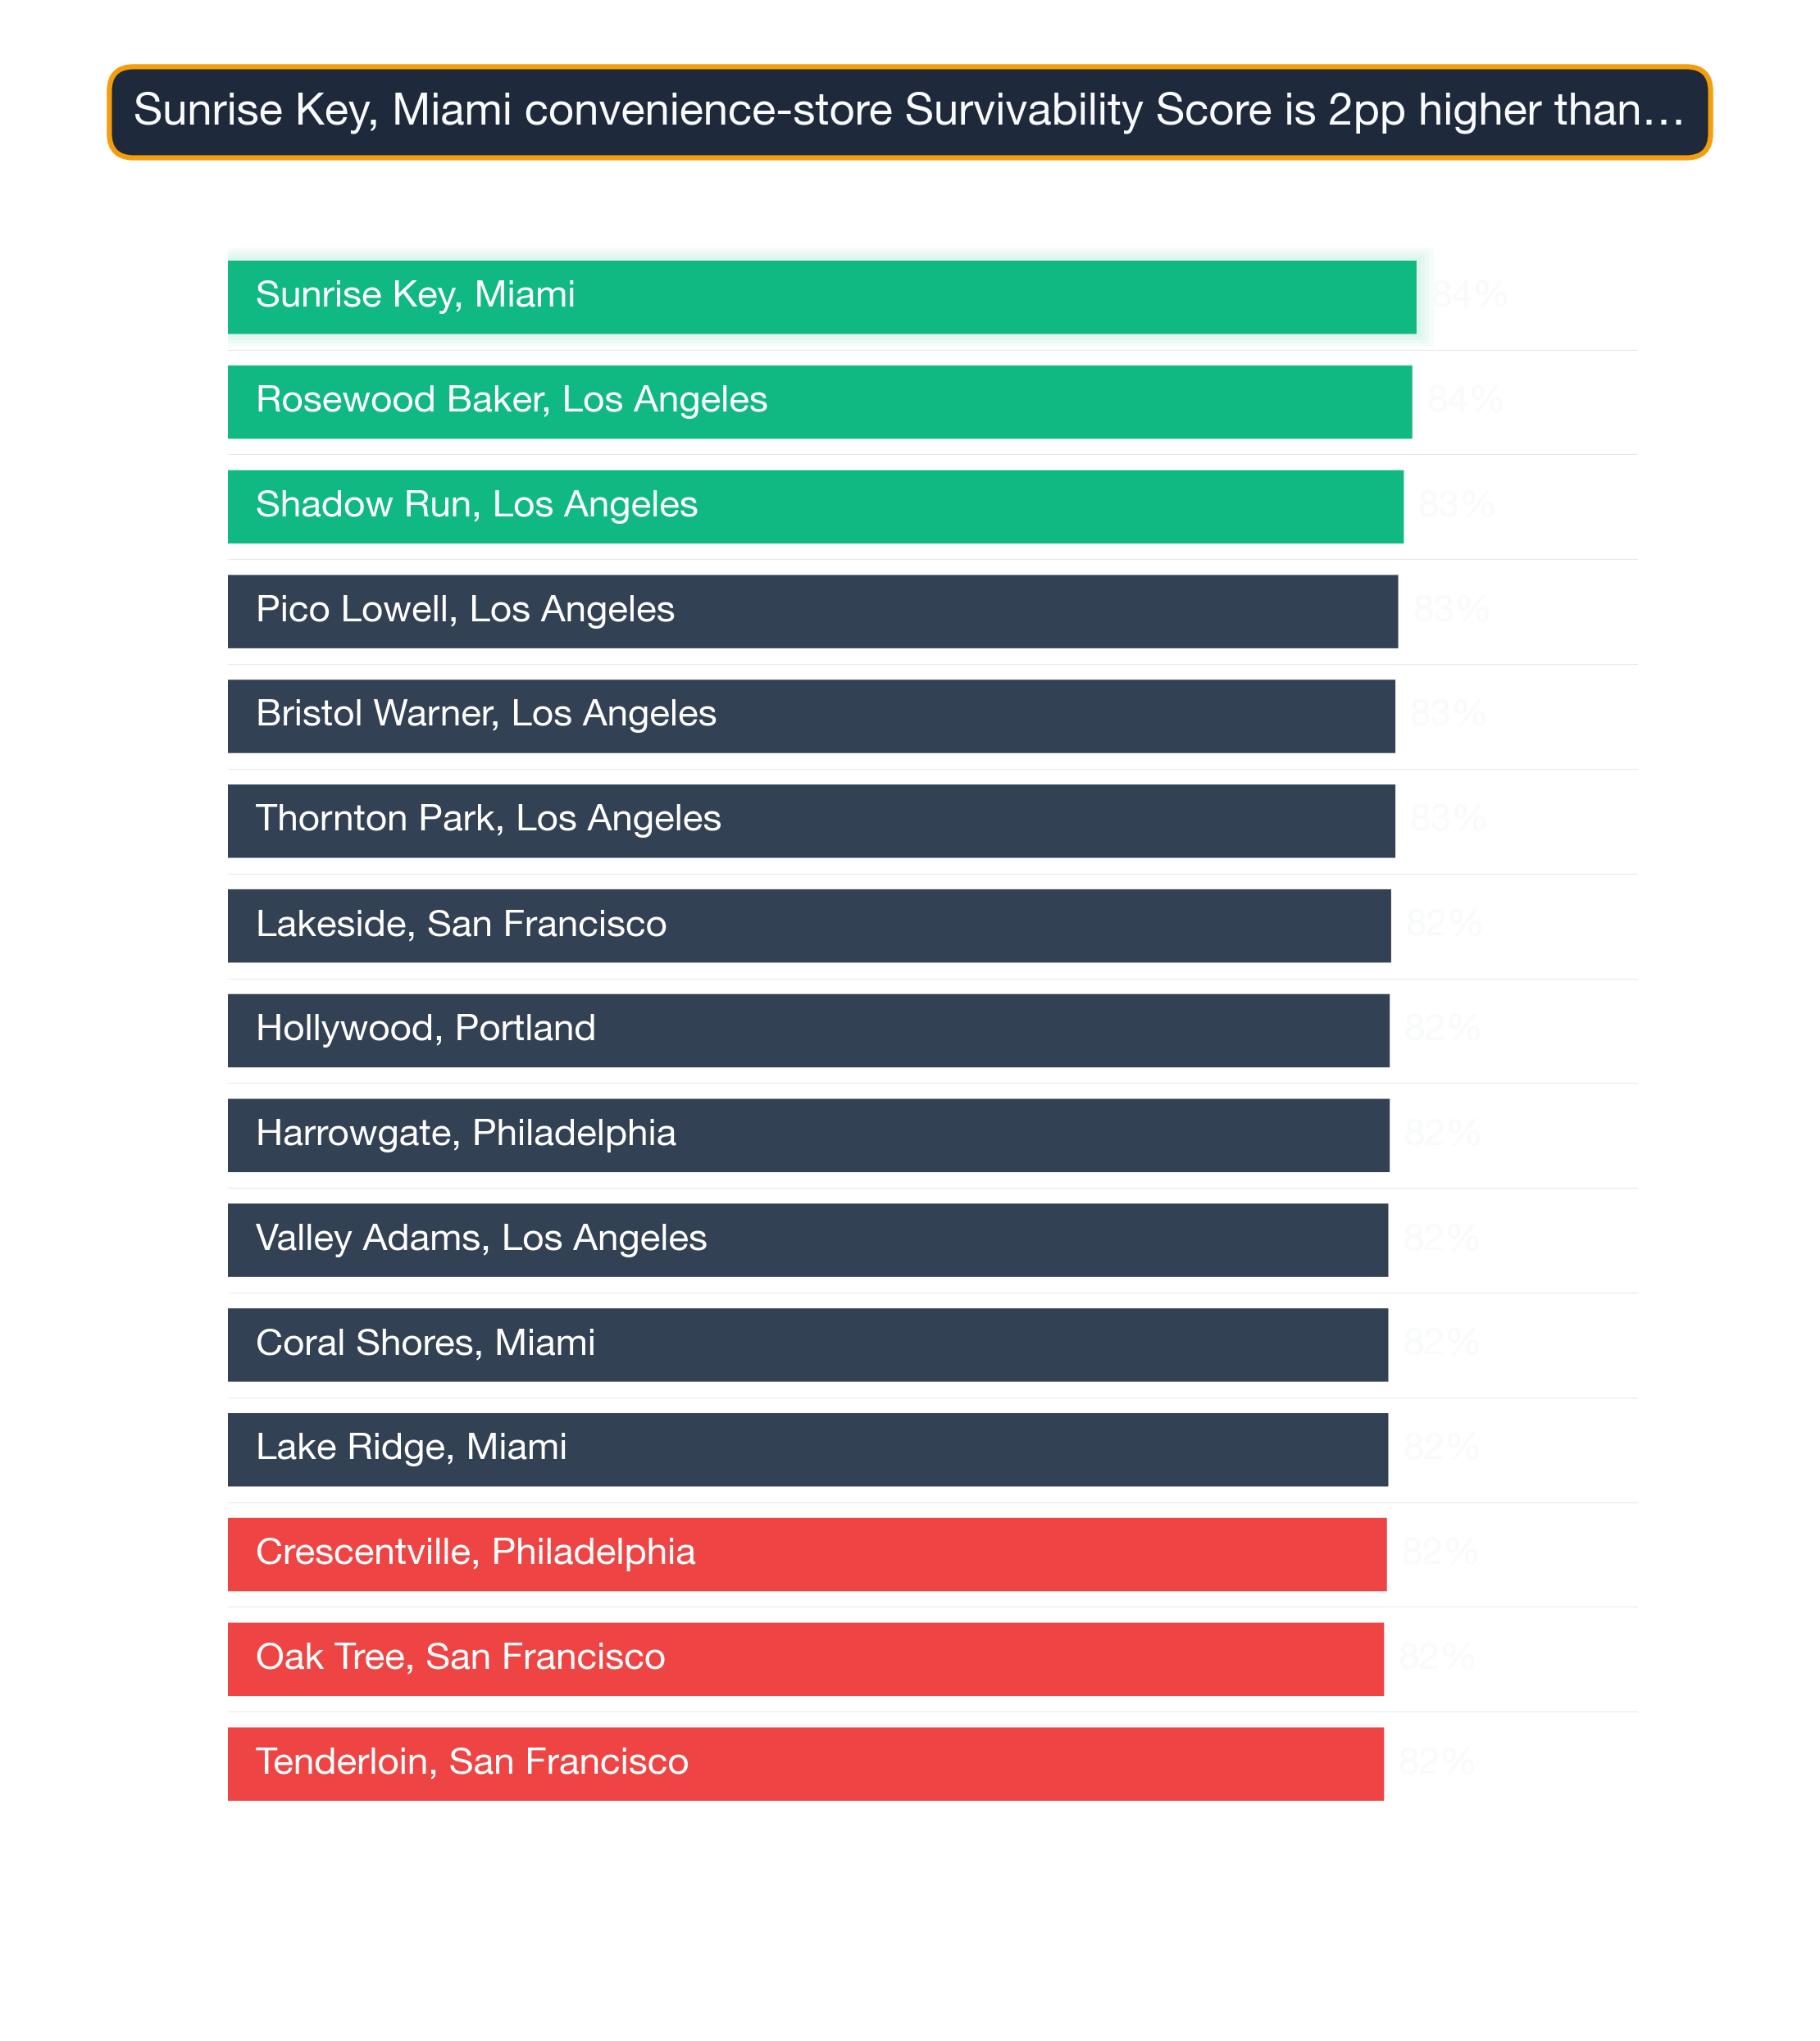
Sunrise Key (Miami) ranks #1 nationally for Convenience Store survivability in 2026, with a 84% chance of success for new entrants. The top 25 neighborhoods nationwide span 7 different cities, demonstrating that exceptional opportunities for Convenience Stores exist across diverse markets. These rankings are updated quarterly, but StreetSpring's live tool reflects current competitive conditions for any specific address — check it before signing a lease.
To understand the methodology behind these rankings, see our detailed guide: Survivability Score: How We Calculate It & Why It Matters.
Last reviewed by Bobby Koons, Founder & CEO, StreetSpring — May 3, 2026
Quick Summary
- #1 Neighborhood: Sunrise Key, Miami — 84% survivability for Convenience Store
- Neighborhoods analyzed: 1426 across 24 major US cities
- National average survivability: 73.7% for Convenience Stores
- Top-25 average: 82.3% — 8.6% above national average
- Data current as of: 2026 · Full methodology →
Table of Contents
- How neighborhoods compare nationwide
- Top 25 neighborhoods in the US
- Geographic patterns
- How to use this ranking
- Related resources
- Frequently asked questions
How neighborhoods rank nationwide for Convenience Stores
Analyzing 1426 neighborhoods across 24 major US cities, StreetSpring's 2026 data shows that the best neighborhoods for Convenience Stores significantly outperform average locations, with the top 25 neighborhoods nationwide averaging 82.3% survivability compared to the national neighborhood average of 73.7%.
Why some metros dominate this business's leaderboard
This 8.6% advantage illustrates how critical neighborhood selection is — choosing a top-tier neighborhood versus an average one can significantly increase your long-term survival chances.
What the nationwide score spread means for owners
For a Convenience Store, the survivability advantage of a top-ranked neighborhood (averaging 82.3% versus the national average of 73.7%) translates directly into a longer survival horizon and a stronger revenue capture position. StreetSpring's model identifies Convenience Stores survivability as particularly sensitive to the competitive density of direct and indirect competitors within a quarter-mile radius of the specific address.
Importantly, top-performing neighborhoods aren't concentrated in just a few cities. The top 25 neighborhoods represent 7 different cities. This means entrepreneurs focused on Convenience Stores can find exceptional opportunities across the United States, not just in traditionally strong markets.
Nothing influences a business's future more than its location.
What are the best neighborhoods in the United States to open a Convenience Store?
| Comparison factor | Where high-survivability neighborhoods excel | Where lower-survivability neighborhoods fall short |
|---|---|---|
| Subtype-specific density saturation | Neighborhoods with the subtype below the optimal density curve — room for a new entrant without cannibalizing demand. | Neighborhoods at or past the saturation point for the subtype, where new entrants face zero-sum competition. |
| Storefront vacancy + churn signal | Neighborhoods with low recent vacancy and steady operator continuity in similar subtypes. | Neighborhoods with elevated commercial vacancy or repeated tenant turnover in the same storefronts. |
| Walk Score + foot-traffic alignment | Neighborhoods where Walk Score (90+) matches actual measured pedestrian volume — not just street-grid promise. | High Walk Score scores driven by transit density but with sparse street-level retail engagement. |
Why these neighborhoods rank highest
Survivability range for top, middle, and last-ranked neighborhoods. Box = best-to-challenging range; white line = average. Sunrise Key, Miami leads at 84% in 2026. Full methodology →
The top 25 neighborhoods nationwide for Convenience Stores are:
| # | Neighborhood | City | Avg Survival | Tier | Best Locations | Challenging Locations |
|---|---|---|---|---|---|---|
| 1 | Sunrise Key | Miami | 84.3% | Great | 86.4% | 81.8% |
| 2 | Rosewood Baker | Los Angeles | 84.0% | Great | 86.1% | 81.4% |
| 3 | Shadow Run | Los Angeles | 83.4% | Great | 85.5% | 80.8% |
| 4 | Pico-Lowell | Los Angeles | 83.0% | Great | 85.1% | 80.4% |
| 5 | Bristol-Warner | Los Angeles | 82.8% | Great | 84.9% | 80.2% |
| 6 | Thornton Park | Los Angeles | 82.8% | Great | 84.9% | 80.2% |
| 7 | Lakeside | San Francisco | 82.5% | Great | 84.6% | 79.9% |
| 8 | Hollywood | Portland | 82.4% | Great | 84.6% | 79.9% |
| 9 | Harrowgate | Philadelphia | 82.4% | Great | 84.5% | 79.8% |
| 10 | Valley Adams | Los Angeles | 82.3% | Great | 84.4% | 79.8% |
| 11 | Lake Ridge | Miami | 82.3% | Great | 84.4% | 79.7% |
| 12 | Coral Shores | Miami | 82.3% | Great | 84.4% | 79.7% |
| 13 | Crescentville | Philadelphia | 82.2% | Great | 84.4% | 79.7% |
| 14 | Oak Tree | San Francisco | 82.0% | Great | 84.1% | 79.4% |
| 15 | Tenderloin | San Francisco | 82.0% | Great | 84.1% | 79.4% |
| 16 | Beaverton | Portland | 81.9% | Great | 84.0% | 79.3% |
| 17 | Fox Canyon | San Diego | 81.9% | Great | 84.0% | 79.3% |
| 18 | Republic Homes | Los Angeles | 81.8% | Great | 83.9% | 79.3% |
| 19 | Downtown | Dallas | 81.8% | Great | 83.9% | 79.2% |
| 20 | Oxford Circle | Philadelphia | 81.7% | Great | 83.9% | 79.2% |
| 21 | Merced Manor | San Francisco | 81.7% | Great | 83.9% | 79.2% |
| 22 | Bal Harbour | Miami | 81.6% | Great | 83.7% | 79.0% |
| 23 | Cypress Lakes | Miami | 81.6% | Great | 83.7% | 79.0% |
| 24 | Laurelhurst | Los Angeles | 81.5% | Great | 83.7% | 79.0% |
| 25 | Mayfair | Philadelphia | 81.4% | Great | 83.5% | 78.9% |
Survivability rankings at the neighborhood level describe typical conditions — any specific storefront may score higher or lower depending on its exact competitive environment.
For a full explanation of how survivability scores and ranges are calculated, see Survivability Score: How We Calculate It & Why It Matters.
Shared traits of the strongest US neighborhoods
City Concentration
The top 25 neighborhoods span 7 different cities, with Los Angeles claiming 8 of the top spots (32%).
Breakdown of top 25 neighborhoods by city:
- Los Angeles: 8 neighborhoods (32% of top 25) — View city guide
- Miami: 5 neighborhoods (20% of top 25) — View city guide
- San Francisco: 4 neighborhoods (16% of top 25) — View city guide
- Philadelphia: 4 neighborhoods (16% of top 25) — View city guide
- Portland: 2 neighborhoods (8% of top 25) — View city guide
- San Diego: 1 neighborhood (4% of top 25) — View city guide
- Dallas: 1 neighborhood (4% of top 25) — View city guide
This distribution has practical implications for Convenience Stores operators: cities with multiple neighborhoods in the top 25 offer more site options within a single market, reducing relocation or expansion cost. Cities with a single top-25 neighborhood require more precise site selection — the advantage is concentrated in one area rather than spread across the metro.
The role of anchor businesses at the city block level
The relatively even distribution of top neighborhoods across 7 cities is consistent with a category where consumer demand is broadly distributed rather than concentrated in specific metros. For Convenience Stores operators, this means strong site opportunities exist in multiple markets — the key variable is neighborhood-level competitive conditions rather than city-level market size.
From national ranking to a specific Convenience Store location
While nationwide neighborhood rankings identify standout markets, address-level analysis reveals even greater variation. StreetSpring analyzes millions of data points with AI to forecast business survivability across U.S. neighborhoods. Even within top-ranked neighborhoods, specific block selection can vary survivability by 10–20 percentage points.
For the most accurate assessment:
- Consider neighborhoods in the top 25 as strong starting points
- Examine city-specific guides for additional neighborhood options in your target markets
- Use StreetSpring's address-level tool to evaluate specific storefronts within these neighborhoods
- Factor in your budget, operational requirements, and target demographics
Each neighborhood has detailed analysis available through its city guide, providing block-by-block survivability data for Convenience Stores.
Combining this list with a block-level walk-through
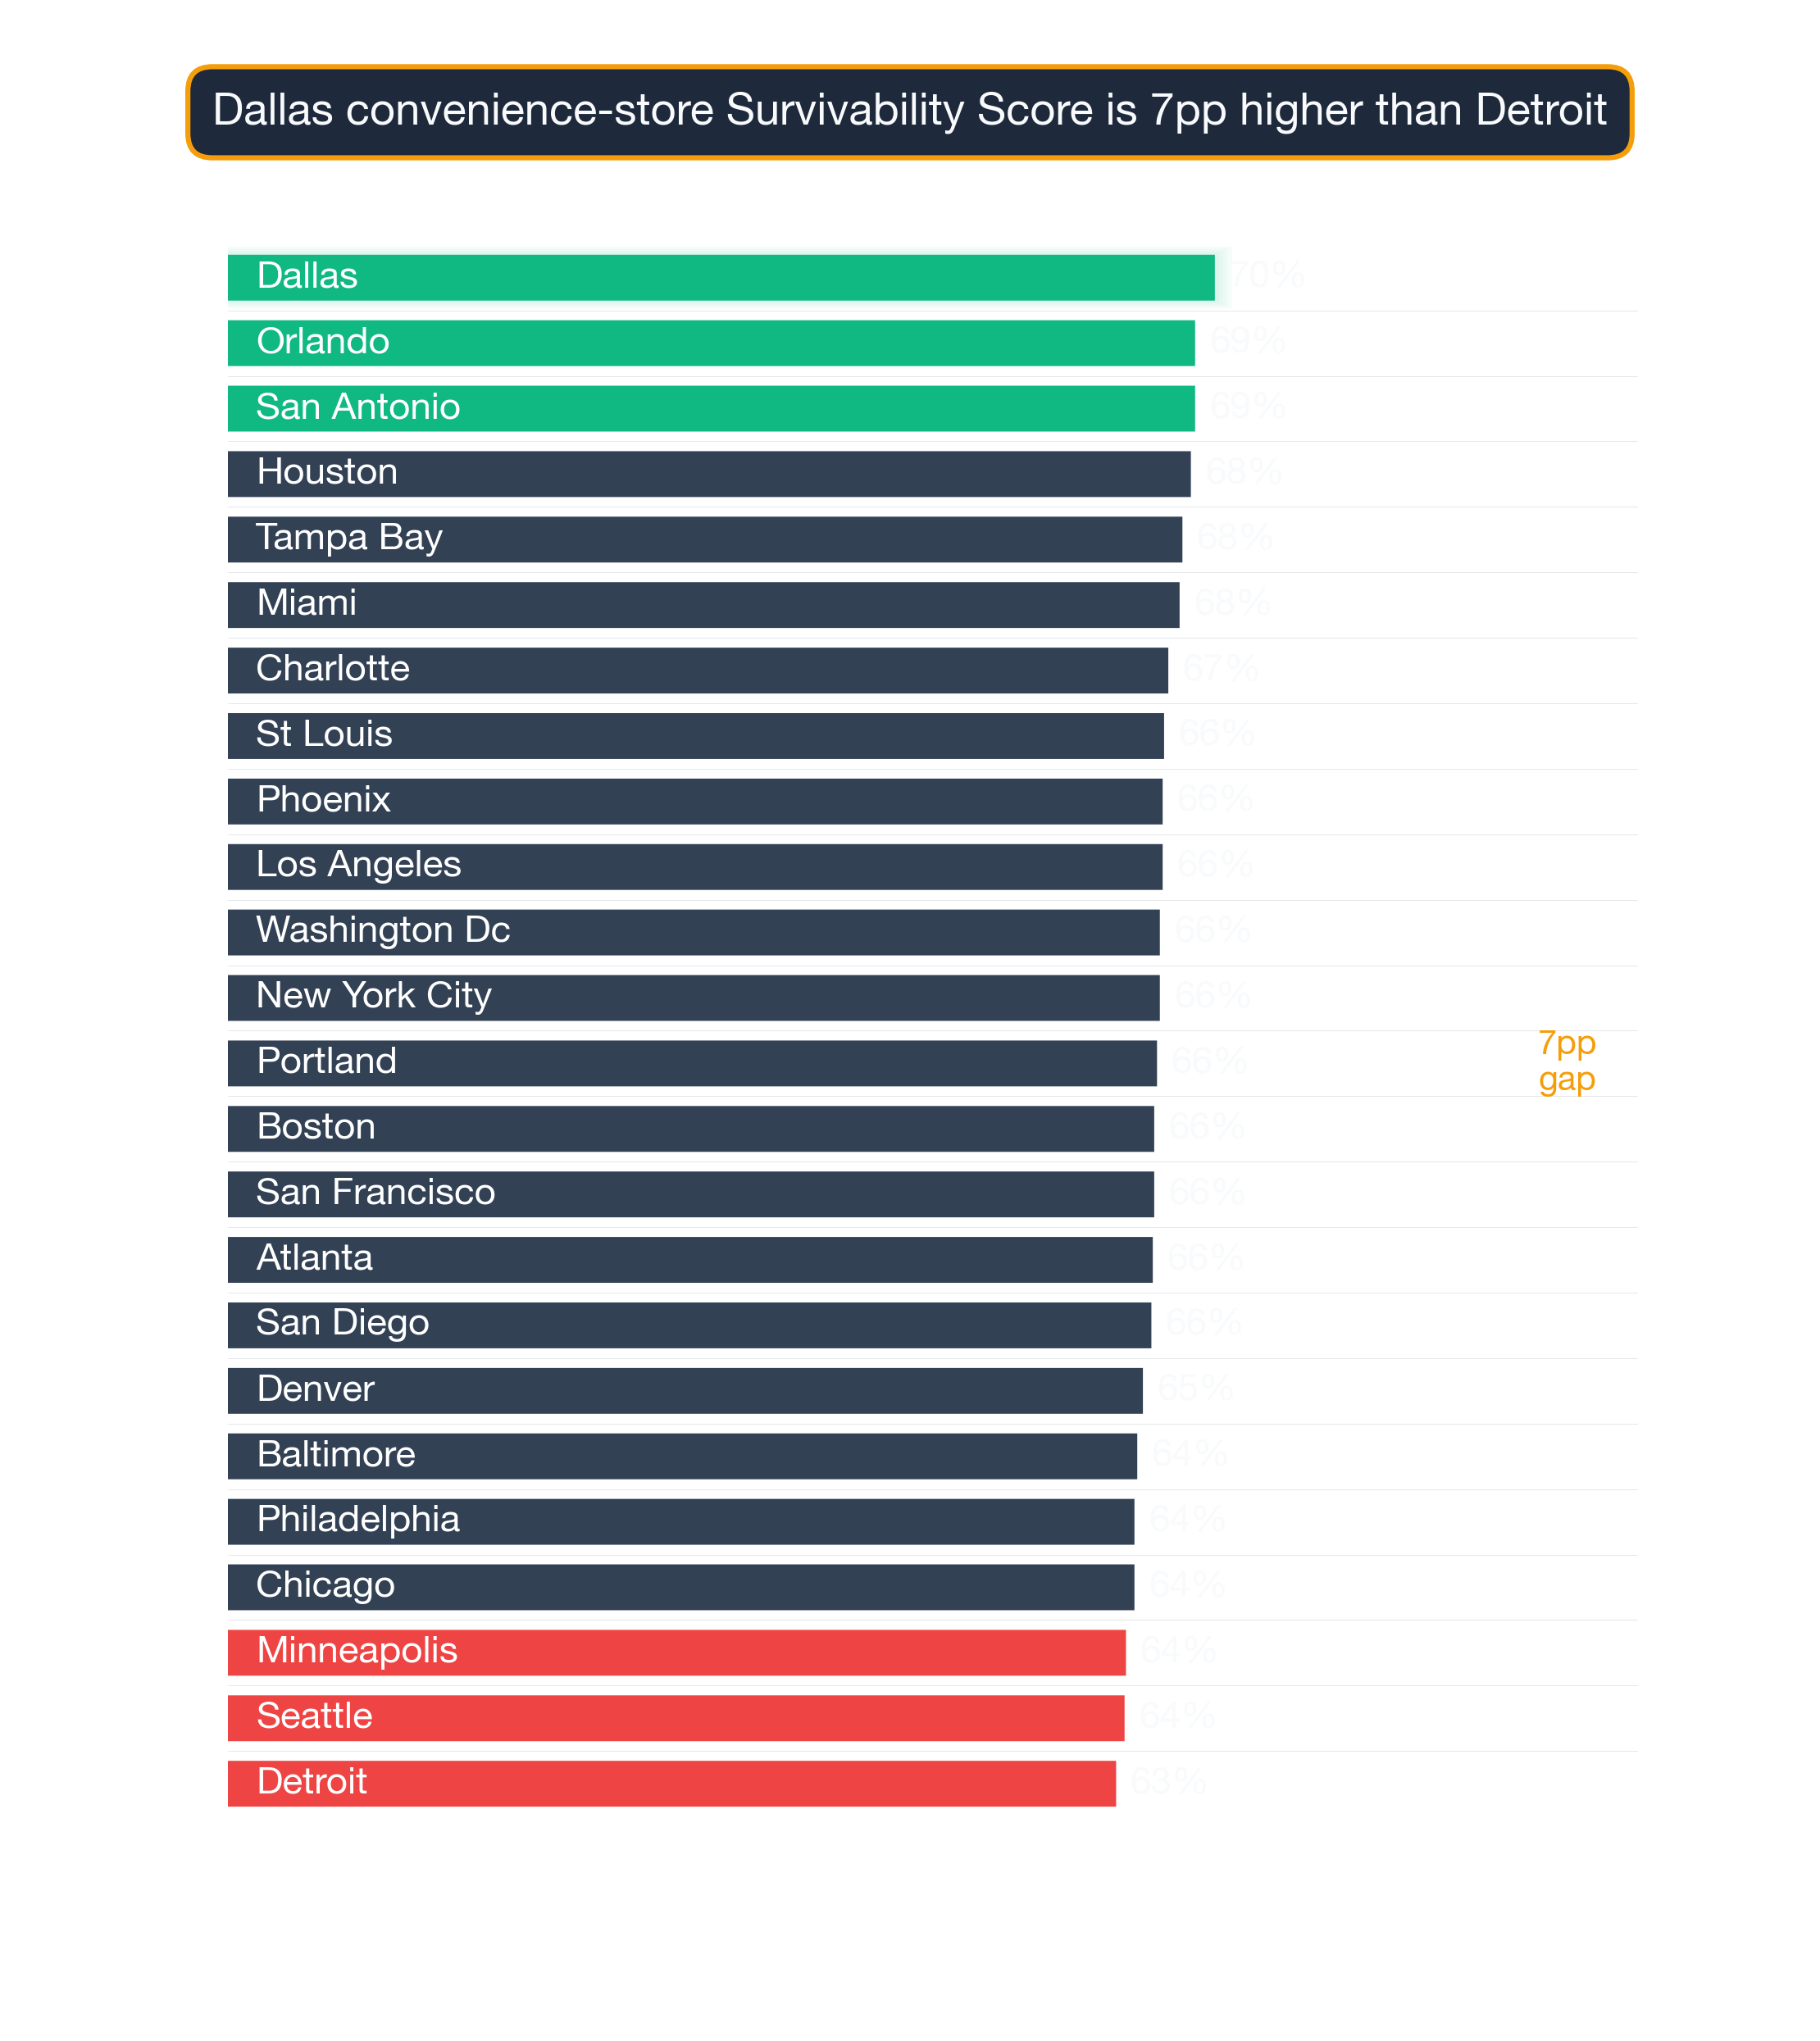
See also: Best Cities for Convenience Store — our city-level comparison ranks which metros offer the strongest overall conditions for Convenience Stores.
Cross-Category Patterns Across the Ranking
Survivability isn't subtype-specific in isolation. Neighborhoods that work for Convenience Stores often work for related business types — here's the cross-subtype picture at different points in the Convenience Store ranking:
Sunrise-Key, Miami — ranked #1 nationally — the strongest neighborhood for Convenience Stores (84% survivability for Convenience Store) Other business types that thrive in Sunrise-Key:
- Indonesian Restaurant (84% survivability)
- American Restaurant (84% survivability)
- Hot Pot Restaurant (83% survivability)
Dunlap, Philadelphia — ranked #714 of 1426 — a mid-ranked national neighborhood (74% survivability for Convenience Store) Other business types that thrive in Dunlap:
- Music Store (80% survivability)
- Ukrainian Restaurant (79% survivability)
- Russian Restaurant (79% survivability)
Cross-subtype synergy is a real signal. A neighborhood that scores high for Convenience Stores is usually a sound bet for several other business types — useful for landlords and multi-concept owners.
Visual Data
Related Resources
Explore top cities represented in these neighborhoods:
- Portland: Best businesses and neighborhoods
- Philadelphia: Best businesses and neighborhoods
- Dallas: Best businesses and neighborhoods
- San Diego: Best businesses and neighborhoods
- San Francisco: Best businesses and neighborhoods
National city rankings: Best cities for Convenience Stores
Essential resources:
- How StreetSpring calculates Survivability Scores
- Site selection for landlords
- AI tools for tenant representatives
- StreetSpring vs competitors
Frequently Asked Questions
What demographic factors drive survivability for Convenience Stores?
For Convenience Stores, StreetSpring's model incorporates neighborhood-level demographic data including population density, median household income, employment rates, and consumer spending on this specific category. These factors vary by business type — the demographic profile that drives survivability for Convenience Store customers may differ significantly from what matters for other business categories.
How can I compare specific addresses within these top neighborhoods?
StreetSpring's address-level tool allows you to input any commercial address and see predicted survivability for Convenience Stores. Even within the top-ranked neighborhoods, survivability varies meaningfully by block — address-level scoring is the most precise way to evaluate a specific site.
Where can I download the underlying data?
The full national survivability dataset is available as a free download: https://streetspring.com/resources/data/national-survivability-scores-2026.csv. The CSV includes all business subtypes and neighborhoods covered in this analysis, licensed under CC BY 4.0.
How does StreetSpring calculate survivability for Convenience Stores specifically?
StreetSpring's model calculates survivability for Convenience Stores by analyzing the competitive density of existing Convenience Stores within each distance band around the address, the projected consumer spending on Convenience Stores in that location, mobility patterns that determine likely customer flow, and 80+ additional factors. The resulting survivability score reflects the estimated probability of a new Convenience Store surviving 2+ years at that specific address.
How do I interpret a survivability score?
A survivability score represents the estimated probability that a business of a specific type will still be operating at a given location after 2 years. A score of 80% means StreetSpring's model predicts an 80% chance of the business surviving past the 2-year mark at that address. Scores are calculated at the address level and reflect competitive density, consumer spending patterns, mobility data, and 80+ additional factors.
What type of neighborhood is best for opening a Convenience Store?
The best neighborhoods for Convenience Stores share three characteristics: manageable competitive density (few existing direct competitors within the primary trade area), strong consumer spending on this category, and demographic alignment with the typical Convenience Store customer base. In StreetSpring's 2026 data, the top-ranked neighborhoods for Convenience Stores combine these factors in a way that produces survivability scores well above the national average of 73.7%. Neighborhoods with dense existing competition or low category spending tend to score significantly lower, regardless of overall foot traffic or prestige.
Which cities appear most frequently in the top 25 neighborhoods for Convenience Stores?
The cities most represented in the top 25 for Convenience Stores are Los Angeles (8), Miami (5), San Francisco (4). This concentration reflects the relative strength of consumer demand and competitive conditions for Convenience Stores in these markets. City-specific guides provide deeper analysis of each city's neighborhoods.
How should a landlord use this ranking when evaluating tenants for Convenience Stores?
Landlords can use this national neighborhood ranking to assess whether their property is in a location favorable to Convenience Stores — and by extension, how likely a Convenience Store tenant is to maintain long-term occupancy. If your property is in one of the top 25 neighborhoods, Convenience Stores represent a strong tenant category. If not, StreetSpring's address-level tool will show the survivability score for your specific address and which tenant types score highest there.
Technical note: Aggregated national survivability rankings across all 24 metros are available in machine-readable format for research and integration purposes.
StreetSpring recalculates survivability using the latest competitive, demographic, and walkability data, so the live score may differ from the static ranges shown here.
Methodology: Neighborhood rankings are based on average Survivability Scores for Convenience Stores across all analyzed locations within each neighborhood. Rankings represent neighborhood-level conditions but do not account for block-by-block variation. Coverage includes 1426 neighborhoods across 24 major US cities.