City Survivability Rankings for Convenience Store
StreetSpring's 2026 analysis ranks the top cities for Convenience Stores across the US by Survivability Scores. See which cities offer the best chances for a Convenience Store to succeed.
Quick Summary
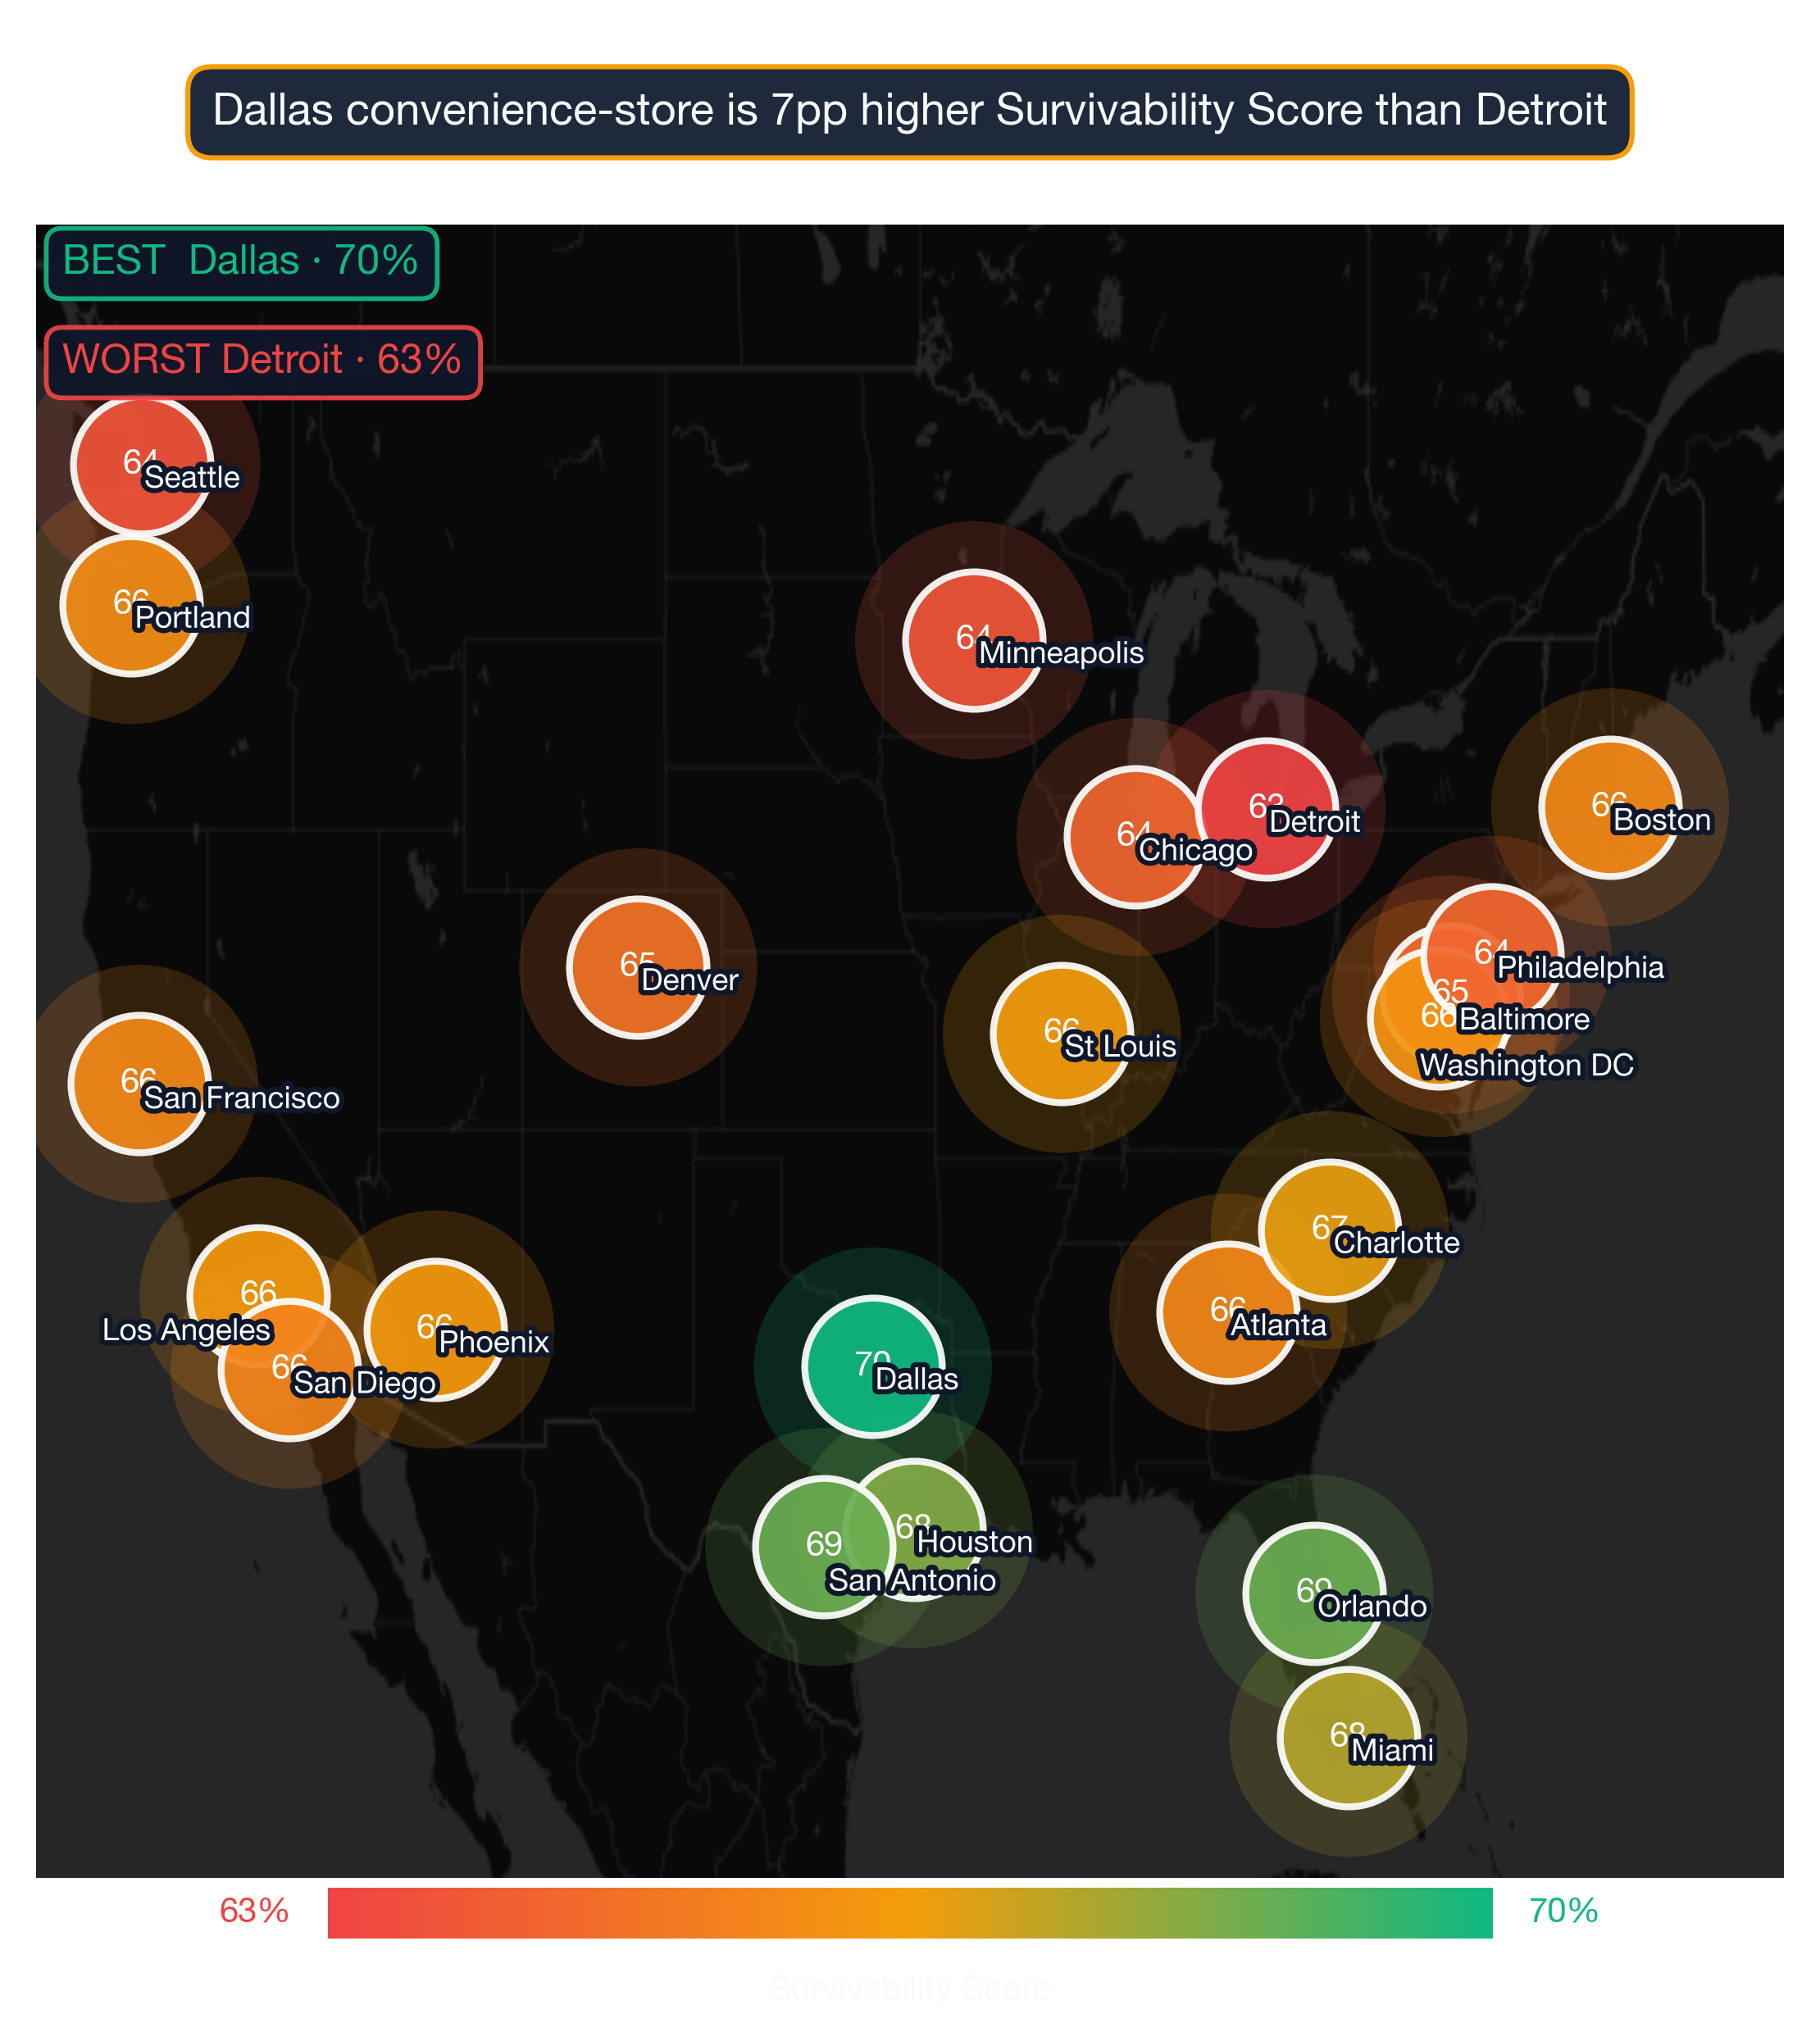
- The highest-survivability city for Convenience Store is Dallas — 70% average survivability
- 1 of 24 analyzed US metros score above 70% for Convenience Store survivability
- The lowest-ranked city is Detroit at 63%
- National average survivability score for Convenience Store: 66.0%
- Data reflects 2026 StreetSpring survivability analysis across 24 US metro areas · Full methodology →
Table of Contents
- Summary
- Top Cities for Convenience Stores
- Key Insights
- What Makes These Cities Stand Out?
- Best Neighborhoods Across the Spectrum
- Related Resources
- How current is this ranking?
- Can a Convenience Store succeed in cities not ranked in the top 10?
- What tools can help me choose the right city for a Convenience Store?
- Which US city has the best survivability for Convenience Stores?
Summary
According to StreetSpring's 2026 nationwide analysis, Dallas ranks as the #1 city for opening a Convenience Store in the United States, with an average 70% chance of surviving more than 2 years. Following close behind are Orlando with 69%, and San Antonio with 69%. The 24-city analysis shows Convenience Stores performing at a 66.0% national average, with strong geographic concentration of top scores in a handful of metros. Our data shows that strong individual locations exist in every city we analyze, regardless of the city's overall ranking. These rankings reflect data through early 2026 — check StreetSpring for the latest figures before any location decision.
Survivability ranges reflect best and worst storefront conditions within each city. See our full methodology →

Convenience Store city survivability rankings — Dallas leads among 24 US metros at 70% in 2026
Where Convenience Stores Stand Across 24 US Metros
Based on StreetSpring's analysis of 24 major metropolitan areas, these cities offer the strongest prospects for Convenience Stores:
1. Dallas Metro: Dallas-Fort Worth-Arlington, TX
- Best locations: 78.1% – 88.0%
- Average locations: 66.6% – 72.2%
- Challenging locations: 41.0% – 61.3%
- Explore Convenience Store neighborhoods in Dallas →
Where the top 5 cluster, and the surprising outliers
2. Orlando Metro: Orlando-Kissimmee-Sanford, FL
- Best locations: 77.8% – 89.0%
- Average locations: 64.9% – 71.1%
- Challenging locations: 38.0% – 59.4%
- Explore Convenience Store neighborhoods in Orlando →
3. San Antonio Metro: San Antonio-New Braunfels, TX
- Best locations: 77.8% – 89.0%
- Average locations: 65.2% – 71.1%
- Challenging locations: 40.0% – 60.0%
- Explore Convenience Store neighborhoods in San Antonio →
4. Houston Metro: Houston-Pasadena-The Woodlands, TX
- Best locations: 78.0% – 90.0%
- Average locations: 65.2% – 70.9%
- Challenging locations: 43.0% – 60.7%
- Explore Convenience Store neighborhoods in Houston →
5. Tampa Bay Metro: Tampa-St. Petersburg-Clearwater, FL
- Best locations: 76.8% – 88.0%
- Average locations: 64.4% – 70.1%
- Challenging locations: 40.0% – 59.4%
- Explore Convenience Store neighborhoods in Tampa Bay →
6. Miami Metro: Miami-Fort Lauderdale-West Palm Beach, FL
- Best locations: 78.1% – 91.0%
- Average locations: 64.0% – 70.3%
- Challenging locations: 38.0% – 58.6%
- Explore Convenience Store neighborhoods in Miami →
7. Charlotte Metro: Charlotte-Concord-Gastonia, NC-SC
- Best locations: 77.2% – 90.0%
- Average locations: 63.5% – 69.5%
- Challenging locations: 40.0% – 58.7%
- Explore Convenience Store neighborhoods in Charlotte →
8. St Louis
- Best locations: 76.1% – 88.0%
- Average locations: 62.5% – 69.0%
- Challenging locations: 34.0% – 56.7%
- Explore Convenience Store neighborhoods in St Louis →
9. Los Angeles Metro: Los Angeles-Long Beach-Anaheim, CA
- Best locations: 77.0% – 90.0%
- Average locations: 62.5% – 69.1%
- Challenging locations: 35.0% – 56.9%
- Explore Convenience Store neighborhoods in Los Angeles →
10. Phoenix Metro: Phoenix-Mesa-Chandler, AZ
- Best locations: 76.5% – 89.0%
- Average locations: 62.9% – 69.0%
- Challenging locations: 38.0% – 57.8%
- Explore Convenience Store neighborhoods in Phoenix →
11. Washington DC Metro: Washington-Arlington-Alexandria, DC-VA-MD-WV
- Best locations: 76.8% – 90.0%
- Average locations: 62.2% – 69.0%
- Challenging locations: 34.0% – 56.5%
- Explore Convenience Store neighborhoods in Washington DC →
12. New York City Metro: New York-Newark-Jersey City, NY-NJ
- Best locations: 76.8% – 90.0%
- Average locations: 62.3% – 68.9%
- Challenging locations: 35.0% – 56.7%
- Explore Convenience Store neighborhoods in New York City →
Where mid-ranked cities still beat top-ranked spots locally
13. Portland Metro: Portland-Vancouver-Hillsboro, OR-WA
- Best locations: 74.9% – 86.0%
- Average locations: 62.4% – 68.3%
- Challenging locations: 37.0% – 57.2%
- Explore Convenience Store neighborhoods in Portland →
14. Boston Metro: Boston-Cambridge-Newton, MA-NH
- Best locations: 75.7% – 88.0%
- Average locations: 62.1% – 68.4%
- Challenging locations: 36.0% – 56.8%
- Explore Convenience Store neighborhoods in Boston →
15. San Francisco Metro: San Francisco-Oakland-Fremont, CA
- Best locations: 75.7% – 88.0%
- Average locations: 62.1% – 68.4%
- Challenging locations: 36.0% – 56.8%
- Explore Convenience Store neighborhoods in San Francisco →
16. Atlanta Metro: Atlanta-Sandy Springs-Roswell, GA
- Best locations: 75.7% – 88.0%
- Average locations: 62.0% – 68.3%
- Challenging locations: 35.0% – 56.4%
- Explore Convenience Store neighborhoods in Atlanta →
17. San Diego Metro: San Diego-Chula Vista-Carlsbad, CA
- Best locations: 76.1% – 89.0%
- Average locations: 62.0% – 68.3%
- Challenging locations: 36.0% – 56.6%
- Explore Convenience Store neighborhoods in San Diego →
18. Denver Metro: Denver-Aurora-Centennial, CO
- Best locations: 76.2% – 90.0%
- Average locations: 61.2% – 67.9%
- Challenging locations: 34.0% – 55.6%
- Explore Convenience Store neighborhoods in Denver →
19. Baltimore Metro: Baltimore-Columbia-Towson, MD
- Best locations: 74.6% – 87.0%
- Average locations: 61.0% – 67.2%
- Challenging locations: 35.0% – 55.7%
- Explore Convenience Store neighborhoods in Baltimore →
20. Chicago Metro: Chicago-Naperville-Elgin, IL-IN
- Best locations: 75.0% – 88.0%
- Average locations: 60.4% – 67.1%
- Challenging locations: 32.0% – 54.6%
- Explore Convenience Store neighborhoods in Chicago →
21. Philadelphia Metro: Philadelphia-Camden-Wilmington, PA-NJ-DE-MD
- Best locations: 75.4% – 89.0%
- Average locations: 60.7% – 67.3%
- Challenging locations: 34.0% – 55.2%
- Explore Convenience Store neighborhoods in Philadelphia →
22. Minneapolis Metro: Minneapolis-St. Paul-Bloomington, MN-WI
- Best locations: 76.0% – 91.0%
- Average locations: 60.0% – 66.9%
- Challenging locations: 33.0% – 54.5%
- Explore Convenience Store neighborhoods in Minneapolis →
23. Seattle Metro: Seattle-Tacoma-Bellevue, WA
- Best locations: 75.5% – 90.0%
- Average locations: 59.8% – 66.8%
- Challenging locations: 32.0% – 54.1%
- Explore Convenience Store neighborhoods in Seattle →
24. Detroit Metro: Detroit-Warren-Dearborn, MI
- Best locations: 74.2% – 88.0%
- Average locations: 58.9% – 66.0%
- Challenging locations: 29.0% – 52.8%
- Explore Convenience Store neighborhoods in Detroit →
What Stands Out in the Numbers
| Signal | Where strong-survivability cities outperform | What drags weaker cities down |
|---|---|---|
| Market size vs saturation | Mid-sized metros with established demand but room for new entrants — under-served pockets in 1.5M–5M population markets. | Either tier-1 cities saturated with national chains, or thin markets under 500K population where demand can't sustain a category. |
| BLS QCEW retail employment trend | Cities with positive 3-year retail employment growth — proxy for local demand expansion. | Cities showing flat or declining retail employment over the same window. |
| Cross-subtype clustering | Cities where the subtype clusters near complementary categories (e.g., coffee shops near coworking + gyms). | Cities where the subtype is dispersed across isolated storefronts without supporting foot-traffic. |
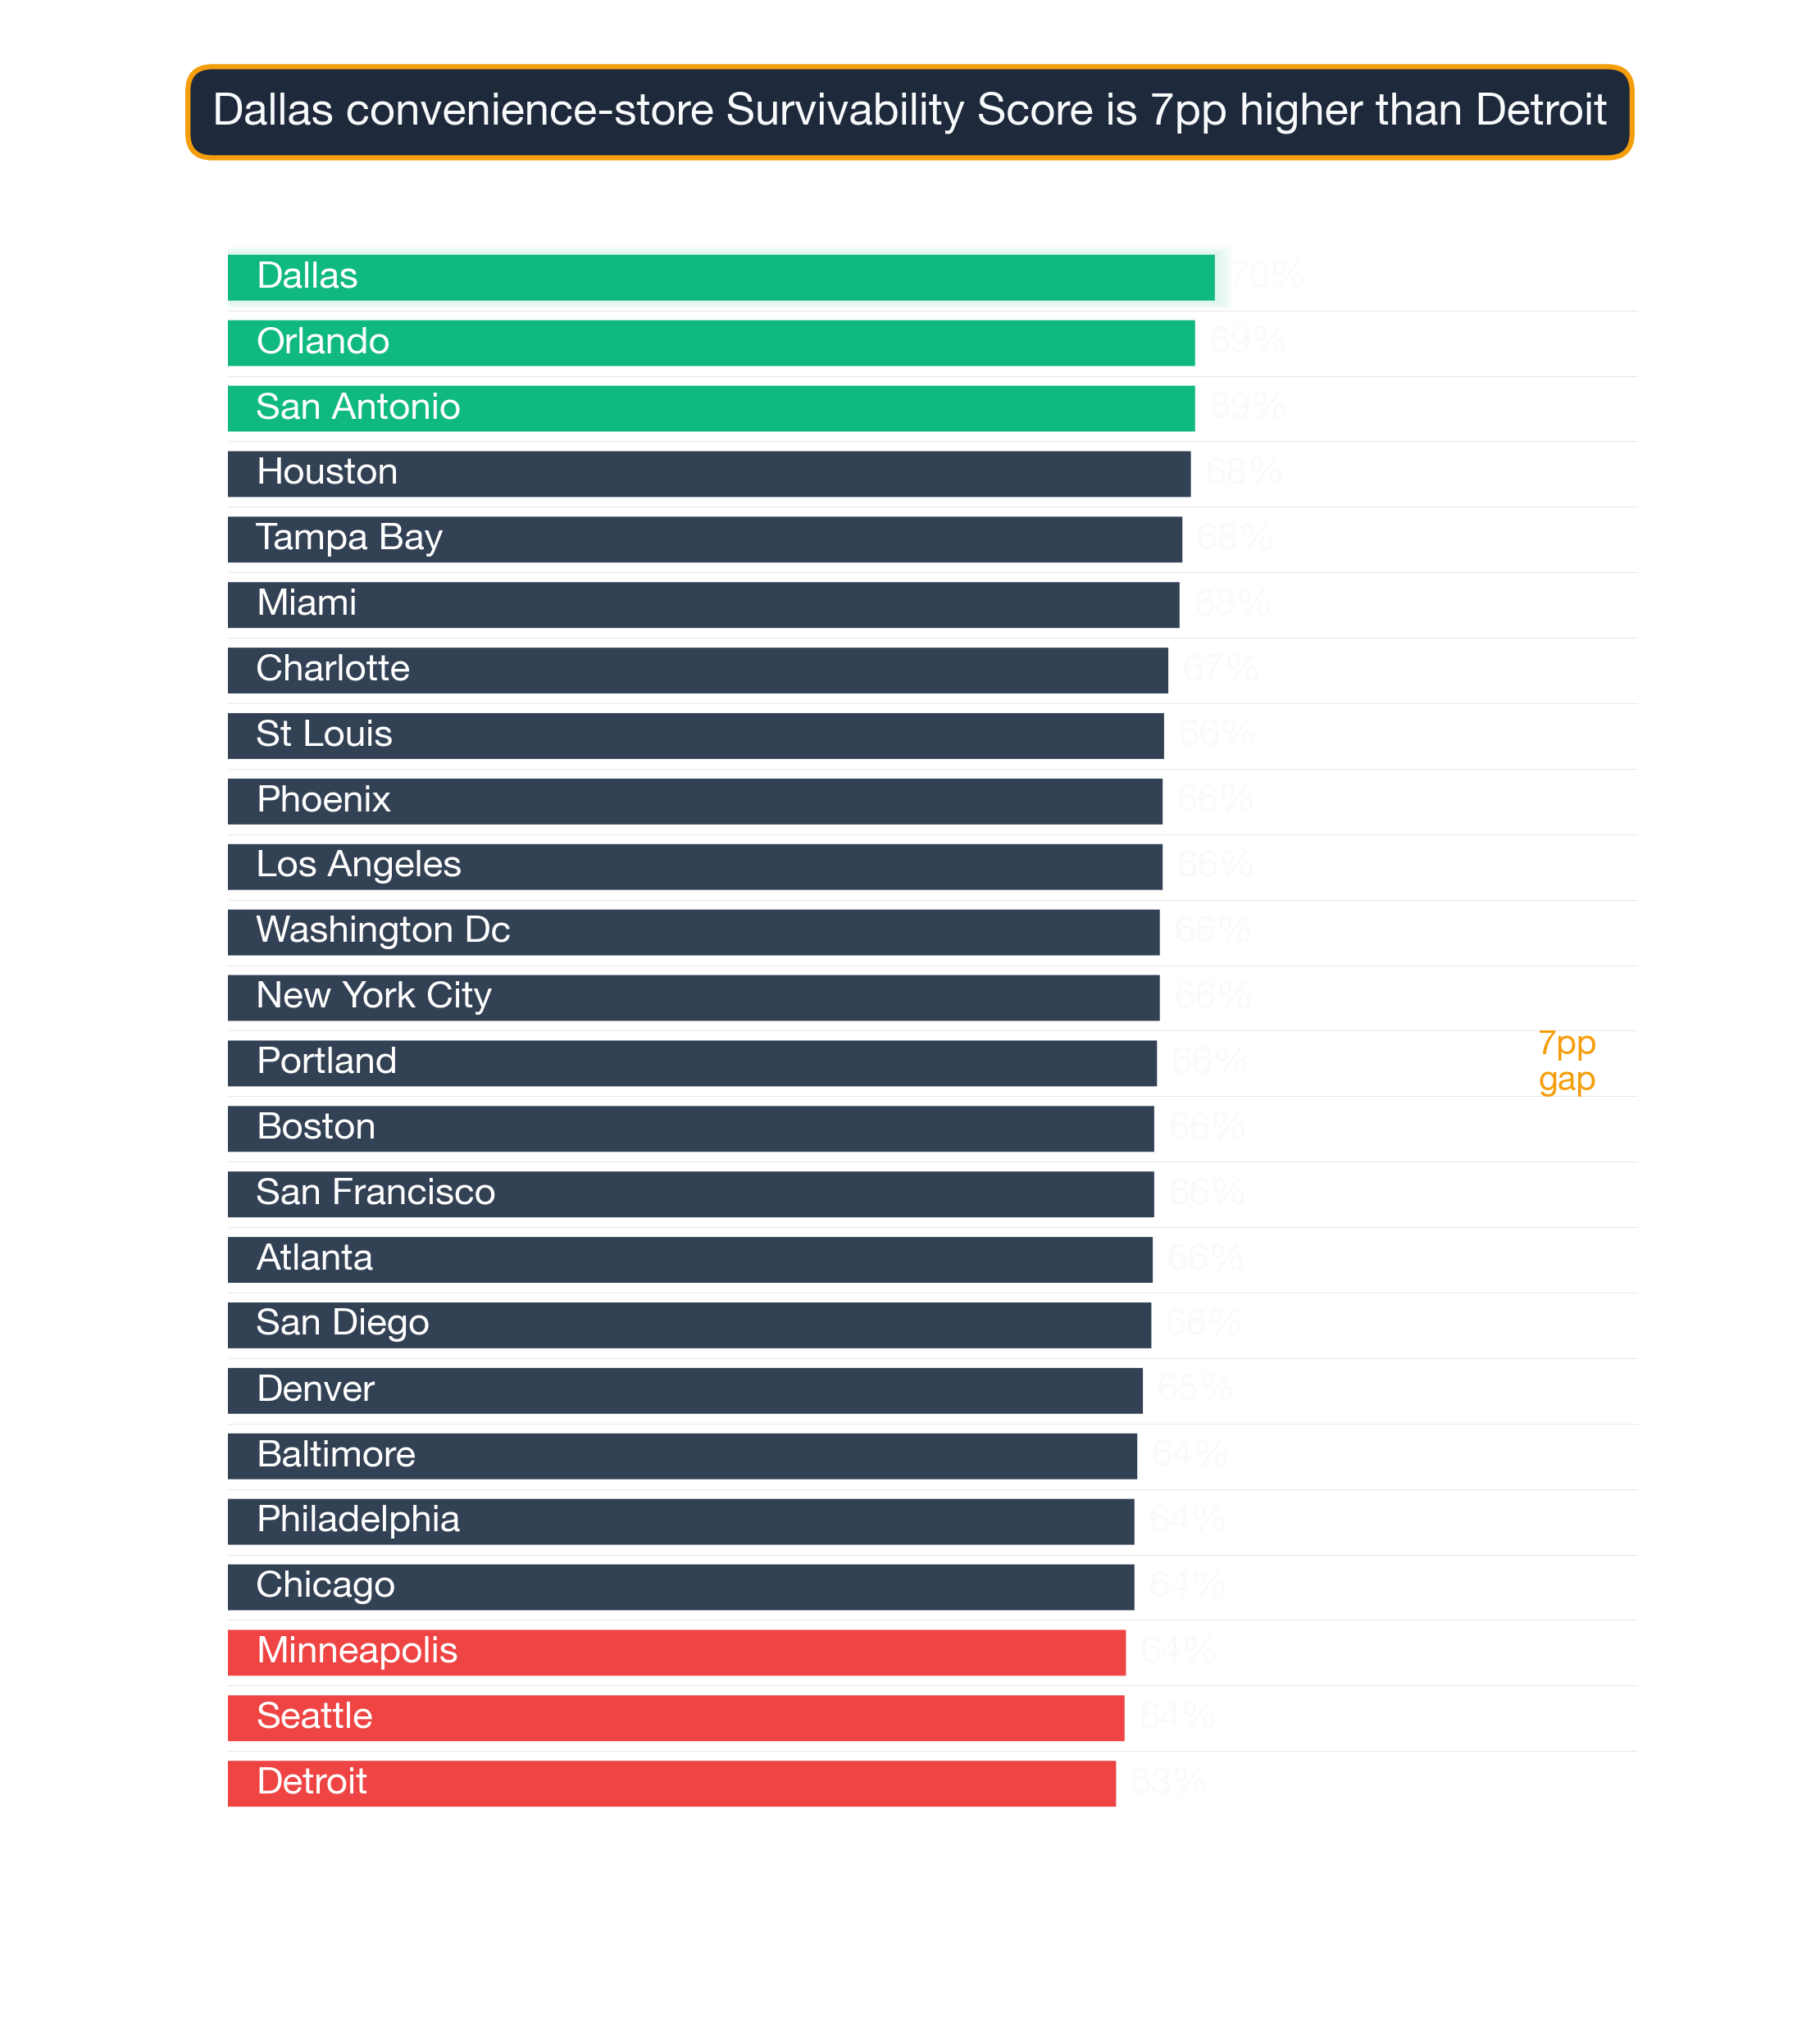
Wide variation between cities: The difference between the #1 city (Dallas at 70.0%) and the #24 city (Detroit at 63.0%) is 7.1 percentage points. A 1.4-point spread at the top of the rankings indicates that selecting Dallas over a lower-ranked city represents a substantial survivability advantage for Convenience Stores.
National average: Across all 24 analyzed cities, the average survivability for a Convenience Store is 66.0%.
What the Leaders Share
The top-ranked cities share several characteristics that favor Convenience Stores:
- Strong survivability signals: Dallas leads with a 70% average survivability score for Convenience Stores — significantly above the national average for this business category.
- Competition density: The top cities show favorable competitor-to-opportunity ratios for Convenience Stores, meaning lower saturation and higher odds of capturing an underserved customer base.
- Low market saturation: Top cities for Convenience Stores have fewer direct competitors per square mile than lower-ranked metros, leaving meaningful whitespace for well-positioned new entrants.
- Consumer demand signals: StreetSpring's data captures foot traffic patterns, competitor review velocity, and demographic fit — all pointing toward sustained demand for Convenience Stores in these markets.
Across the U.S., real estate professionals and business owners rely on StreetSpring's AI predictions to understand where a new venture is most likely to thrive, before signing a lease. Our models draw from one of the most comprehensive commercial real estate datasets ever assembled. StreetSpring's predictions leverage proprietary datasets covering competition, spending, and mobility.
Standout Neighborhoods From Top to Bottom
National rankings tell only part of the story. Even cities further down the list contain neighborhoods where Convenience Stores thrive. A few examples:
Dallas — ranked #1 nationally — the strongest market for Convenience Stores
- Downtown (82% survivability)
- Clearview (80% survivability)
- Oak-Lawn (80% survivability)
- South-Poly (79% survivability)
- East (79% survivability)
See full neighborhood rankings for Dallas →
These examples show that a city's national rank for Convenience Stores is a starting signal — neighborhood-level data is what drives an actual location decision.
Visual Data
Related Resources
City-specific guides: For detailed neighborhood-level analysis, explore our city guides:
- Survivability Rankings for Convenience Store in Dallas
- Business Survivability Rankings: Dallas
- Survivability Rankings for Convenience Store in Orlando
- Business Survivability Rankings: Orlando
- Survivability Rankings for Convenience Store in San Antonio
- Business Survivability Rankings: San Antonio
- Survivability Rankings for Convenience Store in Houston
- Business Survivability Rankings: Houston
- Survivability Rankings for Convenience Store in Tampa Bay
- Business Survivability Rankings: Tampa Bay
National guides:
- National Neighborhood Survivability Rankings for Convenience Stores
- Neighborhood Survivability Rankings: Dallas
How fresh is this city-survivability data?
Rankings are updated quarterly. The current data reflects StreetSpring's 2026 analysis, with the next full dataset refresh scheduled for Q3 2026. As market conditions shift across major metros, individual city scores can move meaningfully between updates — particularly for Convenience Stores, where local competition density and consumer spending patterns respond quickly to new entrants and neighborhood change. For the most current score at any specific address, use StreetSpring's live survivability tool rather than the static ranking above.
Do Convenience Stores only work in top-10 cities?
Yes — our top 10 ranking reflects cities with the strongest average conditions, but lower-ranked metros can still contain exceptional individual neighborhoods. Many operators successfully open Convenience Stores in cities that don't appear in our top 10. Convenience Stores in particular can find strong performance in secondary markets where the right demographic concentration, household income, and limited direct competition within walking distance align — even outside our highest-ranked cities. StreetSpring's neighborhood-level data surfaces these pockets of opportunity in every city we analyze, regardless of where the city as a whole ranks nationally.
What tools can help me choose the right city for a Convenience Store?
StreetSpring's Survivability Score tool provides address-level predictions for Convenience Stores across all 24 metros we track. For this category specifically, the tool surfaces competition density, consumer spending index for Convenience Stores, and commercial vacancy rates — the factors that most consistently predict whether a Convenience Store will still be operating after two years. You can check any specific address before signing a lease and compare multiple neighborhoods side by side to identify the highest-survivability site within your target city.
Try the Survivability Score tool →
Which metro tops the Convenience Store survivability ranking?
Dallas ranks as the #1 city in the US for Convenience Stores survivability in StreetSpring's 2026 analysis, with an average score of 70%. This means that across well-selected neighborhoods in Dallas, a Convenience Store has approximately a 70% chance of still operating after two years — above the national average for this category. Orlando ranks second, followed by San Antonio. The full ranking reflects data across 24 major US metro areas — see the complete list above for all scores and neighborhood-level links.
Last reviewed: April 30, 2026 by Bobby Koons, StreetSpring founder — updated weekly
Technical note: Aggregated national survivability rankings across all 24 metros are available in machine-readable format for research and integration purposes.
StreetSpring recalculates survivability using the latest competitive, demographic, and walkability data, so the live score may differ from the static ranges shown here.
Methodology: City rankings aggregate neighborhood-level Survivability Scores (max, average, and min) across all analyzed neighborhoods in each metro area. Rankings reflect average conditions but do not account for variation within cities. Coverage includes 24 major US metropolitan areas: Dallas, Orlando, San Antonio, Houston, Tampa Bay, Miami, Charlotte, St Louis, Los Angeles, Phoenix, Washington DC, New York City, Portland, Boston, San Francisco, Atlanta, San Diego, Denver, Baltimore, Chicago, Philadelphia, Minneapolis, Seattle, Detroit.