Neighborhood Survivability Rankings: San Diego
StreetSpring's 2026 analysis ranks the best and worst neighborhoods in San Diego for new businesses by survivability score. See which areas give you the best chance of lasting more than two years.
Reviewed: May 2, 2026 by Bobby Koons, StreetSpring founder
Quick Summary
- Top neighborhood: Miramar — ~88% best-case survivability, ~81% average across all business types
- Most challenging: Skyline — ~69% average survivability
- 48 neighborhoods analyzed across the San Diego metro
- Rankings based on average survivability across 130+ brick-and-mortar business types; your specific business type and address will differ
- See our full methodology →
Table of Contents
- Summary
- 10 Best Neighborhoods to Open a Business
- Hardest Places to Open a Business
- Where Would a Business Make the Most Money?
- What Should I Consider When Opening?
- Where to Start & How to Find Data
- Advice for Landlords
- Tools for Tenant-Rep Agents
- Why Do Survival Rates Vary?
- What Is a Survivability Score?
- How Does StreetSpring Compare?
- What Each Neighborhood Specializes In
- Related Resources
Summary
StreetSpring's 2026 analysis shows Miramar is the strongest neighborhood in San Diego for new businesses, with the best locations offering a ~88% chance of lasting more than two years. Across all business types that could open in Miramar, the average location shows a ~81% chance of lasting more than two years. Averages mask the full picture — a single block can outperform an entire neighborhood's ranking at the storefront level.
What Are the Best Neighborhoods in San Diego to Open ?
The top 10 neighborhoods in or around San Diego to open a business are:
| # | Neighborhood | Avg Survival | Best Locations | Challenging Locations |
|---|---|---|---|---|
| 1 | Miramar | ~81% | ~88% | ~66% |
| 2 | Barrio Logan | ~81% | ~87% | ~69% |
| 3 | Kearny Mesa | ~80% | ~87% | ~64% |
| 4 | La Playa | ~80% | ~90% | ~60% |
| 5 | Harborview | ~79% | ~88% | ~64% |
| 6 | Ocean Beach | ~78% | ~87% | ~68% |
| 7 | Corridor | ~77% | ~82% | ~73% |
| 8 | Grant Hill | ~77% | ~80% | ~74% |
| 9 | Escondido | ~77% | ~91% | ~59% |
| 10 | Carlsbad | ~77% | ~91% | ~56% |
See the Survivability Score for your new business

What Are the Hardest Places in or Around San Diego to Open a Business?
The hardest neighborhoods in or around San Diego to open a business are:
| # | Neighborhood | Best Locations | Challenging Locations |
|---|---|---|---|
| 48 | Skyline | ~69% | ~59% |
| 47 | Rolando | ~71% | ~63% |
| 46 | Nestor | ~71% | ~61% |
| 45 | Kensington | ~71% | ~65% |
| 44 | College East | ~71% | ~64% |
Even the lowest-ranked neighborhoods contain locations that beat the city average — and even top-ranked ones have weak spots. The best-performing neighborhoods today may look different in six months; check StreetSpring's live tool for the current score at any specific location.
Which San Diego Neighborhoods Drive the Highest Revenue?
StreetSpring gives you a precise survivability probability for any specific address and business type combination, not a generalized estimate. In Miramar, the best possible location offers ~17% better survival odds than the average location in or around San Diego — meaning a meaningfully higher probability of still operating after two years. On the other hand, in Skyline, the most challenging locations show survival odds that are roughly ~21% below the city average.
How revenue capture varies neighborhood by neighborhood
The right location can make a business; the wrong one can break it. Based on StreetSpring's 2026 analysis for San Diego, you can access the most up-to-date forecasts with StreetSpring for free to select the location that puts you in the best position to succeed.
See the Survivability Score for your new business
What Should I Consider When Opening in or Around San Diego?
The single most important decision when opening a brick-and-mortar business is where you locate — and Survivability Score is the most reliable guide to that decision. Among all the inputs that shape survivability, Revenue Capture Score carries the most predictive weight. Revenue Capture Score has two drivers:
| Consideration | Common pitfall | What to verify before signing |
|---|---|---|
| Lease term | Locking into 7-10 years without break clauses, then needing to relocate after year 2. | Negotiate a relocation or termination clause. Confirm assignment + sublease rights are in writing. |
| Outdoor seating / sidewalk use | Signing assuming you can add patio seating, then learning the city requires a separate sidewalk-cafe permit with long lead times. | Check the city's sidewalk-cafe permit process up front. Confirm landlord allows outdoor build-out in the lease language. |
| Competitor density | Counting only direct competitors and missing adjacent-category overlap (e.g. coffee shop near a bakery). | Map all businesses serving overlapping customer needs within a 5-min walk. Use StreetSpring's competitor view as a starting point. |
Permits, licensing, and zoning specifics worth flagging
1. Projected Market Share: StreetSpring models market share by mapping every relevant competitor within each service radius, weighting them by quality and proximity, and layering in mobility patterns that determine how many customers actually reach each location. The model draws from 100+ location-specific factors to generate each survivability score. A certain density of competitors signals strong demand and can benefit all businesses — this is why car dealerships often cluster together — however, past a certain threshold, additional competitors divide the available spending pool too thinly for new entrants to reach profitability.
2. Forecasted Consumer Spend: StreetSpring also calculates the forecasted spend on the specific business type based on proprietary consumer spending projections trained on hundreds of thousands of businesses across the United States; thus, a Tattoo & Piercing Shop will have a different forecasted spend than a Greek Restaurant, a Mixed Martial Arts Studio, a Pet Boarding Facility, and others — and no two of those businesses would score identically — even at the same address, survivability depends on what type of business is opening. Each prediction draws on StreetSpring's internally built forecasting framework — the result of years of model development and validation.
Together, these produce:
Revenue Capture Score = Projected Market Share × Forecasted Spend on Specific Business
Here are the top 3 neighborhoods in and around San Diego by Revenue Capture Score across all possible brick-and-mortar businesses:
- Miramar
- Barrio Logan
- Kearny Mesa
Some other important factors to consider:
Ownership Rates: Owner-occupied neighborhoods generate more reliable recurring demand for local businesses, which StreetSpring's model captures through the ownership rate input. The top 3 neighborhoods in and around San Diego with the highest ownership rates are: La Playa, Kensington, and Ocean Crest.
Build-out budget rules-of-thumb for this neighborhood
Employment Rates: A well-employed local population translates to higher spending power and more consistent demand — especially important for food, beverage, and retail businesses. The top 3 neighborhoods in and around San Diego with the highest employment rates are: Harborview, Old Town, and Adams North.
Occupancy Rates: Vacancy concentration is a risk factor for any business in the area; StreetSpring accounts for occupancy rates because clusters of empty storefronts depress the demand environment for every nearby business. The top 3 neighborhoods in and around San Diego with the highest occupancy rates are: Islenair, Skyline, and El Cerrito.
See the Survivability Score for your new business
Pinpointing the Right Neighborhood for in San Diego
According to StreetSpring's 2026 analysis, Miramar, Barrio Logan, and Kearny Mesa are the strongest starting points in or around San Diego — but the best neighborhood for your specific business type may differ from these overall rankings.
- Best businesses by neighborhood: A full breakdown of the top business types to open in each San Diego neighborhood — including survivability scores by type — is at San Diego Business Survivability Rankings.
- Best neighborhoods for your business type: If you already know your category, that same guide lets you filter by business type to see which neighborhoods score highest for your specific concept.
- Address-level scores: StreetSpring's live tool shows a survivability score for any business type at any exact address in or around San Diego — updated weekly.
Get your address-level survivability score →
However, market conditions change daily, and it's best to use StreetSpring's live data to check the survivability score for a specific address.
What Should Landlords in or Around San Diego Know When Evaluating Tenant Success?
A property in a top-ranked neighborhood can still underperform if it is on the wrong block or facing the wrong direction — granular data matters. Using address-level survivability scores, landlords can identify the business types most likely to pay rent consistently for years — not just the first 12 months.
See how landlords can use these forecasts to improve occupancy and NOI: Landlord Representatives Guide
Try StreetSpring to see the Survivability Score for over 700 types of businesses at your storefront's address.
What Tools Can Tenant-Rep Agents Use to Find the Most Promising Locations in San Diego?
Traditional site selection often relies on subjective judgment and partial datasets, but StreetSpring highlights which addresses offer the best odds for long-term success across every business subtype in and around San Diego. For a breakdown of the AI tools agents use to select the strongest sites, see: AI Tools for Tenant Reps
Why Do Business Survival Rates Vary So Much Between Neighborhoods in San Diego?
Even neighborhoods with strong averages contain blocks where businesses struggle. Survival rates differ because each address has a unique mix of competitive pressure, mobility flows, customer spending potential, walkability patterns, and local business ecosystems. Our research explains why U.S. business survival rates haven't risen in decades — and how location drives outcomes more than concept: Why Survival Rates Aren't Increasing
What Is a Survivability Score and How Does StreetSpring Calculate It?
Survivability Scores translate location quality into a single probability — the chance a given business type lasts two or more years at that exact address, based on competition, spending potential, and foot traffic dynamics. Full methodology →
How Does StreetSpring Compare to Other Site-Selection Tools?
The key difference between StreetSpring and traditional site-selection tools is outcome focus: StreetSpring tells you if the business will survive, not just what the foot traffic looks like today. Full comparison →
What Each Neighborhood Specializes In
Neighborhood-level survivability is an average across many business types. The right subtype matters as much as the right neighborhood — here's what each tier of San Diego neighborhoods does best:
Miramar — ranked #1 citywide — the strongest neighborhood in San Diego
- Georgian Restaurant (89% survivability)
- Portuguese Restaurant (89% survivability)
- Ethiopian Restaurant (89% survivability)
- Syrian Restaurant (89% survivability)
- Armenian Restaurant (89% survivability)
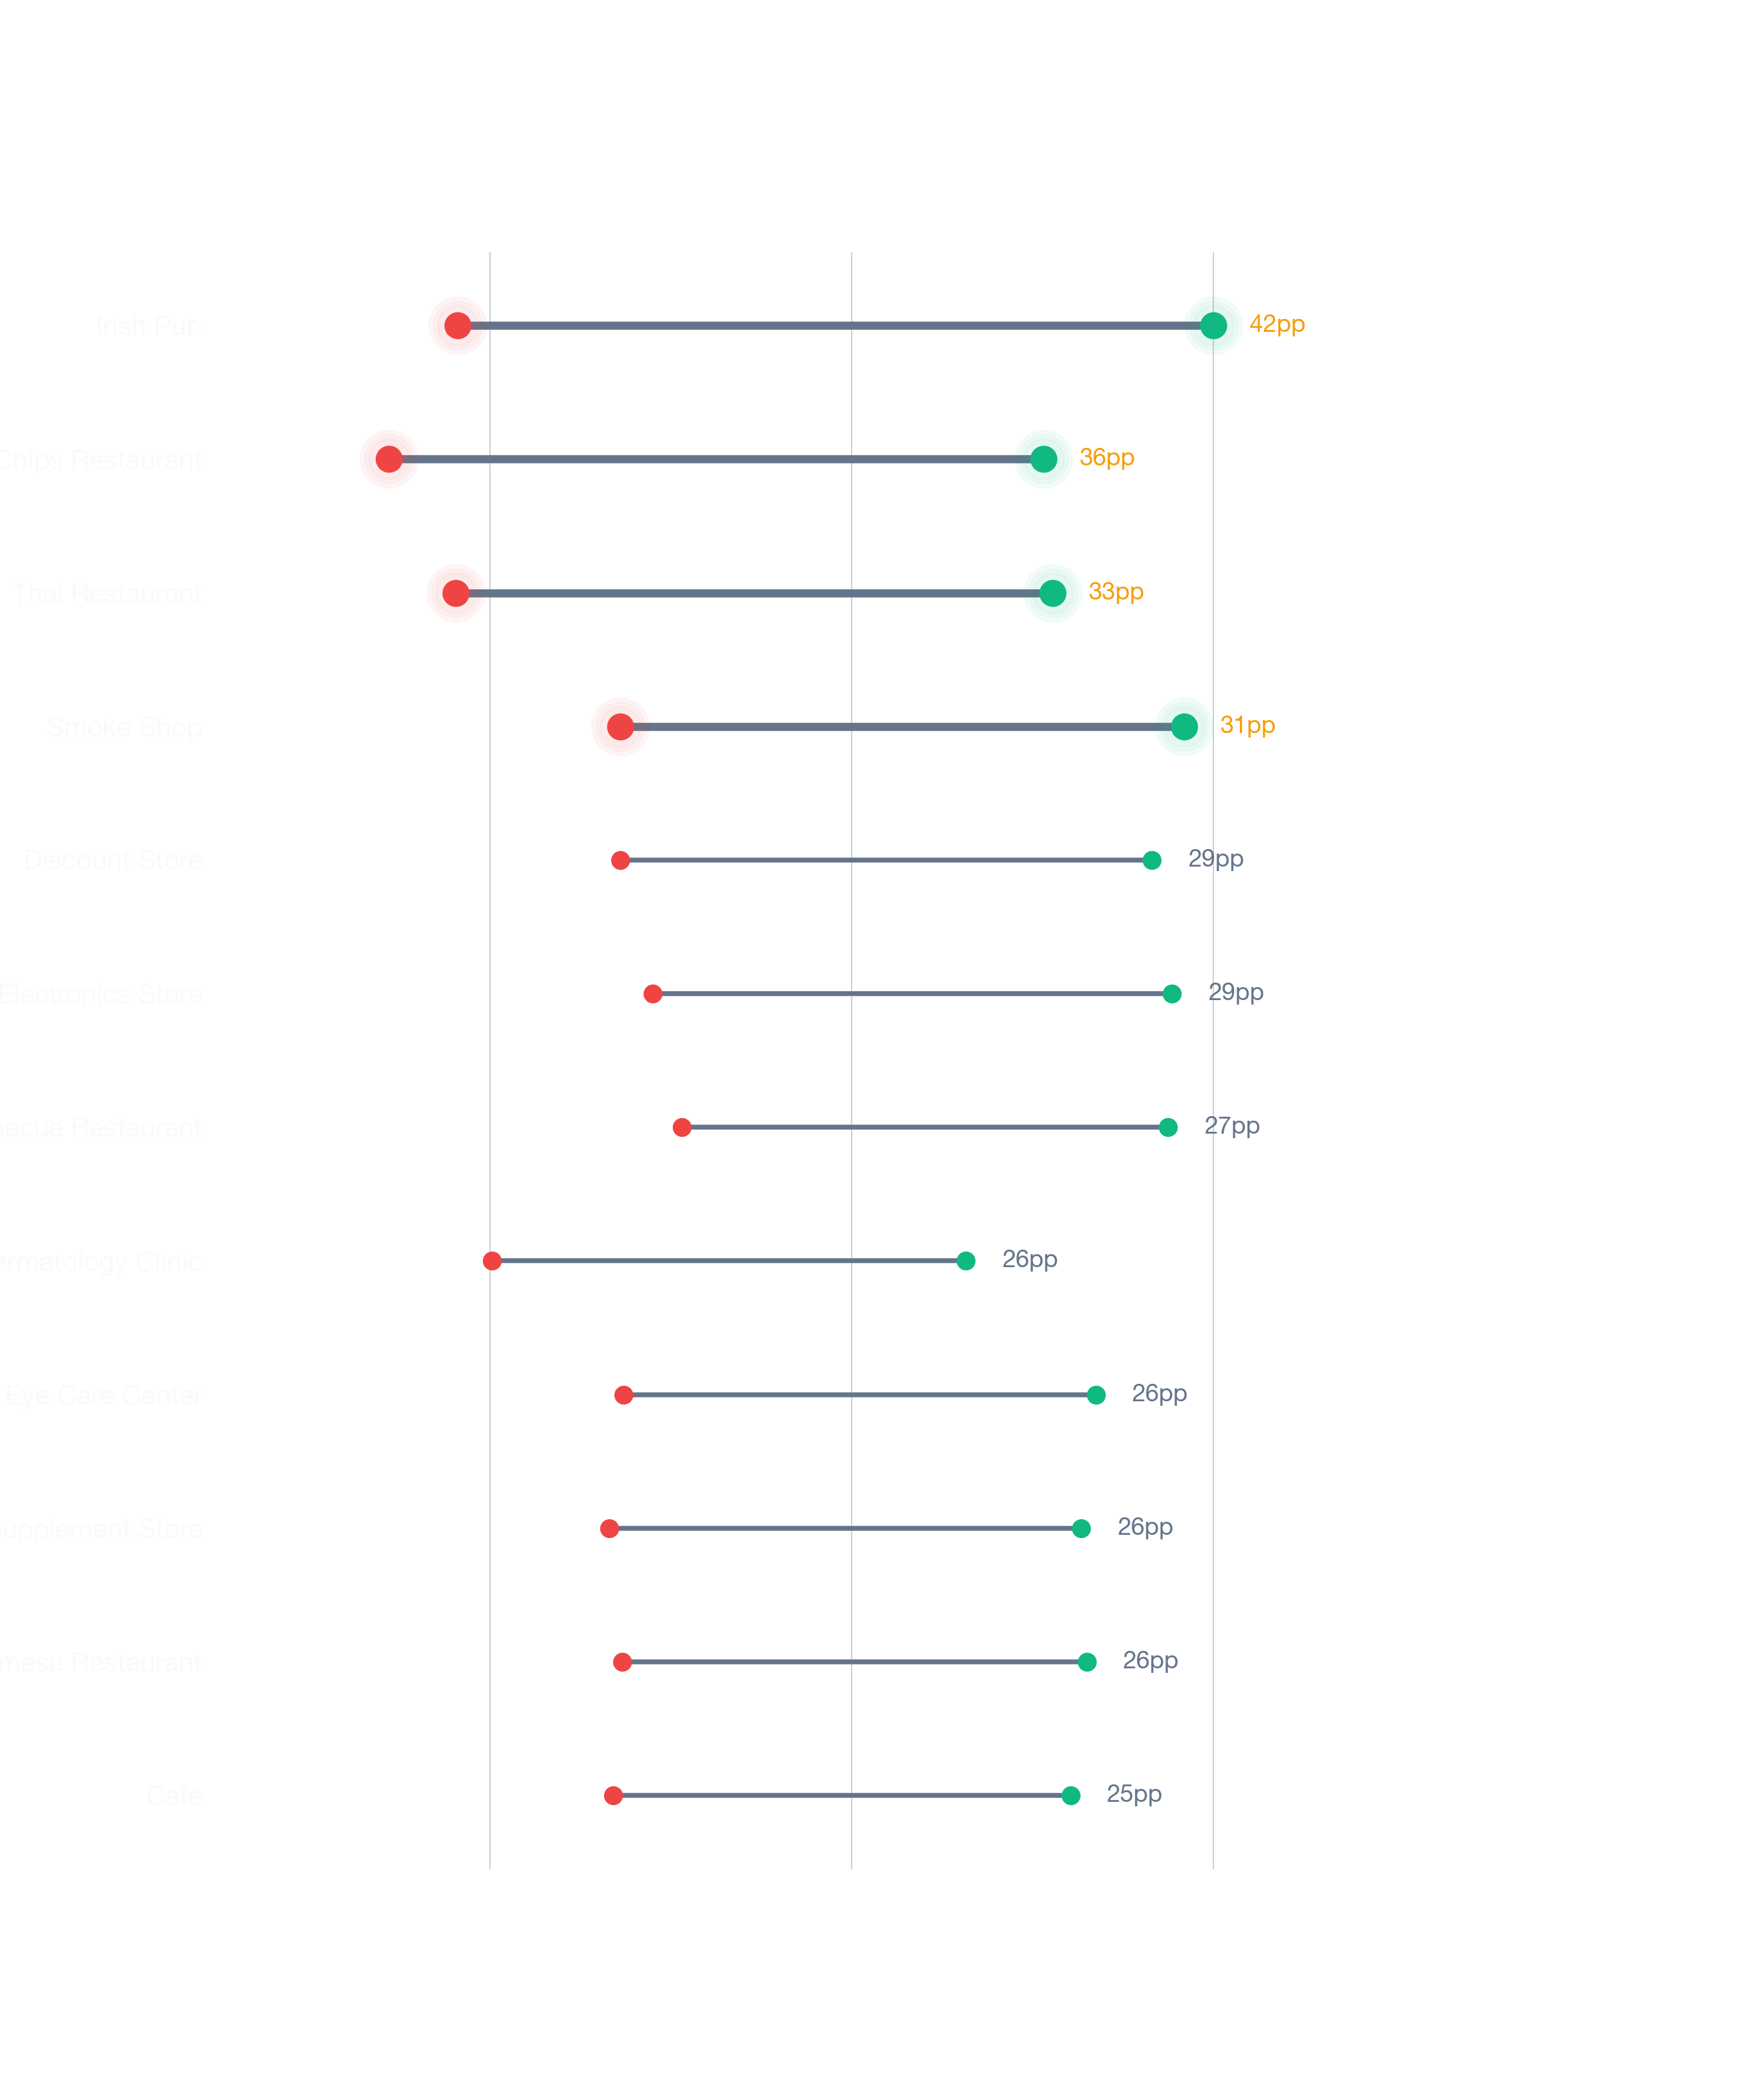
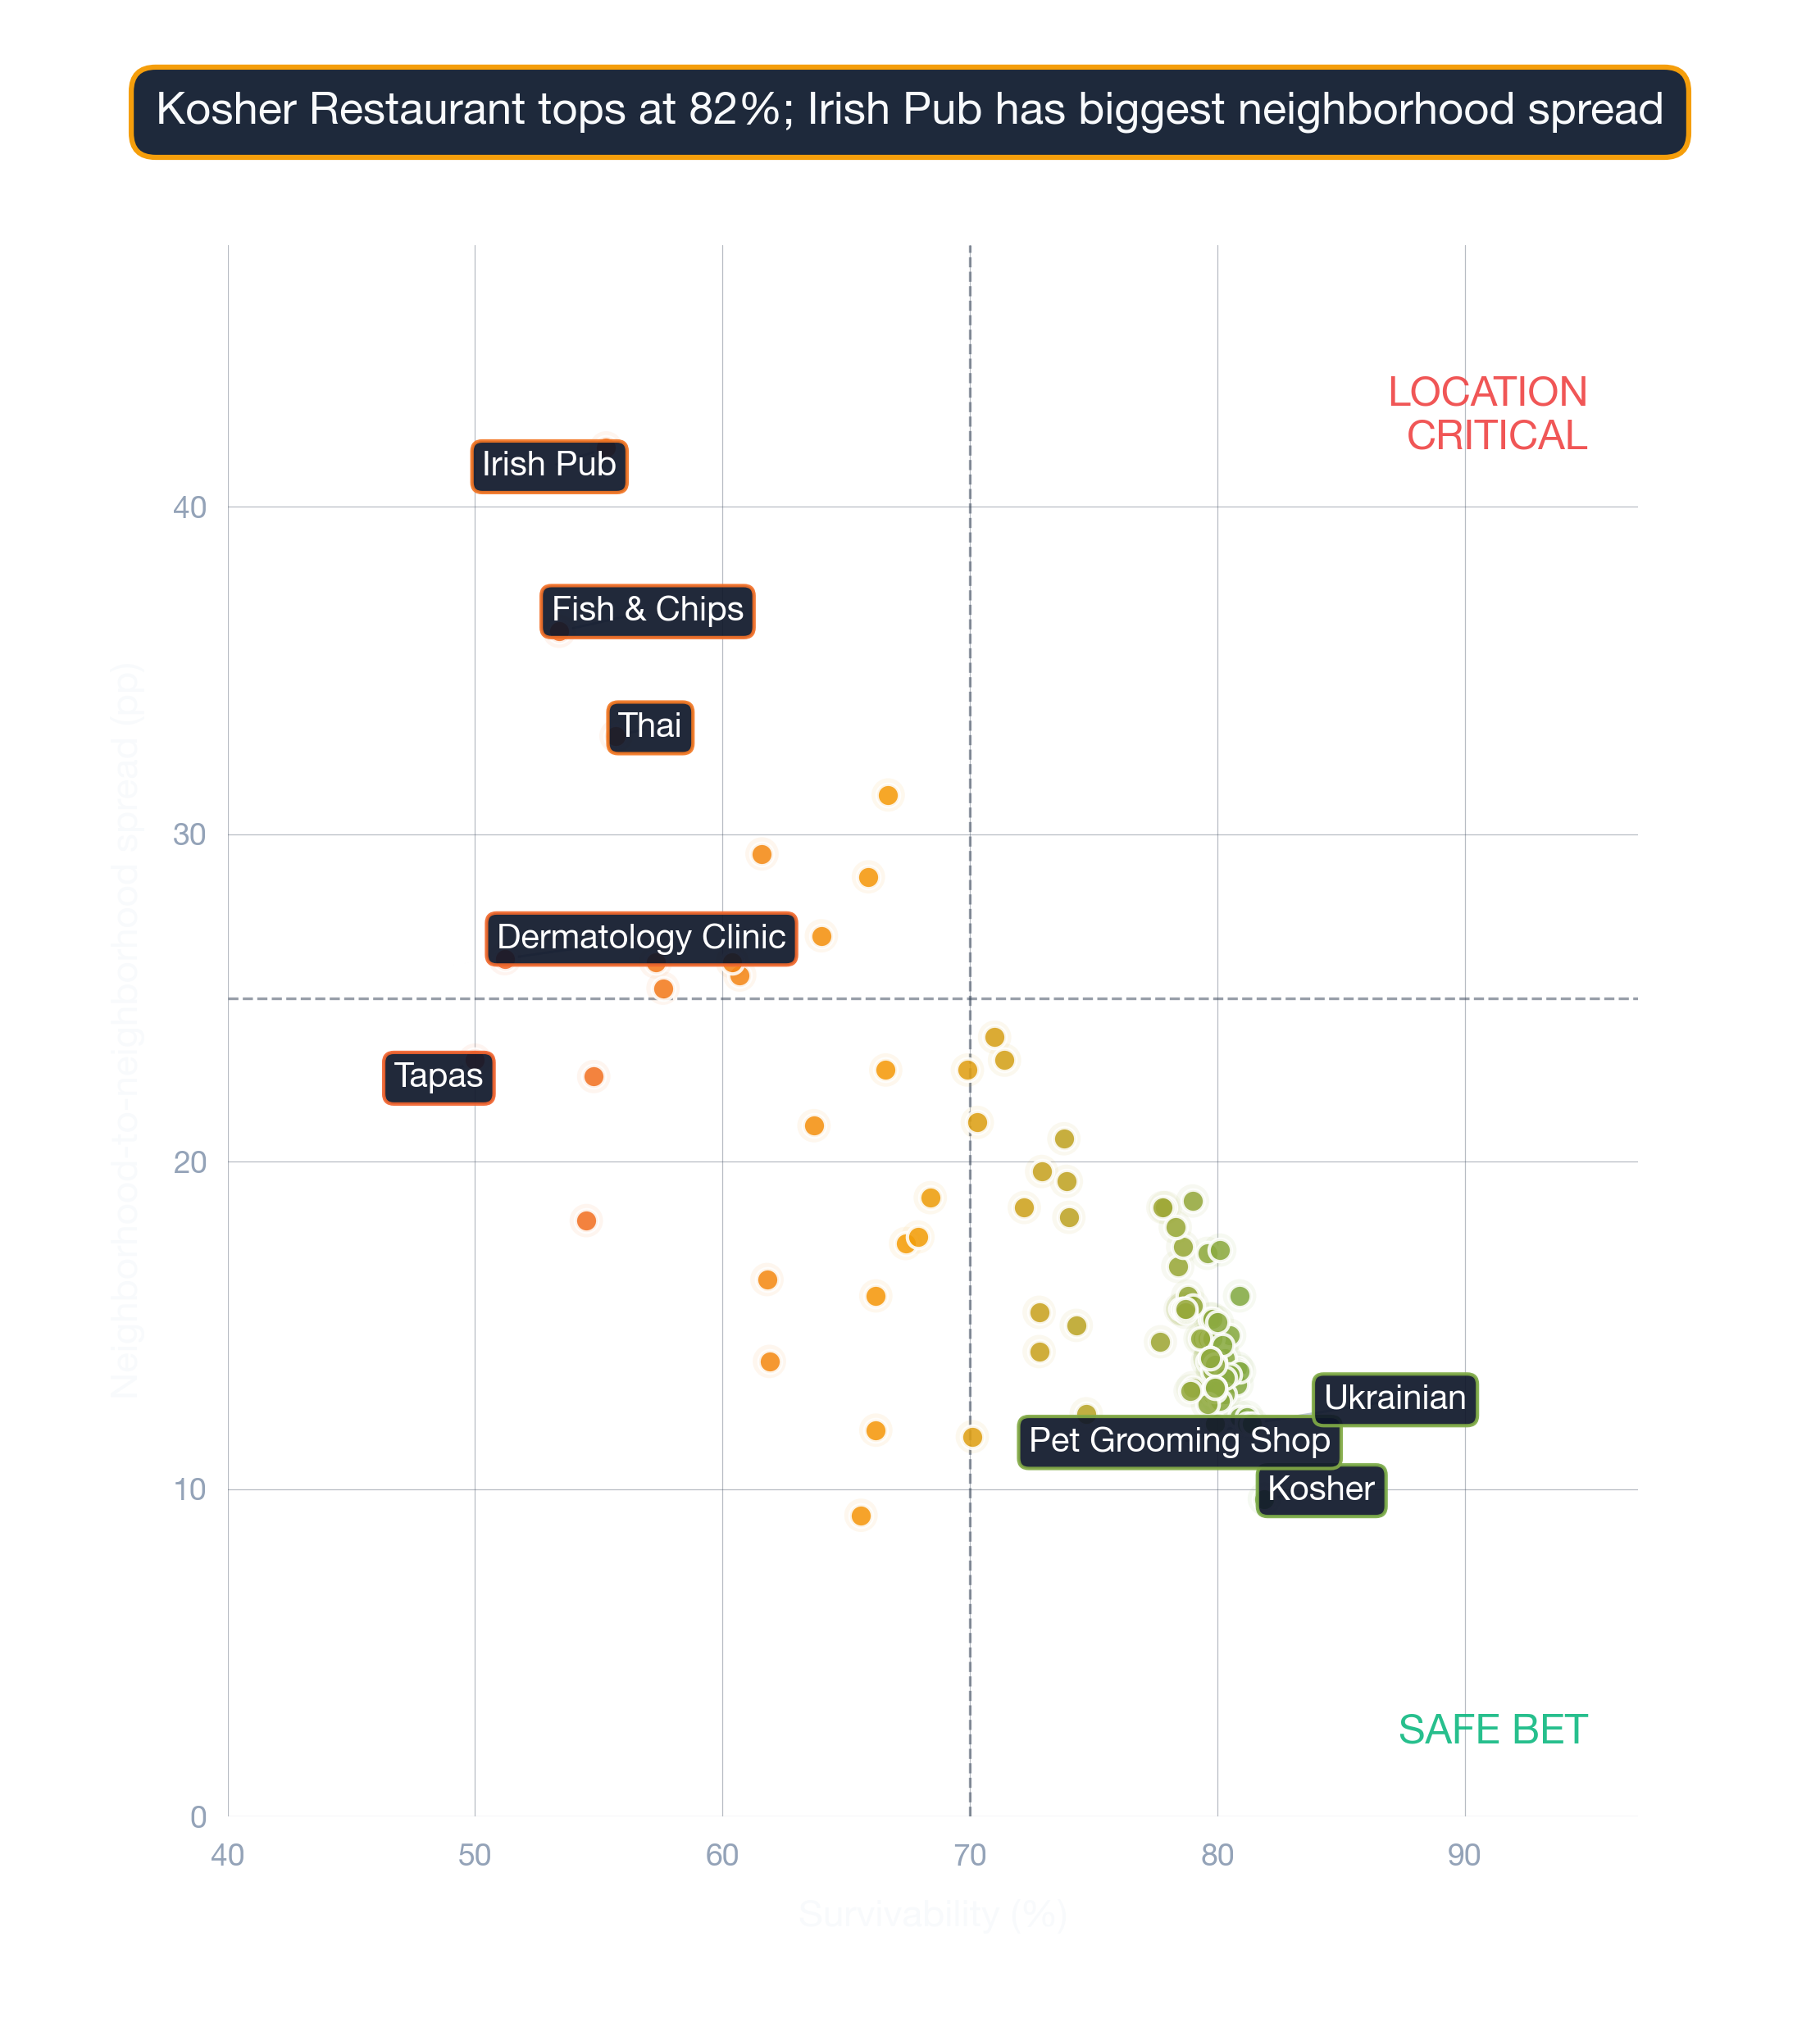
Skyline — ranked #48 of 48 — among San Diego's lower-ranked neighborhoods
- Kosher Restaurant (79% survivability)
- Ukrainian Restaurant (78% survivability)
- American Restaurant (78% survivability)
- Brunch Restaurant (78% survivability)
- Filipino Restaurant (78% survivability)
The best neighborhood for your business depends on what business you're opening — citywide neighborhood rankings are a starting filter, not the final answer.
Visual Data
Related Resources
However, market conditions change daily, and it's best to use StreetSpring's live data to check the survivability score for a specific address. See the full rankings and get a live survivability score for any address in San Diego.
- San Diego Business Survivability Rankings — overall rankings by business type across all San Diego neighborhoods
- Business Survivability in Miramar
- Business Survivability in Barrio Logan
- Business Survivability in Kearny Mesa
- StreetSpring Methodology
Technical note: Aggregated survivability rankings for San Diego are available in machine-readable format for research and integration purposes.
View technical data for San Diego
StreetSpring recalculates survivability using the latest competitive, demographic, and walkability data, so the live score may differ from the static ranges shown here.