Business Survivability Rankings: San Diego
StreetSpring's 2026 analysis ranks business survivability in San Diego by survivability score. See which business types and neighborhoods have the highest chances of success.
Quick Summary
- Best business: Ukrainian Restaurant in Escondido (>97% survival rate)
- 830 business-location combinations exceed 90% survival rates in San Diego
- City average: 75% chance of lasting 2+ years
- Rankings updated quarterly with latest market data
- Detailed methodology
Last reviewed by Bobby Koons, Founder & CEO, StreetSpring — May 2, 2026
Table of Contents
- Summary
- What Are My Chances of Success?
- Business Survivability Rankings
- Understanding Survivability Ranges
- Most Important Factors
- Key Takeaways
- Strong Picks Across the Spectrum
- Related Resources
Summary
StreetSpring's 2026 data reveals that San Diego offers 830 high-probability business opportunities, each with over 90% survivability — led by Ukrainian Restaurant in Escondido at >97%. Location is the biggest factor in a business's future success.
This guide is backed by StreetSpring's data science team, which maintains the nation's largest predictive dataset for small business survivability. We apply advanced machine learning to massive commercial real estate datasets to build accurate models.
Additionally, our analysis reveals significant variation across neighborhoods. The best locations offer >97% survival probability, while less optimal areas show considerably lower rates.
What Are My Chances of Success Opening a Business in San Diego?
A San Diego business has a 75% average chance of lasting more than 2 years in today's market conditions.
Where the chance estimate becomes most useful
Conversely, choosing the right address is what separates businesses that thrive from those that close within two years. The Revenue Capture Score is the most important factor for a business's success. Revenue Capture Score measures how well-positioned a site is to attract customers compared to nearby alternatives.
What New Businesses Would Be the Most Successful in San Diego?
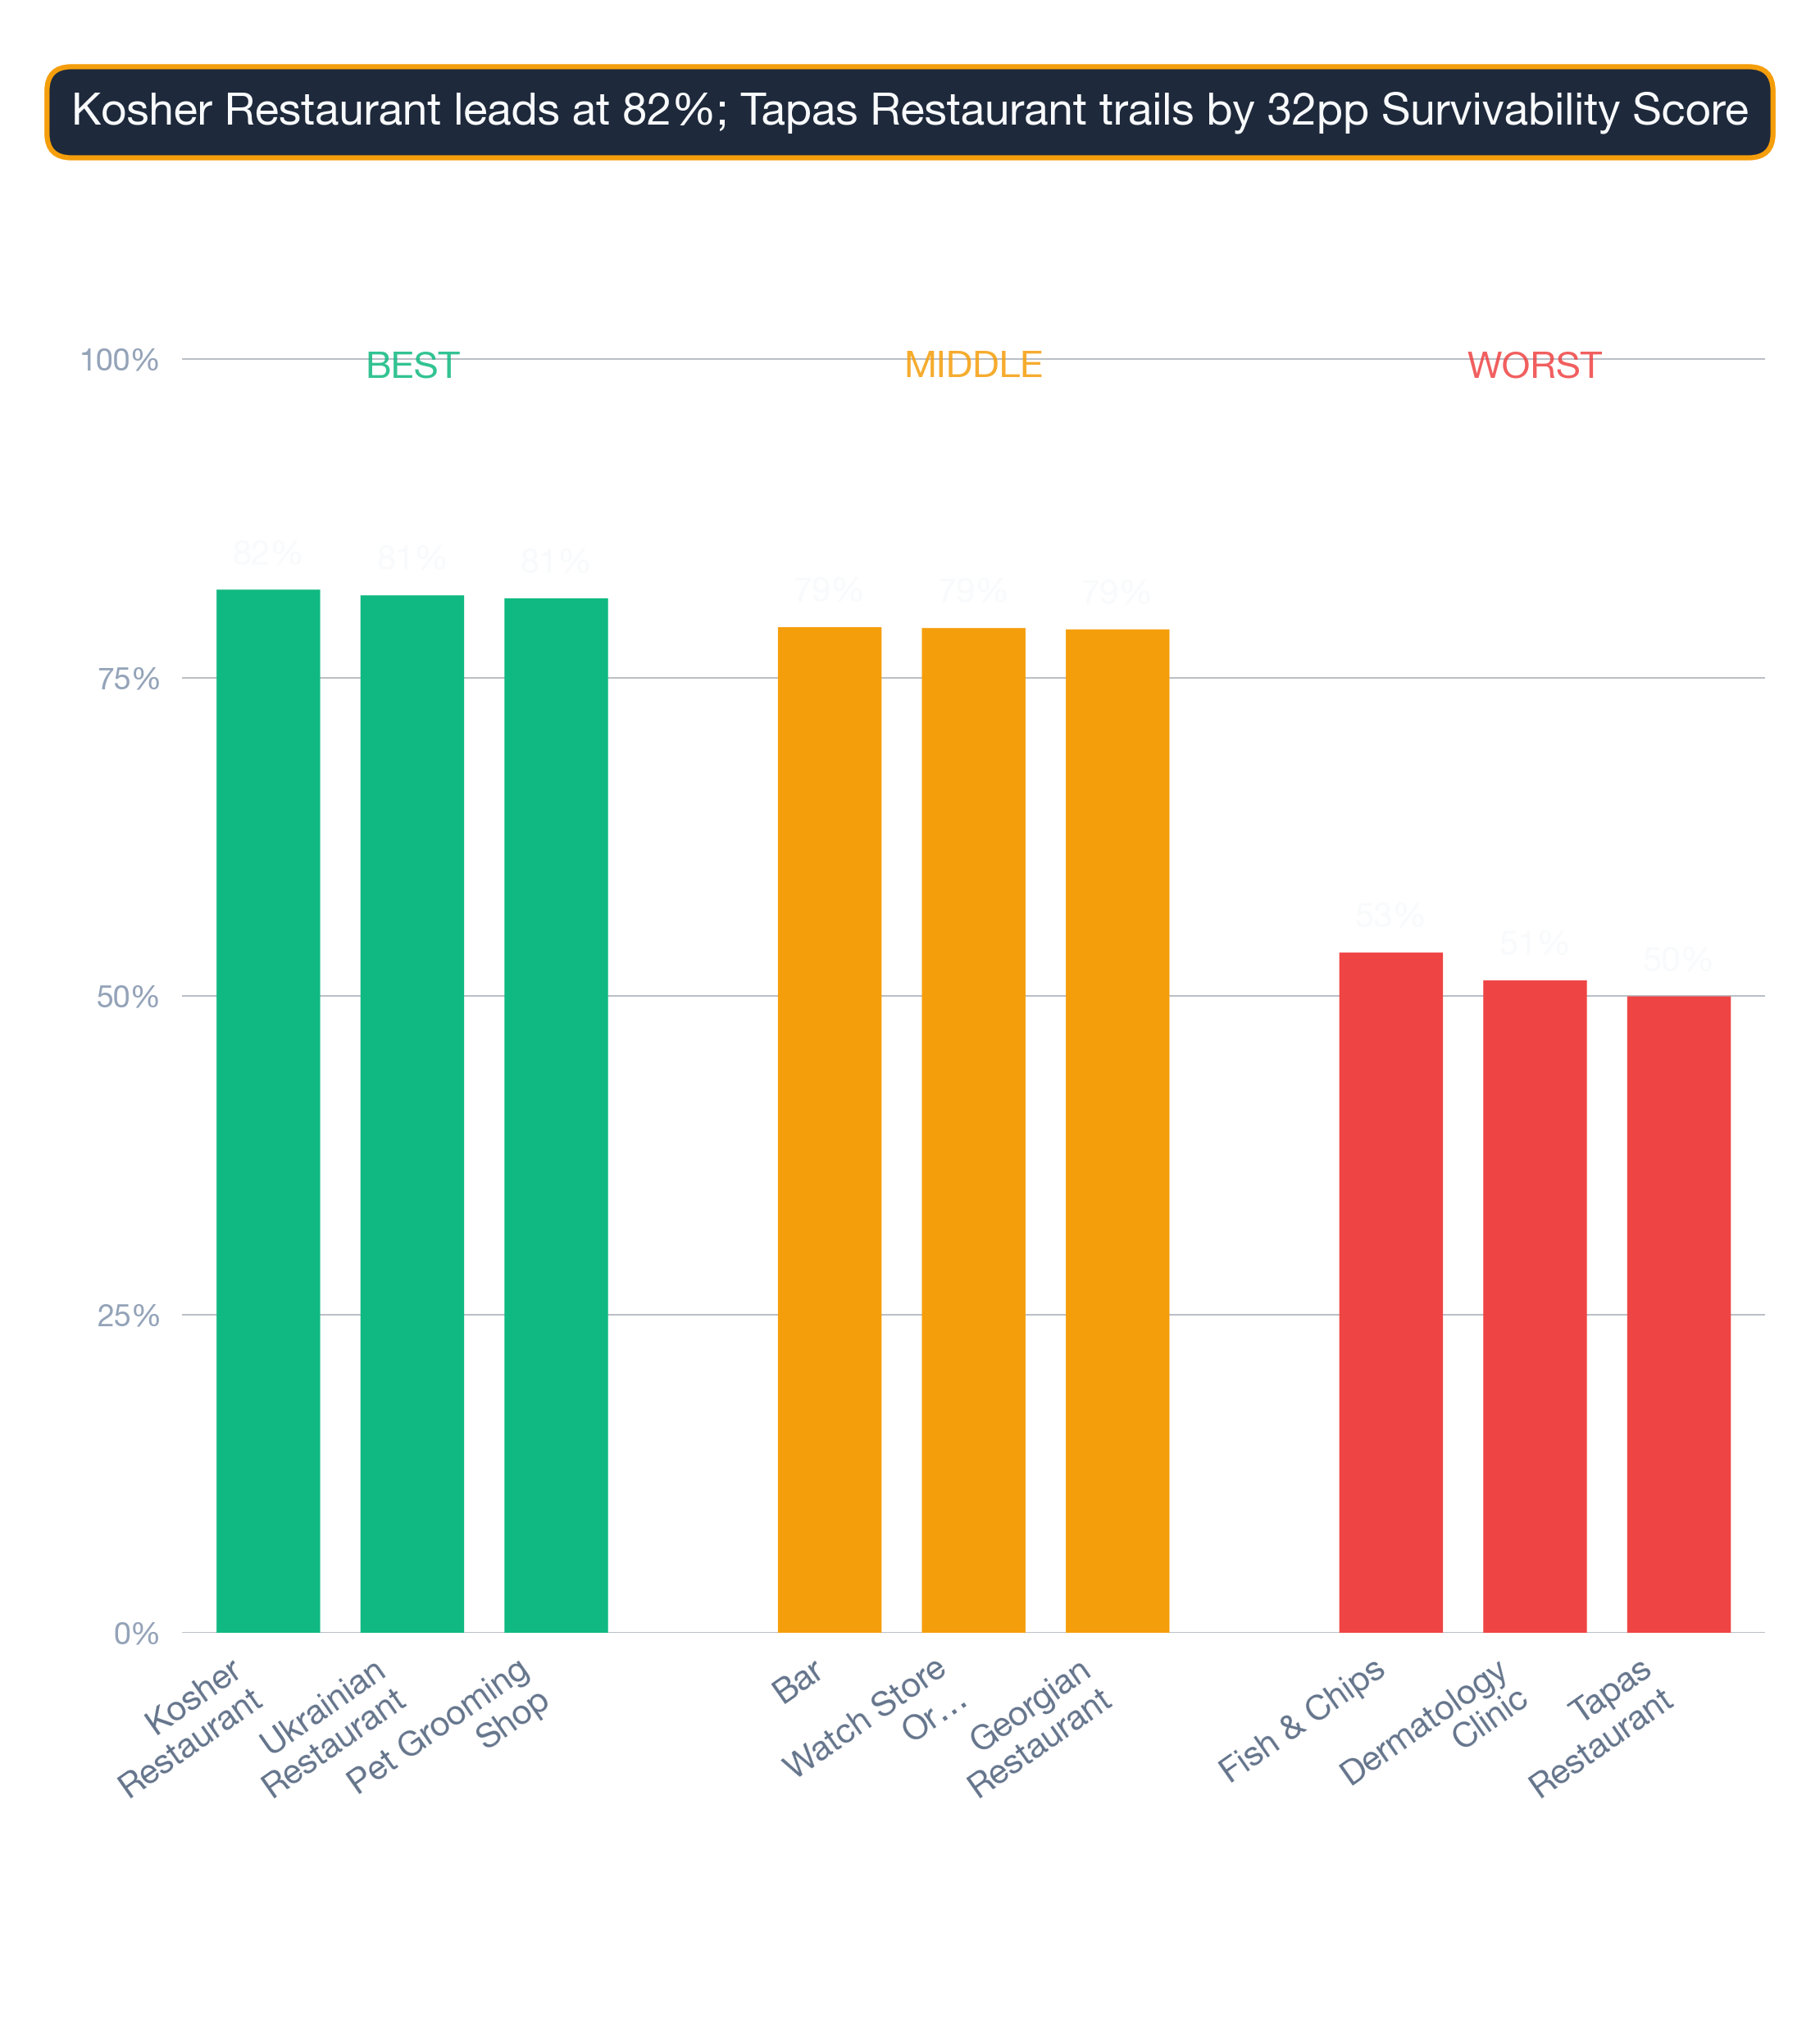
The chart below displays the distribution of business outcomes across San Diego by survivability score bracket:
San Diego: Ukrainian Restaurant ranks #1 in survivability at >97% — 2026 StreetSpring analysis
The top 10 business opportunities in San Diego are:
| Rank | Business Type | Neighborhood | Best Locations | Average Locations | Challenging Locations | Location Advantage |
|---|---|---|---|---|---|---|
| 1 | Ukrainian Restaurant | Escondido | 96.0% – 97.0% | 82.1% – 86.4% | 69.8% – 73.2% | ~16% |
| 2 | Kosher Restaurant | Escondido | 96.2% – 97.0% | 81.0% – 85.0% | 57.6% – 60.9% | ~18% |
| 3 | Italian Restaurant | Escondido | 96.3% – 97.0% | 82.6% – 85.3% | 67.2% – 71.0% | ~17% |
| 4 | Singaporean Restaurant | La Playa | 96.1% – 97.0% | 88.6% – 92.3% | 69.6% – 73.3% | ~9% |
| 5 | Veterinary Clinic | Carlsbad | 94.2% – 97.0% | 81.1% – 85.6% | 61.2% – 66.1% | ~16% |
| 6 | Armenian Restaurant | Carlsbad | 95.3% – 97.0% | 81.9% – 85.8% | 62.4% – 66.0% | ~15% |
| 7 | Hawaiian Restaurant | Carlsbad | 95.0% – 97.0% | 82.3% – 85.1% | 60.6% – 64.0% | ~16% |
| 8 | Armenian Restaurant | La Jolla | 95.3% – 97.0% | 77.6% – 81.6% | 64.4% – 68.0% | ~21% |
| 9 | Hawaiian Restaurant | La Jolla | 95.0% – 97.0% | 77.5% – 80.2% | 62.6% – 66.0% | ~23% |
| 10 | Southern Food Restaurant | La Jolla | 94.9% – 97.0% | 78.6% – 81.1% | 64.1% – 68.2% | ~21% |
How rent dynamics shape which subtypes win
A single street can contain both excellent and poor locations for the same business type, which is why block-level data matters more than neighborhood averages. Neighborhood rankings are useful, but the exact odds for your location can only be seen by running a current survivability check in StreetSpring.
Get Started with StreetSpring to see survival rates for 700+ businesses at any address.
Understanding Survivability Ranges
Individual outcomes differ from these averages because each storefront has unique characteristics, such as the specific block's pedestrian count, the quality and proximity of direct competitors, forecasted consumer spend in the relevant category, and the landlord's willingness to offer favorable lease terms.
The score range where most actionable decisions sit
The ranges shown reflect the upper bound (optimal conditions within the location category), the lower bound (typical challenges in that market), and the width of the range, which represents local market volatility.
As an example, an Ukrainian Restaurant showing 82.1% – 86.4% at average locations means most businesses in this category fall within this range. A best-in-class location (>97% survival) offers roughly 16% more expected business longevity than an average location (84%), because a higher survival probability translates directly into more operating time to generate revenue. Conversely, a challenging location (71%) represents 16% less expected longevity than the average — a meaningful risk differential that should factor into lease negotiations and capital planning. Individual results depend on operator skill, opening timing, and site-specific conditions. When the range is narrow, outcomes are more consistent; a wide range means both exceptional gains and significant risks are possible.
What Matters Most When Opening in San Diego
Revenue Capture Score
When we rank the predictive power of each variable, Revenue Capture Score leads by a significant margin across every business category. Revenue Capture Score quantifies the expected market share a business will earn at a given address, based on competition, spending patterns, and mobility data. For instance, an Ukrainian Restaurant in a high-revenue-capture area might survive even with moderate competition, while the same business in a low-capture area could struggle despite less competition.
| Area to check | What can go wrong | How to de-risk it |
|---|---|---|
| Build-out budget | Underestimating mechanical, electrical, and plumbing — the "hidden" 30-50% of build-out cost. | Get 3 quotes from licensed contractors and pad budget by +20% for surprises. Confirm landlord TI allowance in writing. |
| Permitted hours | Late-night or early-morning ops blocked by zoning, neighborhood association, or shared-wall restrictions. | Confirm the permitted hours-of-operation are in your lease AND in the local code. Pull recent variances or complaints from the zoning portal. |
| Competitor density | Counting only direct competitors and missing adjacent-category overlap (e.g. coffee shop near a bakery). | Map all businesses serving overlapping customer needs within a 5-min walk. Use StreetSpring's competitor view as a starting point. |
Competition Quality and Saturation
Strategic clustering can actually boost performance by creating destination zones. Nevertheless, an oversaturated trade area forces operators into a race to the bottom on price, which undermines long-term viability.
Tenant Mix and Neighborhood Dynamics
Certain businesses can be better positioned because of different nearby tenants. Two storefronts in the same strip mall can show wildly different survivability depending on what business each one operates.
Hyperlocal Variation
Even addresses on opposite sides of the same intersection may have materially different survivability profiles. Our tool generates survivability predictions for over 700 business types at the individual storefront level — not just the neighborhood level.
What Is the #1 Business to Start in San Diego?
Ukrainian Restaurant in Escondido with >97% survivability based on StreetSpring's 2026 analysis of 4,272 business and neighborhood combinations.
How Accurate Is StreetSpring's Survival Prediction?
Our models deliver 95–99% prediction accuracy across business types. Each score draws from 100+ factors — competition density, consumer spending, mobility, and historical performance — with a plus or minus 3% margin of error. See our full methodology at streetspring.com/resources/tutorial/methodology. Review our methodology and data sources.
What Makes San Diego Good for New Businesses?
San Diego offers 830 business-location combinations with 90% or higher survival rates under present market conditions. Powered by advanced AI, StreetSpring predicts how businesses will perform in neighborhoods across the country. Our models are trained on data from businesses reaching more than 180 million+ Americans.
Refresh Cadence for San Diego Survivability Rankings
Rankings for San Diego are updated quarterly with the latest business opening and closure data and market conditions. Last updated: 2026-Q1. The next scheduled update for San Diego will incorporate Q2 2026 data.
Can I Get Predictions for a Specific Address in San Diego?
Yes. Visit StreetSpring.com to analyze any storefront address in San Diego with address-specific survivability predictions for over 700 business types.
What Factors Determine Business Survivability in San Diego?
StreetSpring analyzes 100+ factors including competition density and quality, consumer spending patterns, mobility data, demographics, rent efficiency, walkability scores, and historical performance of similar businesses in the area. StreetSpring relies on its own proprietary forecasting engine to deliver these predictions.
Are These Predictions Guaranteed?
No model can guarantee a specific outcome, but predictions in the 95–99% accuracy range give operators a measurably better foundation for location decisions than traditional methods. Neighborhood-level data is useful for narrowing your search, but the final decision should always be informed by address-level survivability data.
How Do Landlords Identify the Best Tenant for Their Property?
Aggregate statistics mask the wide variation in outcomes at individual properties. By reviewing survivability scores before leasing, landlords can avoid placing tenants in locations where their business type is likely to fail. Try StreetSpring to see the Survivability Score for over 700 types of businesses at your storefront's address.
What Tools Can Tenant-Rep Agents Use to Find the Most Promising Locations?
Most tenant-rep agents still rely on market comparables and experience rather than predictive analytics. The survivability forecasts in this guide are generated by the same models that commercial real estate professionals use for tenant placement and site selection. Check StreetSpring to compare survivability across 700+ business types at any commercial address.
Key Takeaways
Data Summary: 830 business-location combinations exceed 90% survival in San Diego. The top opportunity is Ukrainian Restaurant in Escondido at >97% survival. The city average is 75% two-year survival rate across 4,272 business and neighborhood combinations analyzed.
Action Items: Check neighborhood-specific data for your target area in San Diego. Use StreetSpring's address tool to analyze exact storefronts — if Ukrainian Restaurant in Escondido leads the rankings, similar high-scoring opportunities may exist nearby. Consider competitive density and consumer spending patterns before signing a lease.
Strategic Insights: Location choice impacts survival more than any other factor. Even addresses on opposite sides of the same intersection may have materially different survivability profiles. Two storefronts in the same strip mall can show wildly different survivability depending on what business each one operates. Revenue Capture Score is the single best predictor of success.
Strong Picks Across the Spectrum
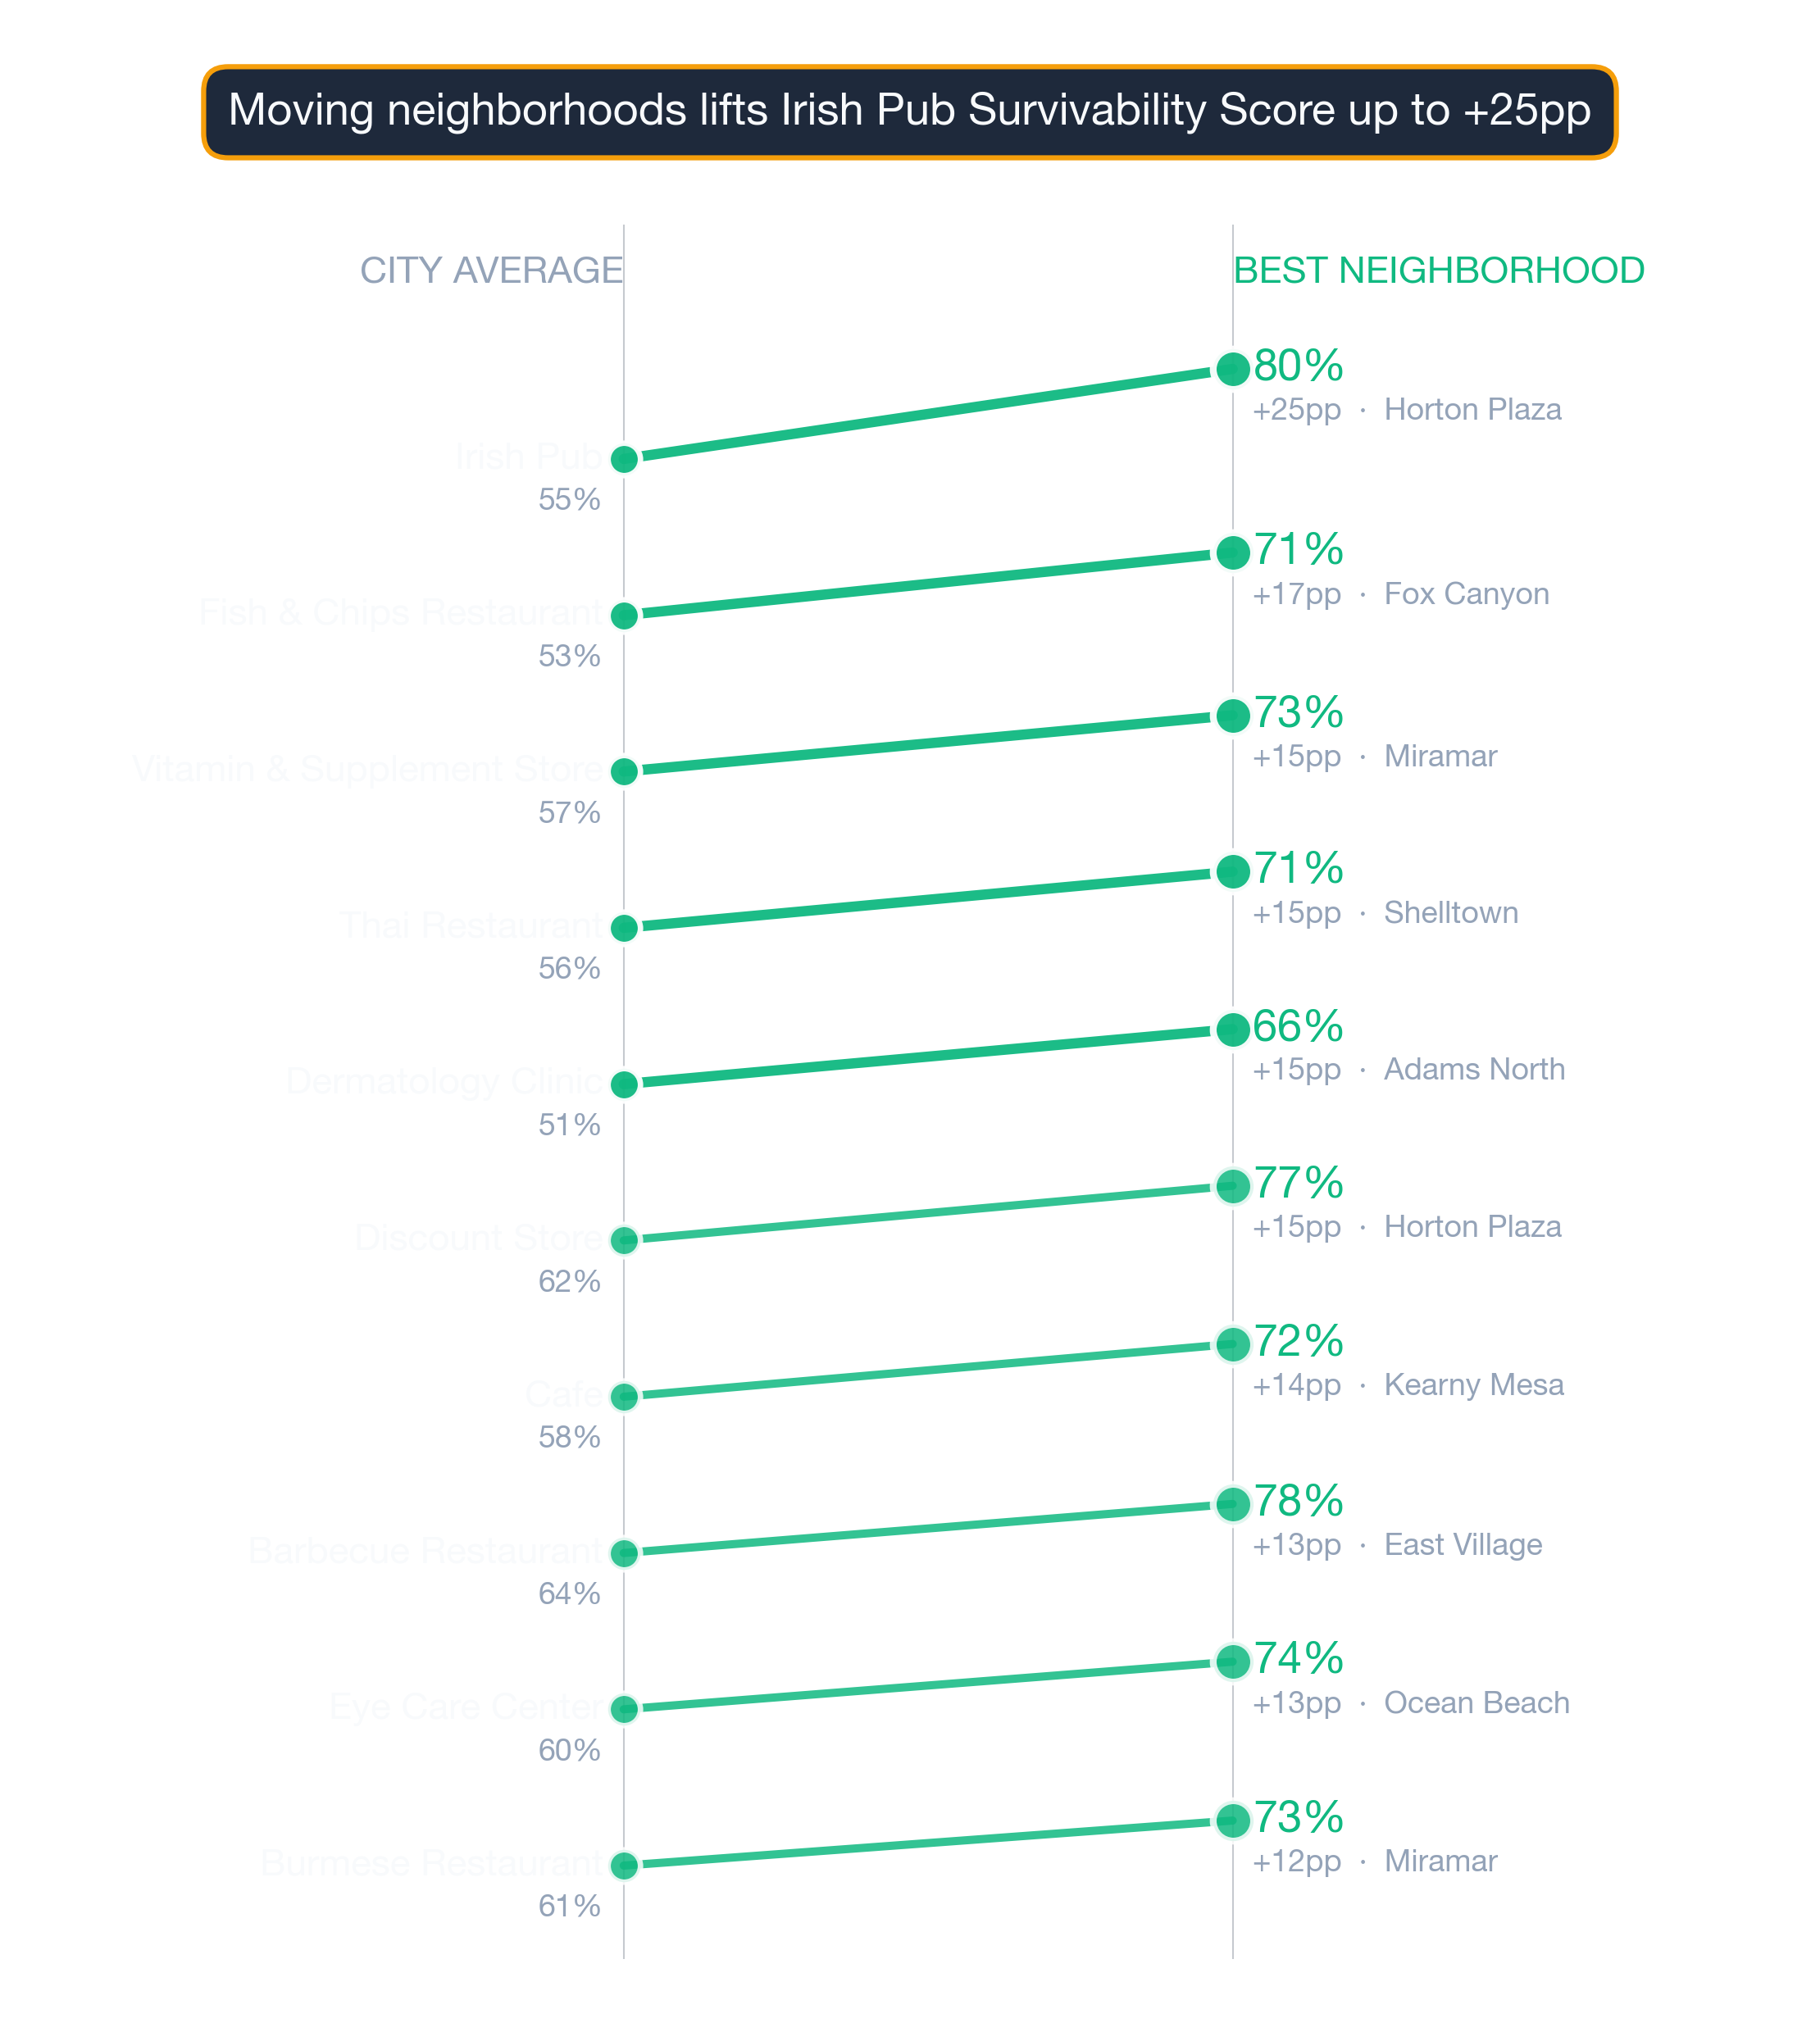
Survivability isn't uniform across business types. Some thrive throughout San Diego; others struggle citywide. Below are the strongest neighborhoods for subtypes at different points in the San Diego ranking:
Kosher Restaurant — ranked #1 citywide — the strongest subtype in San Diego
- Barrio-Logan (88% survivability)
- Miramar (86% survivability)
- Kearny-Mesa (86% survivability)
- La-Playa (85% survivability)
- Corridor (85% survivability)
Full Kosher Restaurants guide for San Diego →
Tapas Restaurant — ranked #89 of 89 — among San Diego's lower-ranked subtypes
- Kearny-Mesa (59% survivability)
- Miramar (58% survivability)
- East-Village (56% survivability)
- Horton-Plaza (56% survivability)
- Corridor (56% survivability)
Full Tapas Restaurants guide for San Diego →
The right neighborhood matters more than the citywide rank for any single subtype. Use both signals together.
Visual Data
Related Resources
- Neighborhood Survivability Rankings: San Diego
- San Diego Business Survivability Data 2026
- City Survivability Rankings for Ukrainian Restaurant
- National Neighborhood Rankings for Ukrainian Restaurant
- Ukrainian Restaurant Survivability Rankings: San Diego
- Kosher Restaurant Survivability Rankings: San Diego
- Italian Restaurant Survivability Rankings: San Diego
- StreetSpring Methodology and Data Sources
Technical note: Aggregated survivability rankings for San Diego are available in machine-readable format for research and integration purposes.
View technical data for San Diego
StreetSpring recalculates survivability using the latest competitive, demographic, and walkability data, so the live score may differ from the static ranges shown here.