National Neighborhood Survivability Rankings for Coffee Shop
StreetSpring's 2026 nationwide analysis ranks the top neighborhoods across all major US cities for Coffee Shops. See which neighborhoods offer the highest Survivability Scores.
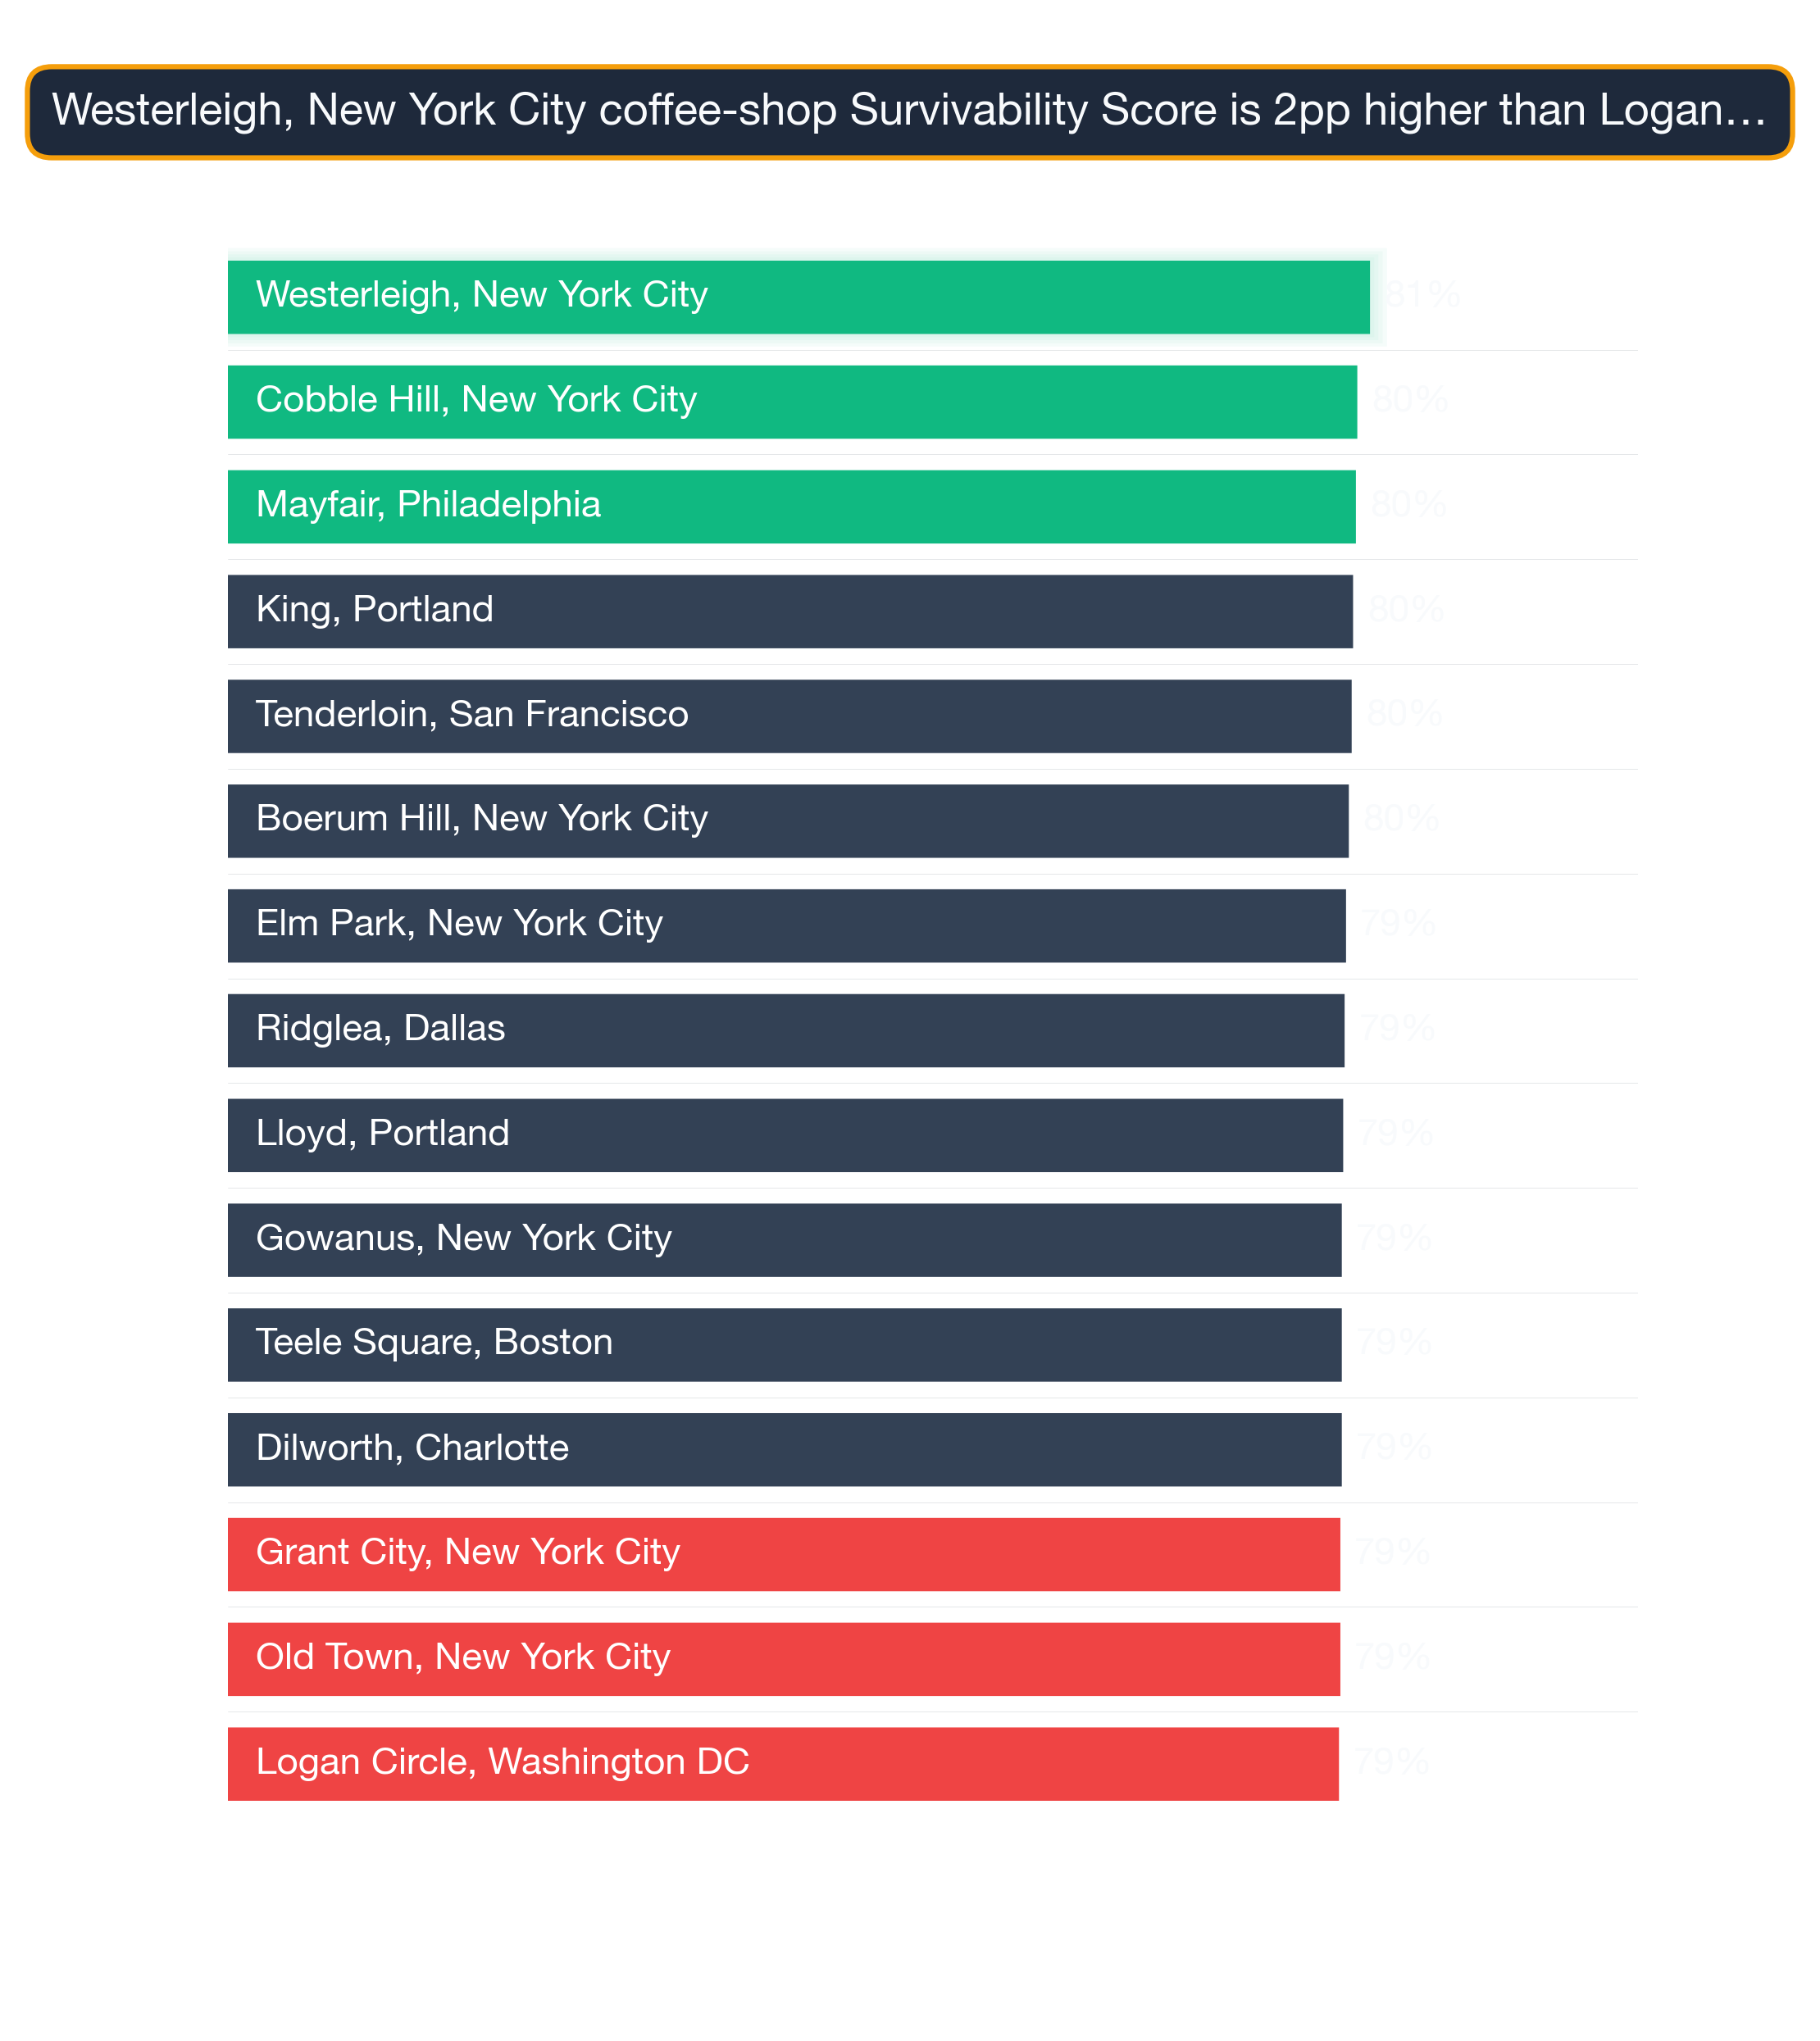
Westerleigh (New York City) ranks #1 nationally for Coffee Shop survivability in 2026, with a 81% chance of success for new entrants. The top 25 neighborhoods nationwide span 10 different cities, demonstrating that exceptional opportunities for Coffee Shops exist across diverse markets. Because new competitors open and close each week, the exact survivability score for any specific address is always best verified in StreetSpring's live platform.
To understand the methodology behind these rankings, see our detailed guide: Survivability Score: How We Calculate It & Why It Matters.
Last reviewed: May 7, 2026 by Bobby Koons, Founder & CEO, StreetSpring
Quick Summary
- #1 Neighborhood: Westerleigh, New York City — 81% survivability for Coffee Shop
- Neighborhoods analyzed: 1426 across 24 major US cities
- National average survivability: 70.1% for Coffee Shops
- Top-25 average: 79.1% — 9.0% above national average
- Data current as of: 2026 · Full methodology →
Table of Contents
- How neighborhoods compare nationwide
- Top 25 neighborhoods in the US
- Geographic patterns
- How to use this ranking
- Related resources
- Frequently asked questions
How do US neighborhoods stack up for Coffee Shops?
Analyzing 1426 neighborhoods across 24 major US cities, StreetSpring's 2026 data shows that the best neighborhoods for Coffee Shops significantly outperform average locations, with the top 25 neighborhoods nationwide averaging 79.1% survivability compared to the national neighborhood average of 70.1%.
This 9.0% advantage illustrates how critical neighborhood selection is — choosing a top-tier neighborhood versus an average one can significantly increase your long-term survival chances.
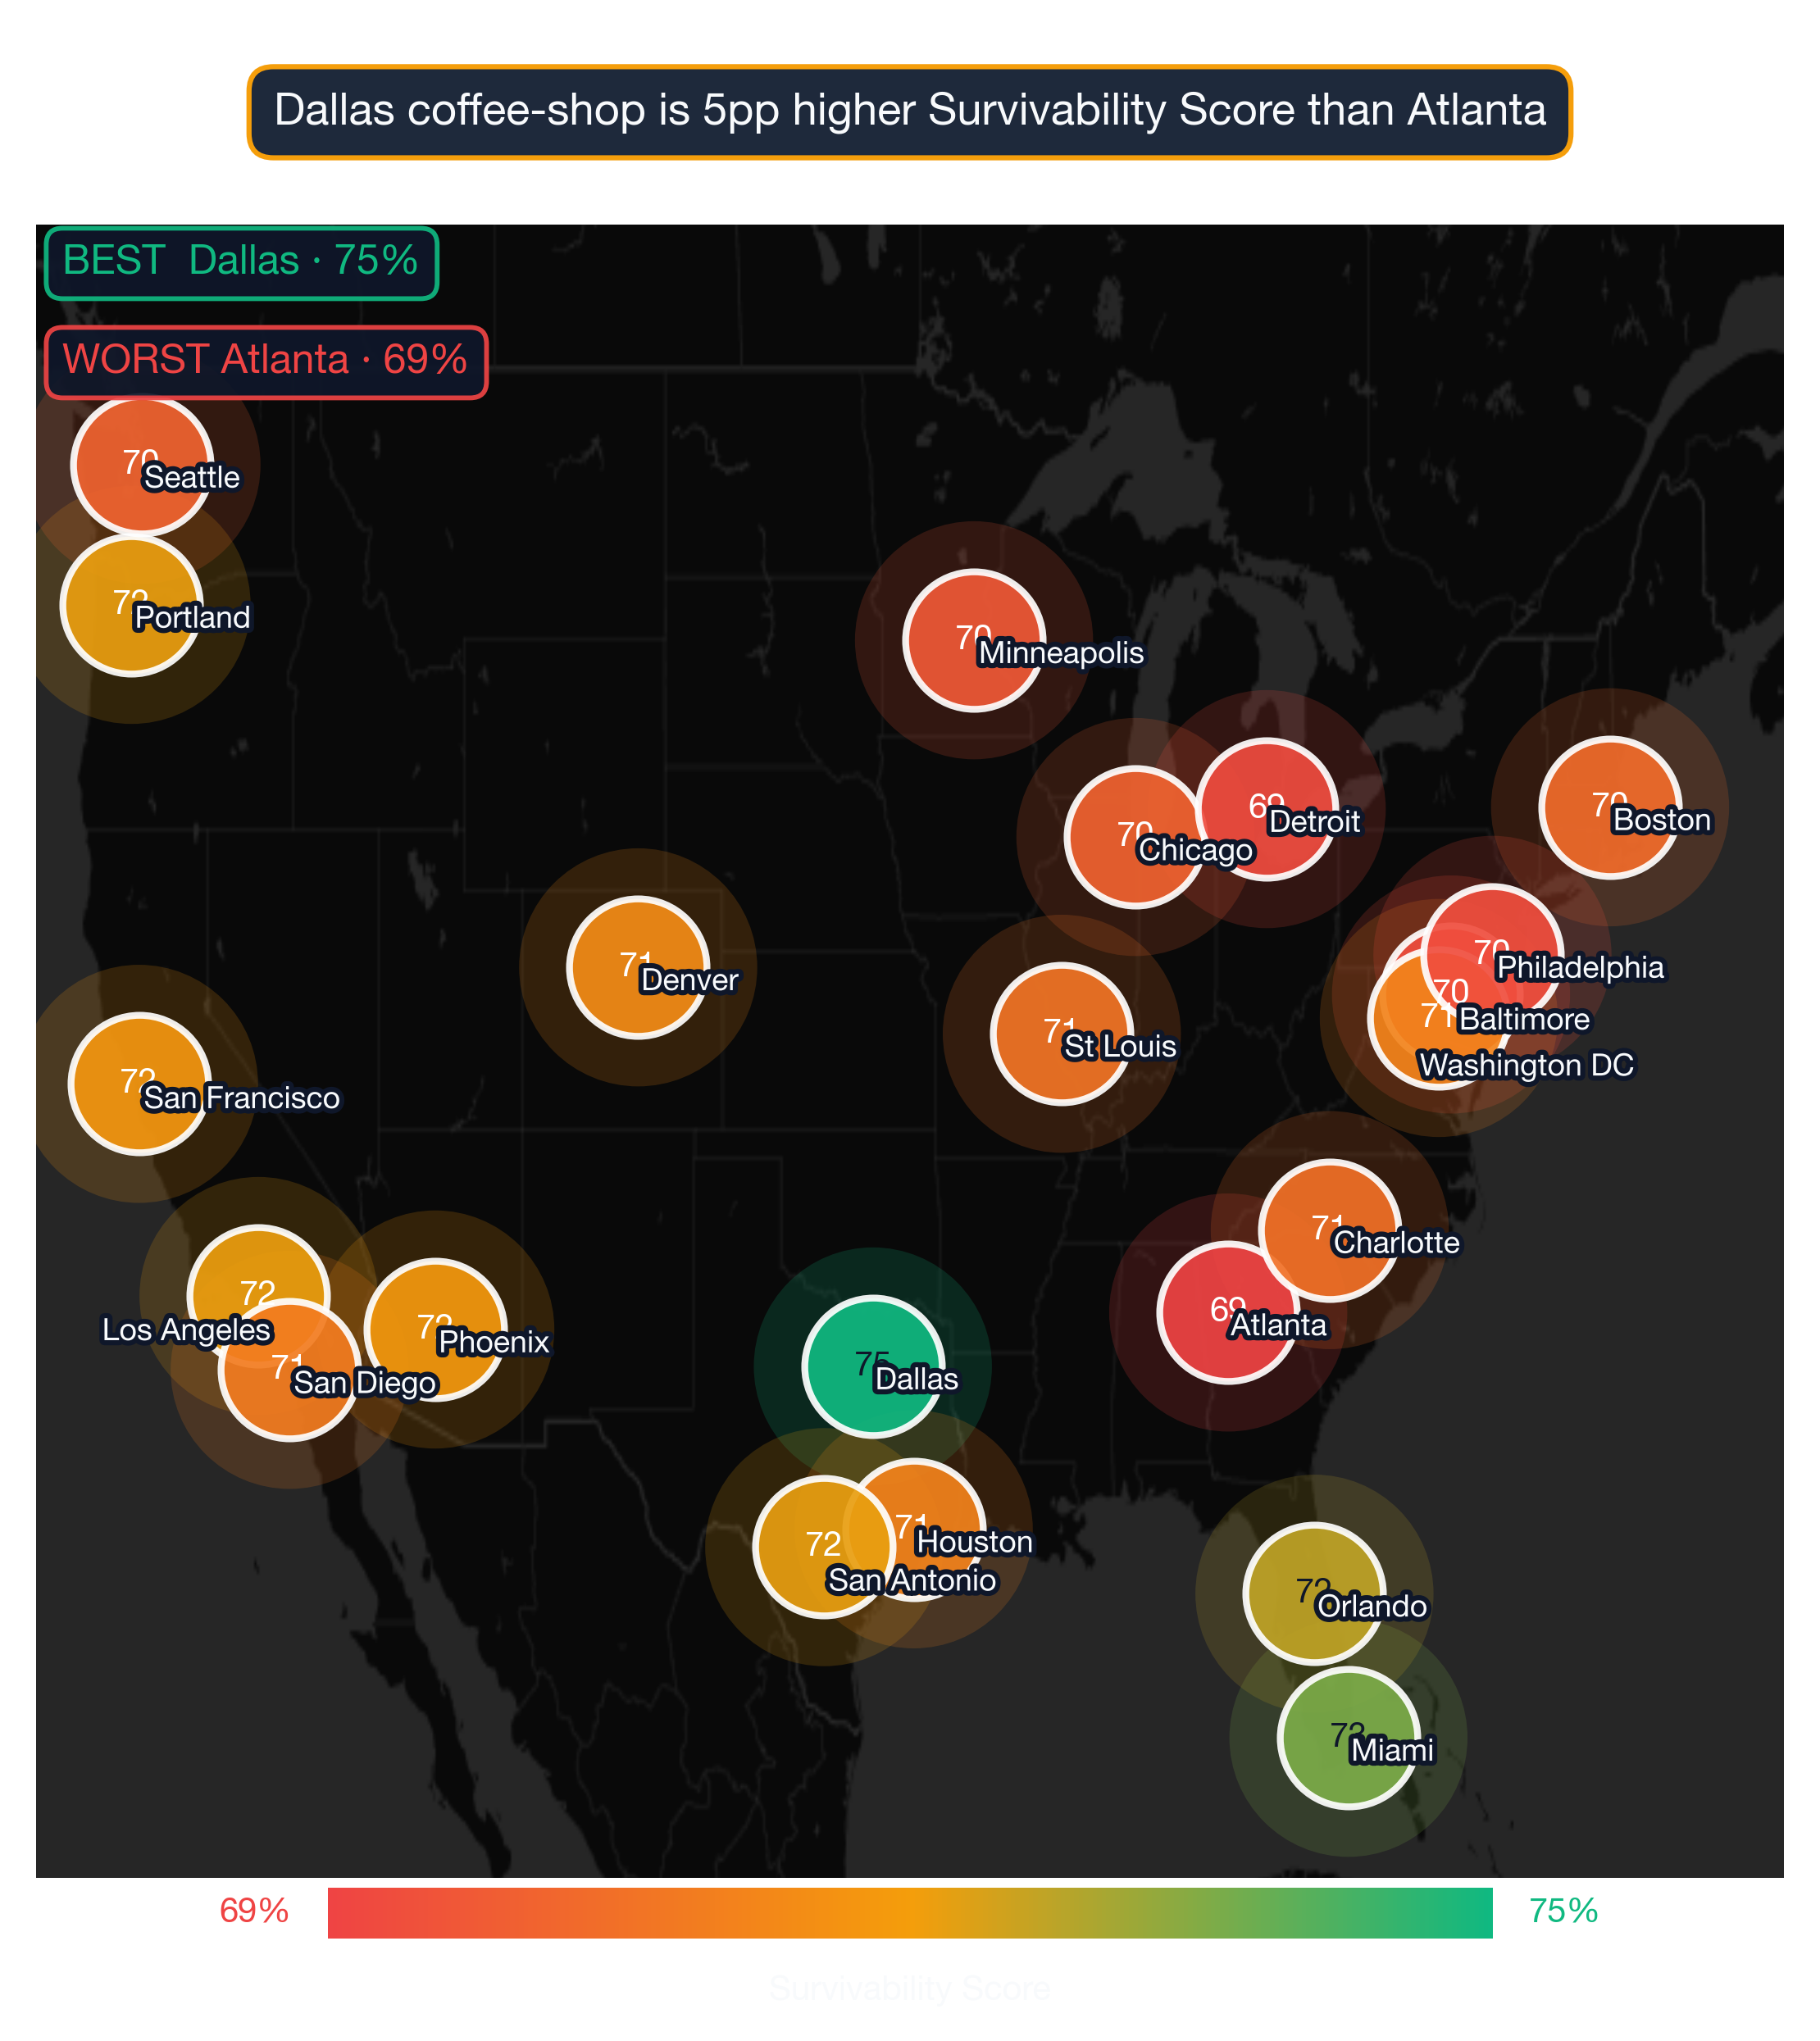
Coffee Shops tend to show significant geographic clustering — markets where one successful operator exists often attract additional demand, raising survivability for new entrants who choose complementary (rather than directly competing) locations. The concentration of top neighborhoods in New York City, San Francisco, Washington DC reflects this pattern. StreetSpring's model accounts for the distinction between complementary clustering and direct saturation when scoring Coffee Shops survivability at the address level.
Importantly, top-performing neighborhoods aren't concentrated in just a few cities. The top 25 neighborhoods represent 10 different cities. This means entrepreneurs focused on Coffee Shops can find exceptional opportunities across the United States, not just in traditionally strong markets.
A great product in the wrong location will underperform; an average product in the right location can thrive.
What are the best neighborhoods in the United States to open a Coffee Shop?
| Signal | Top-quartile neighborhood pattern | Bottom-quartile neighborhood pattern |
|---|---|---|
| Daytime population concentration | Mixed-use neighborhoods with strong daytime employment density (LEHD LODES > 8K jobs/sq mi). | Pure-residential neighborhoods where daytime population drops below 30% of resident count. |
| Anchor-venue spillover | Neighborhoods within 0.25 miles of a major anchor (transit hub, university gate, hospital main entrance, concert venue). | Neighborhoods where the nearest anchor is past walking distance — no spillover demand. |
| Subtype-specific density saturation | Neighborhoods with the subtype below the optimal density curve — room for a new entrant without cannibalizing demand. | Neighborhoods at or past the saturation point for the subtype, where new entrants face zero-sum competition. |
How density of similar businesses lifts (or hurts) survival
Survivability range for top, middle, and last-ranked neighborhoods. Box = best-to-challenging range; white line = average. Westerleigh, New York City leads at 81% in 2026. Full methodology →
The top 25 neighborhoods nationwide for Coffee Shops are:
| # | Neighborhood | City | Avg Survival | Tier | Best Locations | Challenging Locations |
|---|---|---|---|---|---|---|
| 1 | Westerleigh | New York City | 81.0% | Great | 83.2% | 79.1% |
| 2 | Cobble Hill | New York City | 80.1% | Great | 82.3% | 78.2% |
| 3 | Mayfair | Philadelphia | 80.0% | Great | 82.2% | 78.1% |
| 4 | King | Portland | 79.8% | Good | 81.9% | 77.9% |
| 5 | Tenderloin | San Francisco | 79.7% | Good | 81.8% | 77.7% |
| 6 | Boerum Hill | New York City | 79.5% | Good | 81.7% | 77.6% |
| 7 | Elm Park | New York City | 79.3% | Good | 81.4% | 77.4% |
| 8 | Ridglea | Dallas | 79.2% | Good | 81.4% | 77.3% |
| 9 | Lloyd | Portland | 79.1% | Good | 81.3% | 77.2% |
| 10 | Teele Square | Boston | 79.0% | Good | 81.2% | 77.1% |
| 11 | Dilworth | Charlotte | 79.0% | Good | 81.1% | 77.1% |
| 12 | Gowanus | New York City | 79.0% | Good | 81.1% | 77.0% |
| 13 | Grant City | New York City | 78.9% | Good | 81.1% | 77.0% |
| 14 | Old Town | New York City | 78.9% | Good | 81.0% | 77.0% |
| 15 | Logan Circle | Washington DC | 78.8% | Good | 80.9% | 76.8% |
| 16 | Chinatown | San Francisco | 78.7% | Good | 80.9% | 76.8% |
| 17 | Forest Hill | San Francisco | 78.7% | Good | 80.9% | 76.8% |
| 18 | Garment District | New York City | 78.6% | Good | 80.7% | 76.6% |
| 19 | Capitol Hill | Washington DC | 78.6% | Good | 80.7% | 76.6% |
| 20 | Ball Square | Boston | 78.5% | Good | 80.6% | 76.6% |
| 21 | Beverly Heights | Miami | 78.5% | Good | 80.6% | 76.5% |
| 22 | Dongan Hills | New York City | 78.4% | Good | 80.6% | 76.5% |
| 23 | Swann Estates | Tampa Bay | 78.4% | Good | 80.5% | 76.5% |
| 24 | Woodlands | Washington DC | 78.4% | Good | 80.5% | 76.4% |
| 25 | Flagler Heights | Miami | 78.4% | Good | 80.5% | 76.4% |
Individual site conditions — including storefront visibility, access, and hyper-local competition — can push a location well above or below its neighborhood average.
For a full explanation of how survivability scores and ranges are calculated, see Survivability Score: How We Calculate It & Why It Matters.
What patterns emerge from the top-performing neighborhoods nationwide?
City Concentration
The top 25 neighborhoods span 10 different cities, with New York City claiming 9 of the top spots (36%).
Breakdown of top 25 neighborhoods by city:
- New York City: 9 neighborhoods (36% of top 25) — View city guide
- San Francisco: 3 neighborhoods (12% of top 25) — View city guide
- Washington DC: 3 neighborhoods (12% of top 25) — View city guide
- Portland: 2 neighborhoods (8% of top 25) — View city guide
- Boston: 2 neighborhoods (8% of top 25) — View city guide
- Miami: 2 neighborhoods (8% of top 25) — View city guide
- Philadelphia: 1 neighborhood (4% of top 25) — View city guide
- Dallas: 1 neighborhood (4% of top 25) — View city guide
- Charlotte: 1 neighborhood (4% of top 25) — View city guide
- Tampa Bay: 1 neighborhood (4% of top 25) — View city guide
This distribution has practical implications for Coffee Shops operators: cities with multiple neighborhoods in the top 25 offer more site options within a single market, reducing relocation or expansion cost. Cities with a single top-25 neighborhood require more precise site selection — the advantage is concentrated in one area rather than spread across the metro.
Why some neighborhoods score high without being downtown
The relatively even distribution of top neighborhoods across 10 cities is consistent with a category where consumer demand is broadly distributed rather than concentrated in specific metros. For Coffee Shops operators, this means strong site opportunities exist in multiple markets — the key variable is neighborhood-level competitive conditions rather than city-level market size.
Turning the neighborhood ranking into a location decision for a Coffee Shop
While nationwide neighborhood rankings identify standout markets, address-level analysis reveals even greater variation. Our AI engine has been trained on millions of real business outcomes, giving every survivability prediction a foundation of data that no other platform can match. Even within top-ranked neighborhoods, specific block selection can vary survivability by 10–20 percentage points.
For the most accurate assessment:
- Consider neighborhoods in the top 25 as strong starting points
- Examine city-specific guides for additional neighborhood options in your target markets
- Use StreetSpring's address-level tool to evaluate specific storefronts within these neighborhoods
- Factor in your budget, operational requirements, and target demographics
Each neighborhood has detailed analysis available through its city guide, providing block-by-block survivability data for Coffee Shops.
Combining this list with a block-level walk-through
See also: Best Cities for Coffee Shop — our city-level comparison ranks which metros offer the strongest overall conditions for Coffee Shops.
Synergy Patterns: Subtypes That Cluster Together
The strongest neighborhoods for Coffee Shops are also strong for several adjacent business types — useful context if you're considering a portfolio of locations or weighing complementary subtypes:
Westerleigh, New York City — ranked #1 nationally — the strongest neighborhood for Coffee Shops (81% survivability for Coffee Shop) Other business types that thrive in Westerleigh:
- Barber Shop (82% survivability)
- Nail Salon (82% survivability)
- Beauty Salon (82% survivability)
Ost-South-Union, Houston — ranked #1426 of 1426 — among the lower-ranked national neighborhoods (57% survivability for Coffee Shop) Other business types that thrive in Ost-South-Union:
- American Restaurant (83% survivability)
- Ukrainian Restaurant (83% survivability)
- Kosher Restaurant (82% survivability)
Cross-subtype synergy is a real signal. A neighborhood that scores high for Coffee Shops is usually a sound bet for several other business types — useful for landlords and multi-concept owners.
Visual Data
Related Resources
Explore top cities represented in these neighborhoods:
- Portland: Best businesses and neighborhoods
- Boston: Best businesses and neighborhoods
- Philadelphia: Best businesses and neighborhoods
- Charlotte: Best businesses and neighborhoods
- New York City: Best businesses and neighborhoods
National city rankings: Best cities for Coffee Shops
Essential resources:
- How StreetSpring calculates Survivability Scores
- Site selection for landlords
- AI tools for tenant representatives
- StreetSpring vs competitors
Frequently Asked Questions
How does the national ranking for Coffee Shops compare to city-level rankings?
The national neighborhood ranking for Coffee Shops identifies the strongest neighborhoods across all 24 analyzed metros. City-level rankings provide a more granular view of the best neighborhoods within a specific city. In cases where a city has multiple neighborhoods in the national top 25, the city-level guide shows the full ranking of all neighborhoods in that market — including those outside the national top 25 that may still offer strong site-specific opportunities.
Where can I download the underlying data?
The full national survivability dataset is available as a free download: https://streetspring.com/resources/data/national-survivability-scores-2026.csv. The CSV includes all business subtypes and neighborhoods covered in this analysis, licensed under CC BY 4.0.
How does StreetSpring calculate survivability for Coffee Shops specifically?
StreetSpring's model calculates survivability for Coffee Shops by analyzing the competitive density of existing Coffee Shops within each distance band around the address, the projected consumer spending on Coffee Shops in that location, mobility patterns that determine likely customer flow, and 80+ additional factors. The resulting survivability score reflects the estimated probability of a new Coffee Shop surviving 2+ years at that specific address.
Are there good opportunities outside the top 25 neighborhoods?
Absolutely. Our analysis covers 1426 neighborhoods across 24 cities. Many neighborhoods outside the top 25 have excellent individual locations for Coffee Shops. Neighborhood-level rankings reflect averages — specific addresses within any neighborhood can score well above or below the neighborhood mean. Use city-specific guides and StreetSpring's address-level tool to explore options beyond the top 25.
What demographic factors drive survivability for Coffee Shops?
For Coffee Shops, StreetSpring's model incorporates neighborhood-level demographic data including population density, median household income, employment rates, and consumer spending on this specific category. These factors vary by business type — the demographic profile that drives survivability for Coffee Shop customers may differ significantly from what matters for other business categories.
How often do neighborhood rankings change?
StreetSpring updates rankings quarterly as new data on business openings, closures, and market conditions becomes available. The current analysis reflects 2026 data. Because competitive conditions shift as new businesses enter or exit a neighborhood, the specific rankings for any given business type can shift between updates — which is why we recommend verifying specific addresses in StreetSpring's live tool before making a final site selection decision.
What type of neighborhood is best for opening a Coffee Shop?
The best neighborhoods for Coffee Shops share three characteristics: manageable competitive density (few existing direct competitors within the primary trade area), strong consumer spending on this category, and demographic alignment with the typical Coffee Shop customer base. In StreetSpring's 2026 data, the top-ranked neighborhoods for Coffee Shops combine these factors in a way that produces survivability scores well above the national average of 70.1%. Neighborhoods with dense existing competition or low category spending tend to score significantly lower, regardless of overall foot traffic or prestige.
Can a Coffee Shop succeed in neighborhoods outside the top 25?
Yes — the top 25 neighborhoods represent standout conditions, but Coffee Shops can achieve strong survivability in many other neighborhoods as well. What matters is finding a location where competitive density is low enough and consumer spending is strong enough to support the business. StreetSpring's address-level tool identifies high-survivability addresses in any neighborhood, including those not represented in this top-25 list.
Technical note: Aggregated national survivability rankings across all 24 metros are available in machine-readable format for research and integration purposes.
StreetSpring recalculates survivability using the latest competitive, demographic, and walkability data, so the live score may differ from the static ranges shown here.
Methodology: Neighborhood rankings are based on average Survivability Scores for Coffee Shops across all analyzed locations within each neighborhood. Rankings represent neighborhood-level conditions but do not account for block-by-block variation. Coverage includes 1426 neighborhoods across 24 major US cities.