Business Survivability Rankings: Charlotte
StreetSpring's 2026 analysis ranks business survivability in Charlotte by survivability score. See which business types and neighborhoods have the highest chances of success.
Quick Summary
- Best business: Armenian Restaurant in Eastfield (>97% survival rate)
- 857 business-location combinations exceed 90% survival rates in Charlotte
- City average: 75% chance of lasting 2+ years
- Rankings updated quarterly with latest market data
- Detailed methodology
Last reviewed: May 7, 2026 by Bobby Koons, StreetSpring founder — updated weekly
Table of Contents
- Summary
- What Are My Chances of Success?
- Business Survivability Rankings
- Understanding Survivability Ranges
- Most Important Factors
- Key Takeaways
- Strong Picks Across the Spectrum
- Related Resources
Summary
Based on StreetSpring's latest 2026 market analysis, 857 business-location combinations in Charlotte demonstrate 90%+ survival rates, with Armenian Restaurant in Eastfield ranking highest at >97%. Nothing influences a business's future more than its location.
Across the U.S., real estate professionals and business owners rely on StreetSpring's AI predictions to understand where a new venture is most likely to thrive, before signing a lease. Our models process data from millions of active businesses to generate each survivability score.
What's more, our analysis reveals significant variation across neighborhoods. The best locations offer >97% survival probability, while less optimal areas show considerably lower rates.
What Are My Chances of Success Opening a Business in Charlotte?
A Charlotte business has a 75% average chance of lasting more than 2 years in today's market conditions.
How this city's average compares to the national baseline
Regardless, your neighborhood and block choice is the single biggest survival factor. Revenue Capture Score is the single best indicator of whether a business will thrive at a location. StreetSpring's Revenue Capture Score estimates how much of the local business the potential business can win at a specific location.
review the location evaluation process.
What New Businesses Would Be the Most Successful in Charlotte?
As illustrated in the following chart, the distribution of business outcomes across Charlotte by survivability score bracket:
Charlotte: Armenian Restaurant ranks #1 in survivability at >97% — 2026 StreetSpring analysis
The top 10 business opportunities in Charlotte are:
| Rank | Business Type | Neighborhood | Best Locations | Average Locations | Challenging Locations | Location Advantage |
|---|---|---|---|---|---|---|
| 1 | Armenian Restaurant | Eastfield | 97.0% – 97.0% | 86.0% – 89.9% | 67.4% – 71.0% | ~12% |
| 2 | Hawaiian Restaurant | Eastfield | 97.0% – 97.0% | 86.5% – 89.3% | 68.6% – 72.0% | ~13% |
| 3 | Southern Food Restaurant | Eastfield | 96.9% – 97.0% | 86.9% – 89.4% | 67.1% – 71.2% | ~12% |
| 4 | Veterinary Clinic | North Lake | 96.2% – 97.0% | 83.5% – 87.9% | 70.2% – 75.1% | ~15% |
| 5 | Armenian Restaurant | North Lake | 97.0% – 97.0% | 83.8% – 87.8% | 69.4% – 73.0% | ~15% |
| 6 | Hawaiian Restaurant | North Lake | 97.0% – 97.0% | 83.9% – 86.7% | 67.6% – 71.0% | ~16% |
| 7 | Veterinary Clinic | Downtown | 95.2% – 97.0% | 84.8% – 89.2% | 64.2% – 69.1% | ~12% |
| 8 | Southern Food Restaurant | Downtown | 95.9% – 97.0% | 86.5% – 89.0% | 63.1% – 67.2% | ~12% |
| 9 | Bangladeshi Restaurant | Downtown | 96.4% – 97.0% | 86.4% – 90.3% | 65.8% – 69.4% | ~11% |
| 10 | Bangladeshi Restaurant | Laurel Park | 95.4% – 97.0% | 82.9% – 86.8% | 71.8% – 75.4% | ~15% |
Cross-checks before you pick a subtype off this list
The best address in a weak neighborhood can outperform the worst address in a strong neighborhood — site-level analysis is essential. Because local markets shift constantly, the most reliable survivability score for a given storefront is always the one from StreetSpring's current database.
Visit StreetSpring to run a free survivability check on your target storefront.
Understanding Survivability Ranges
Actual survivability at a specific address depends on storefront-level conditions such as exact visibility and foot traffic patterns, lease terms and rent structure, individual operator skill and capital reserves, and timing of market entry and seasonal patterns.
How to read the 0-100 score in your own context
Upper and lower bounds represent the best and most challenging conditions within each location tier, while the spread between them signals how volatile that local market is.
One illustration of this: an Armenian Restaurant showing 86.0% – 89.9% at average locations means most businesses in this category fall within this range. A best-in-class location (>97% survival) offers roughly 12% more expected business longevity than an average location (88%), because a higher survival probability translates directly into more operating time to generate revenue. Conversely, a challenging location (69%) represents 22% less expected longevity than the average — a meaningful risk differential that should factor into lease negotiations and capital planning. How you execute, when you open, and the exact characteristics of your storefront all influence where you fall within the range. Tight ranges mean more predictable outcomes; wide ranges mean higher variance.
What Should I Consider When Opening in or Around Charlotte?
Revenue Capture Score
The Revenue Capture Score is the primary driver of survivability — it reflects how much of the available market a business can realistically win. Revenue Capture Score quantifies the expected market share a business will earn at a given address, based on competition, spending patterns, and mobility data. Take, for instance, an Armenian Restaurant in a high-revenue-capture area might survive even with moderate competition, while the same business in a low-capture area could struggle despite less competition.
| Consideration | Common pitfall | What to verify before signing |
|---|---|---|
| Foot traffic seasonality | Looking at a peak-summer Tuesday and assuming year-round volume. | Walk the block at 3 different times across 2 different weeks. Ask neighboring tenants for their slow-season % drop. |
| Permitted hours | Late-night or early-morning ops blocked by zoning, neighborhood association, or shared-wall restrictions. | Confirm the permitted hours-of-operation are in your lease AND in the local code. Pull recent variances or complaints from the zoning portal. |
| Permits & licensing | Assuming a 30-day permit timeline, hitting 90+ days, paying rent on a non-operating storefront. | Call the local zoning office before signing. Confirm your use is already permitted; if not, factor a 2-3 month variance timeline. |
Competition Quality and Saturation
Competitive clustering can serve as a form of validation: if multiple operators have survived in the same trade area, the demand signal is strong. Nevertheless, in densely saturated markets, customer acquisition costs rise and revenue per location falls — a combination that is difficult to overcome.
Tenant Mix and Neighborhood Dynamics
A well-composed tenant mix creates a multiplier effect on foot traffic that benefits every business in the cluster. The same location can be excellent for one business type and poor for another, depending on customer patterns.
Hyperlocal Variation
Two storefronts on the same street can show a 15-point survivability difference based on visibility, parking, and neighbor mix. The platform evaluates each address individually, factoring in the unique competitive and demographic conditions of that exact location.
What Is the #1 Business to Start in Charlotte?
Armenian Restaurant in Eastfield with >97% survivability based on StreetSpring's 2026 analysis of 3,115 business and neighborhood combinations.
How Accurate Is StreetSpring's Survival Prediction?
Our models deliver 95–99% prediction accuracy across business types. Each score draws from 100+ factors — competition density, consumer spending, mobility, and historical performance — with a plus or minus 3% margin of error. See our full methodology at streetspring.com/resources/tutorial/methodology. Review our methodology and data sources.
What Makes Charlotte Good for New Businesses?
Charlotte offers 857 business-location combinations with 90% or higher survival rates reflecting current competitive conditions. The survivability forecasts in this guide are generated by the same models that commercial real estate professionals use for tenant placement and site selection. The platform analyzes competition, mobility, spending, and demographic data across 24 metros to produce these rankings.
How Fresh Is Our Charlotte Ranking Data?
Rankings for Charlotte are updated quarterly with the latest business opening and closure data and market conditions. Last updated: 2026-Q1. The next scheduled update for Charlotte will incorporate Q2 2026 data.
Can I Get Predictions for a Specific Address in Charlotte?
Yes. Visit StreetSpring.com to analyze any storefront address in Charlotte with address-specific survivability predictions for over 700 business types.
What Factors Determine Business Survivability in Charlotte?
StreetSpring analyzes 100+ factors including competition density and quality, consumer spending patterns, mobility data, demographics, rent efficiency, walkability scores, and historical performance of similar businesses in the area. Our models are built entirely in-house, using proprietary datasets that are not available through any third-party provider.
Are These Predictions Guaranteed?
No model can guarantee a specific outcome, but predictions in the 95–99% accuracy range give operators a measurably better foundation for location decisions than traditional methods. Keep in mind that results depend heavily on the exact location; strong sites often exist within neighborhoods that seem less favorable overall.
How Do Landlords Identify the Best Tenant for Their Property?
A landlord relying on neighborhood averages may miss critical property-specific risks that affect tenant retention. Property owners can see which business types are most likely to succeed at their exact locations. Access StreetSpring for address-specific survivability predictions across 700+ business types.
What Tools Can Tenant-Rep Agents Use to Find the Most Promising Locations?
The gap between traditional site selection methods and data-driven approaches has widened as AI prediction accuracy has improved. Across the U.S., real estate professionals and business owners rely on StreetSpring's AI predictions to understand where a new venture is most likely to thrive, before signing a lease. Access StreetSpring for address-specific survivability predictions across 700+ business types.
Key Takeaways
Data Summary: 857 business-location combinations exceed 90% survival in Charlotte. The top opportunity is Armenian Restaurant in Eastfield at >97% survival. The city average is 75% two-year survival rate across 3,115 business and neighborhood combinations analyzed.
Action Items: Check neighborhood-specific data for your target area in Charlotte. Use StreetSpring's address tool to analyze exact storefronts — if Armenian Restaurant in Eastfield leads the rankings, similar high-scoring opportunities may exist nearby. Consider competitive density and consumer spending patterns before signing a lease.
Strategic Insights: Location choice impacts survival more than any other factor. Hyperlocal factors like corner position, sidewalk width, and nearest anchor tenant create survivability swings that neighborhood averages cannot capture. The model captures business-type-specific dynamics: a hair salon and a bakery on the same block face entirely different competitive and spending environments. Revenue Capture Score is the single best predictor of success.
Strong Picks Across the Spectrum
Charlotte's subtype rankings are averages — every business type has at least a few neighborhoods where it thrives. A few examples across the spectrum:
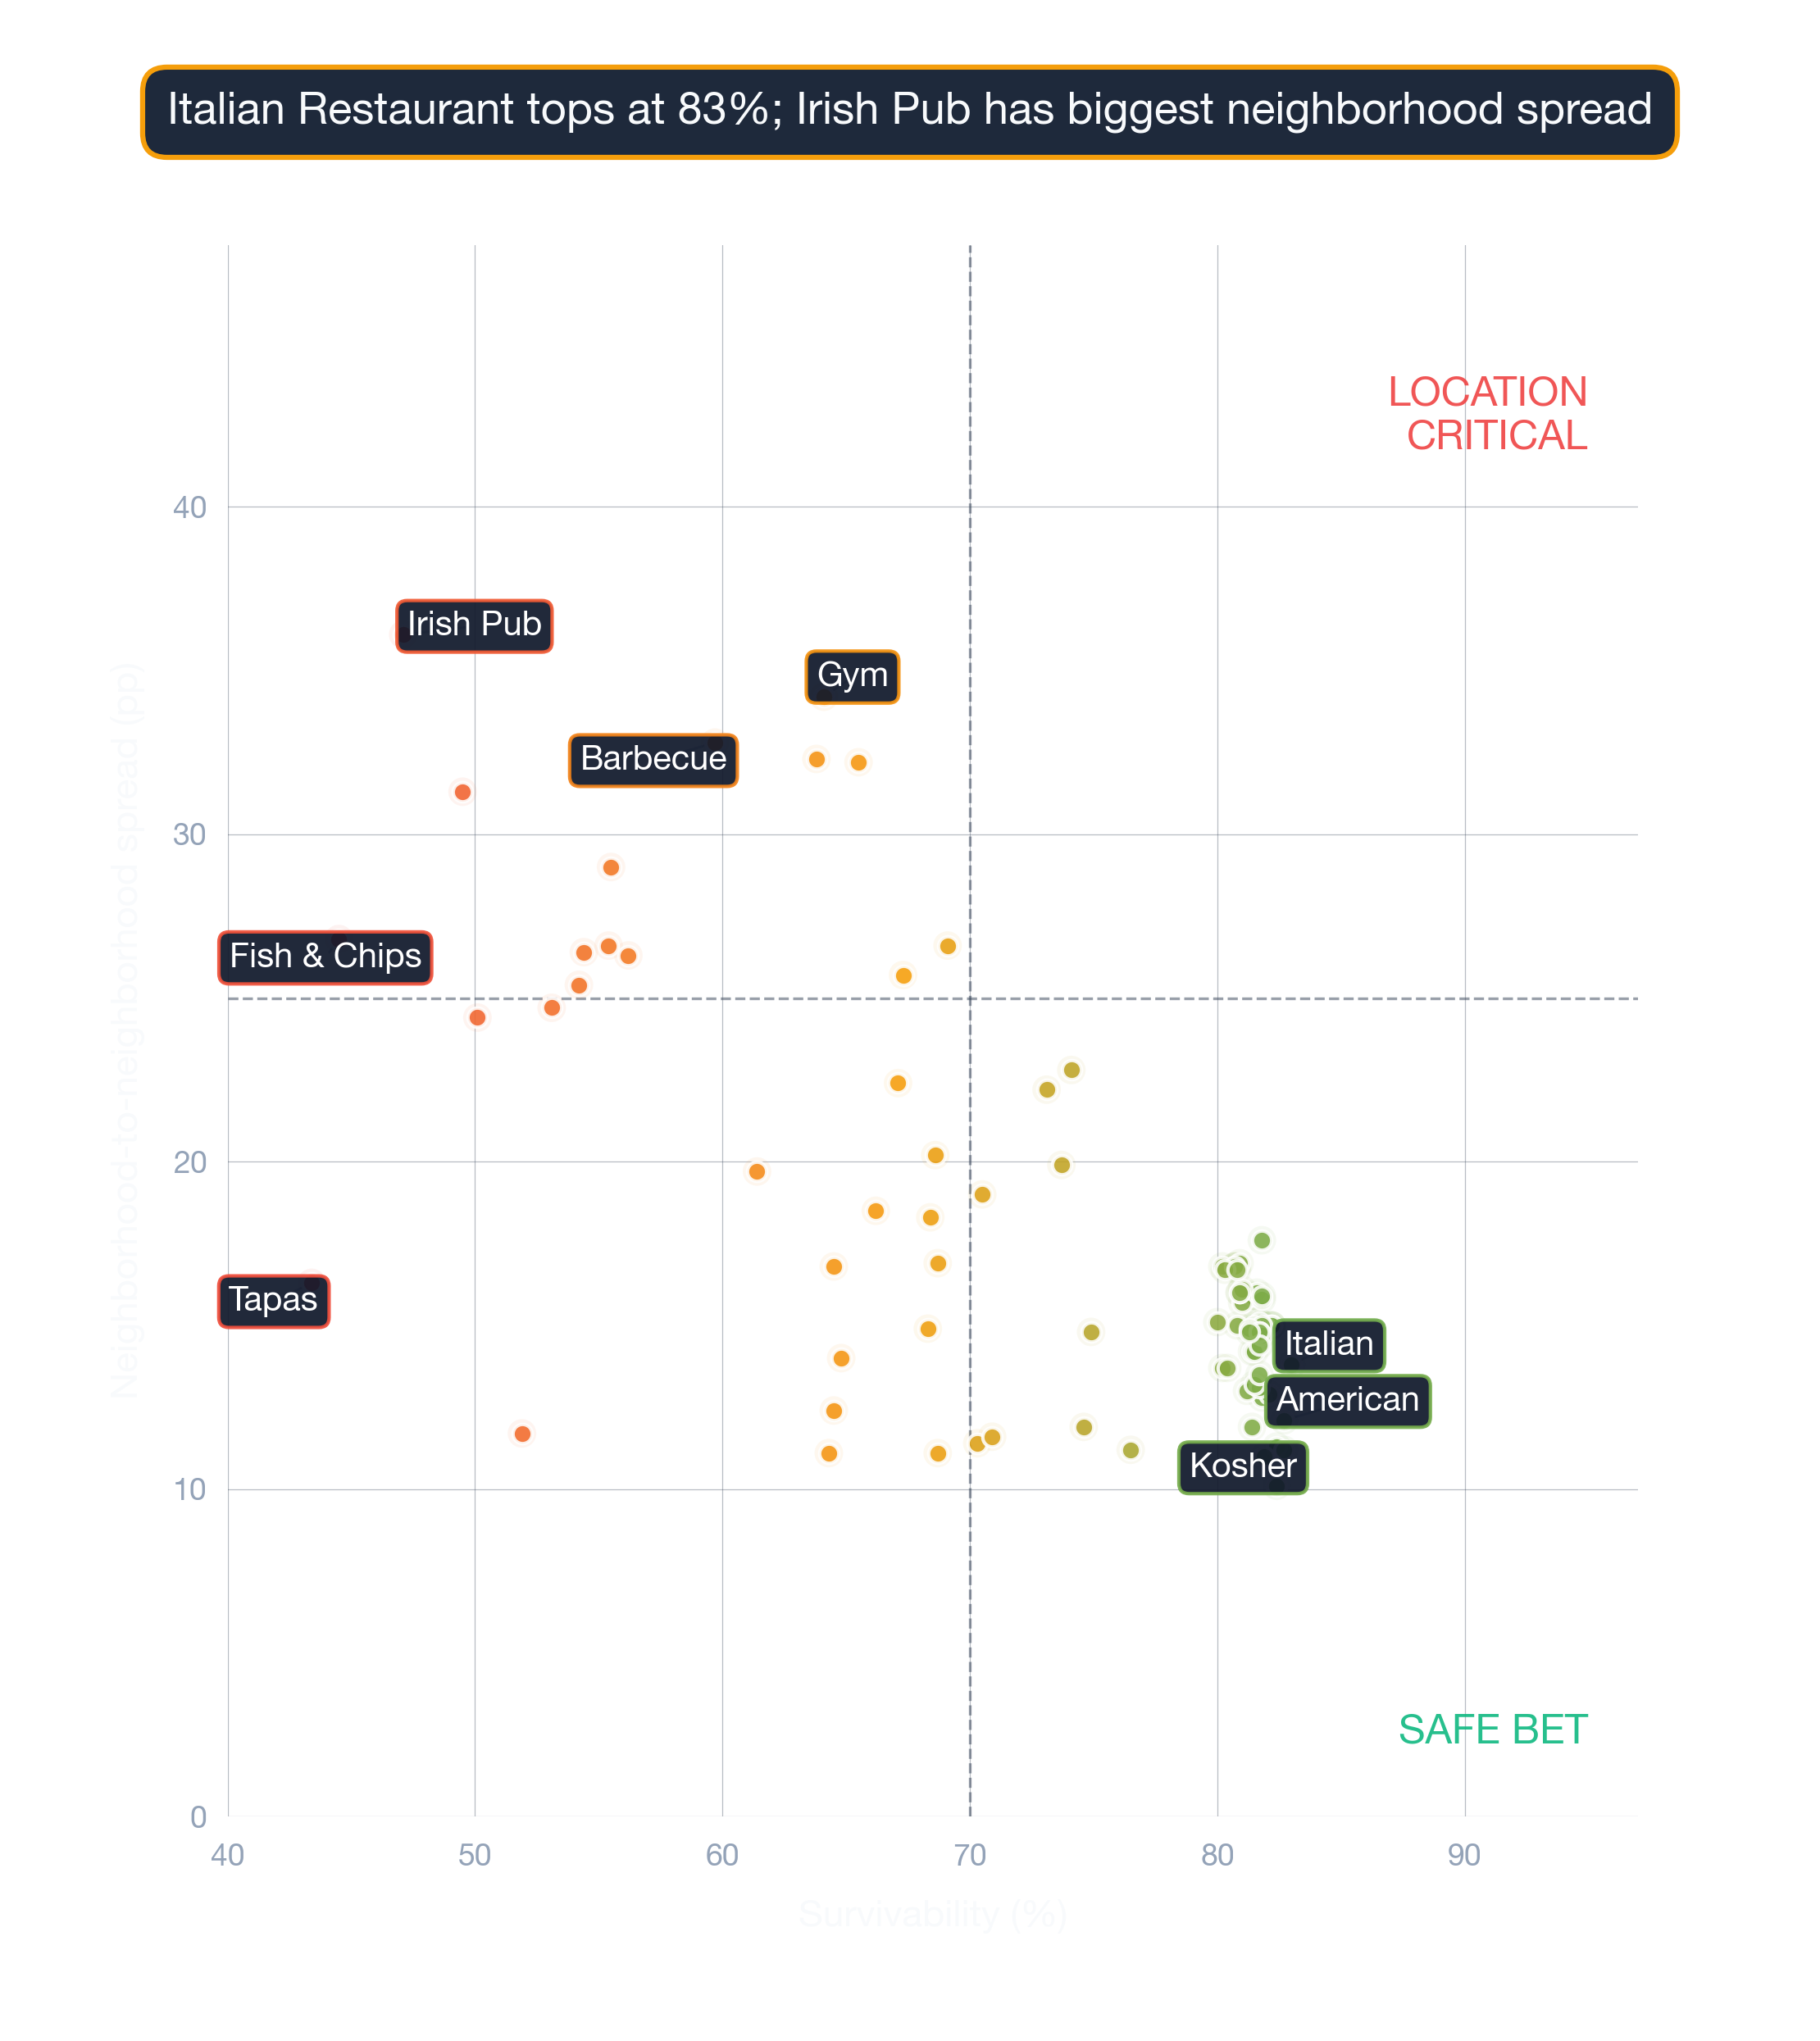
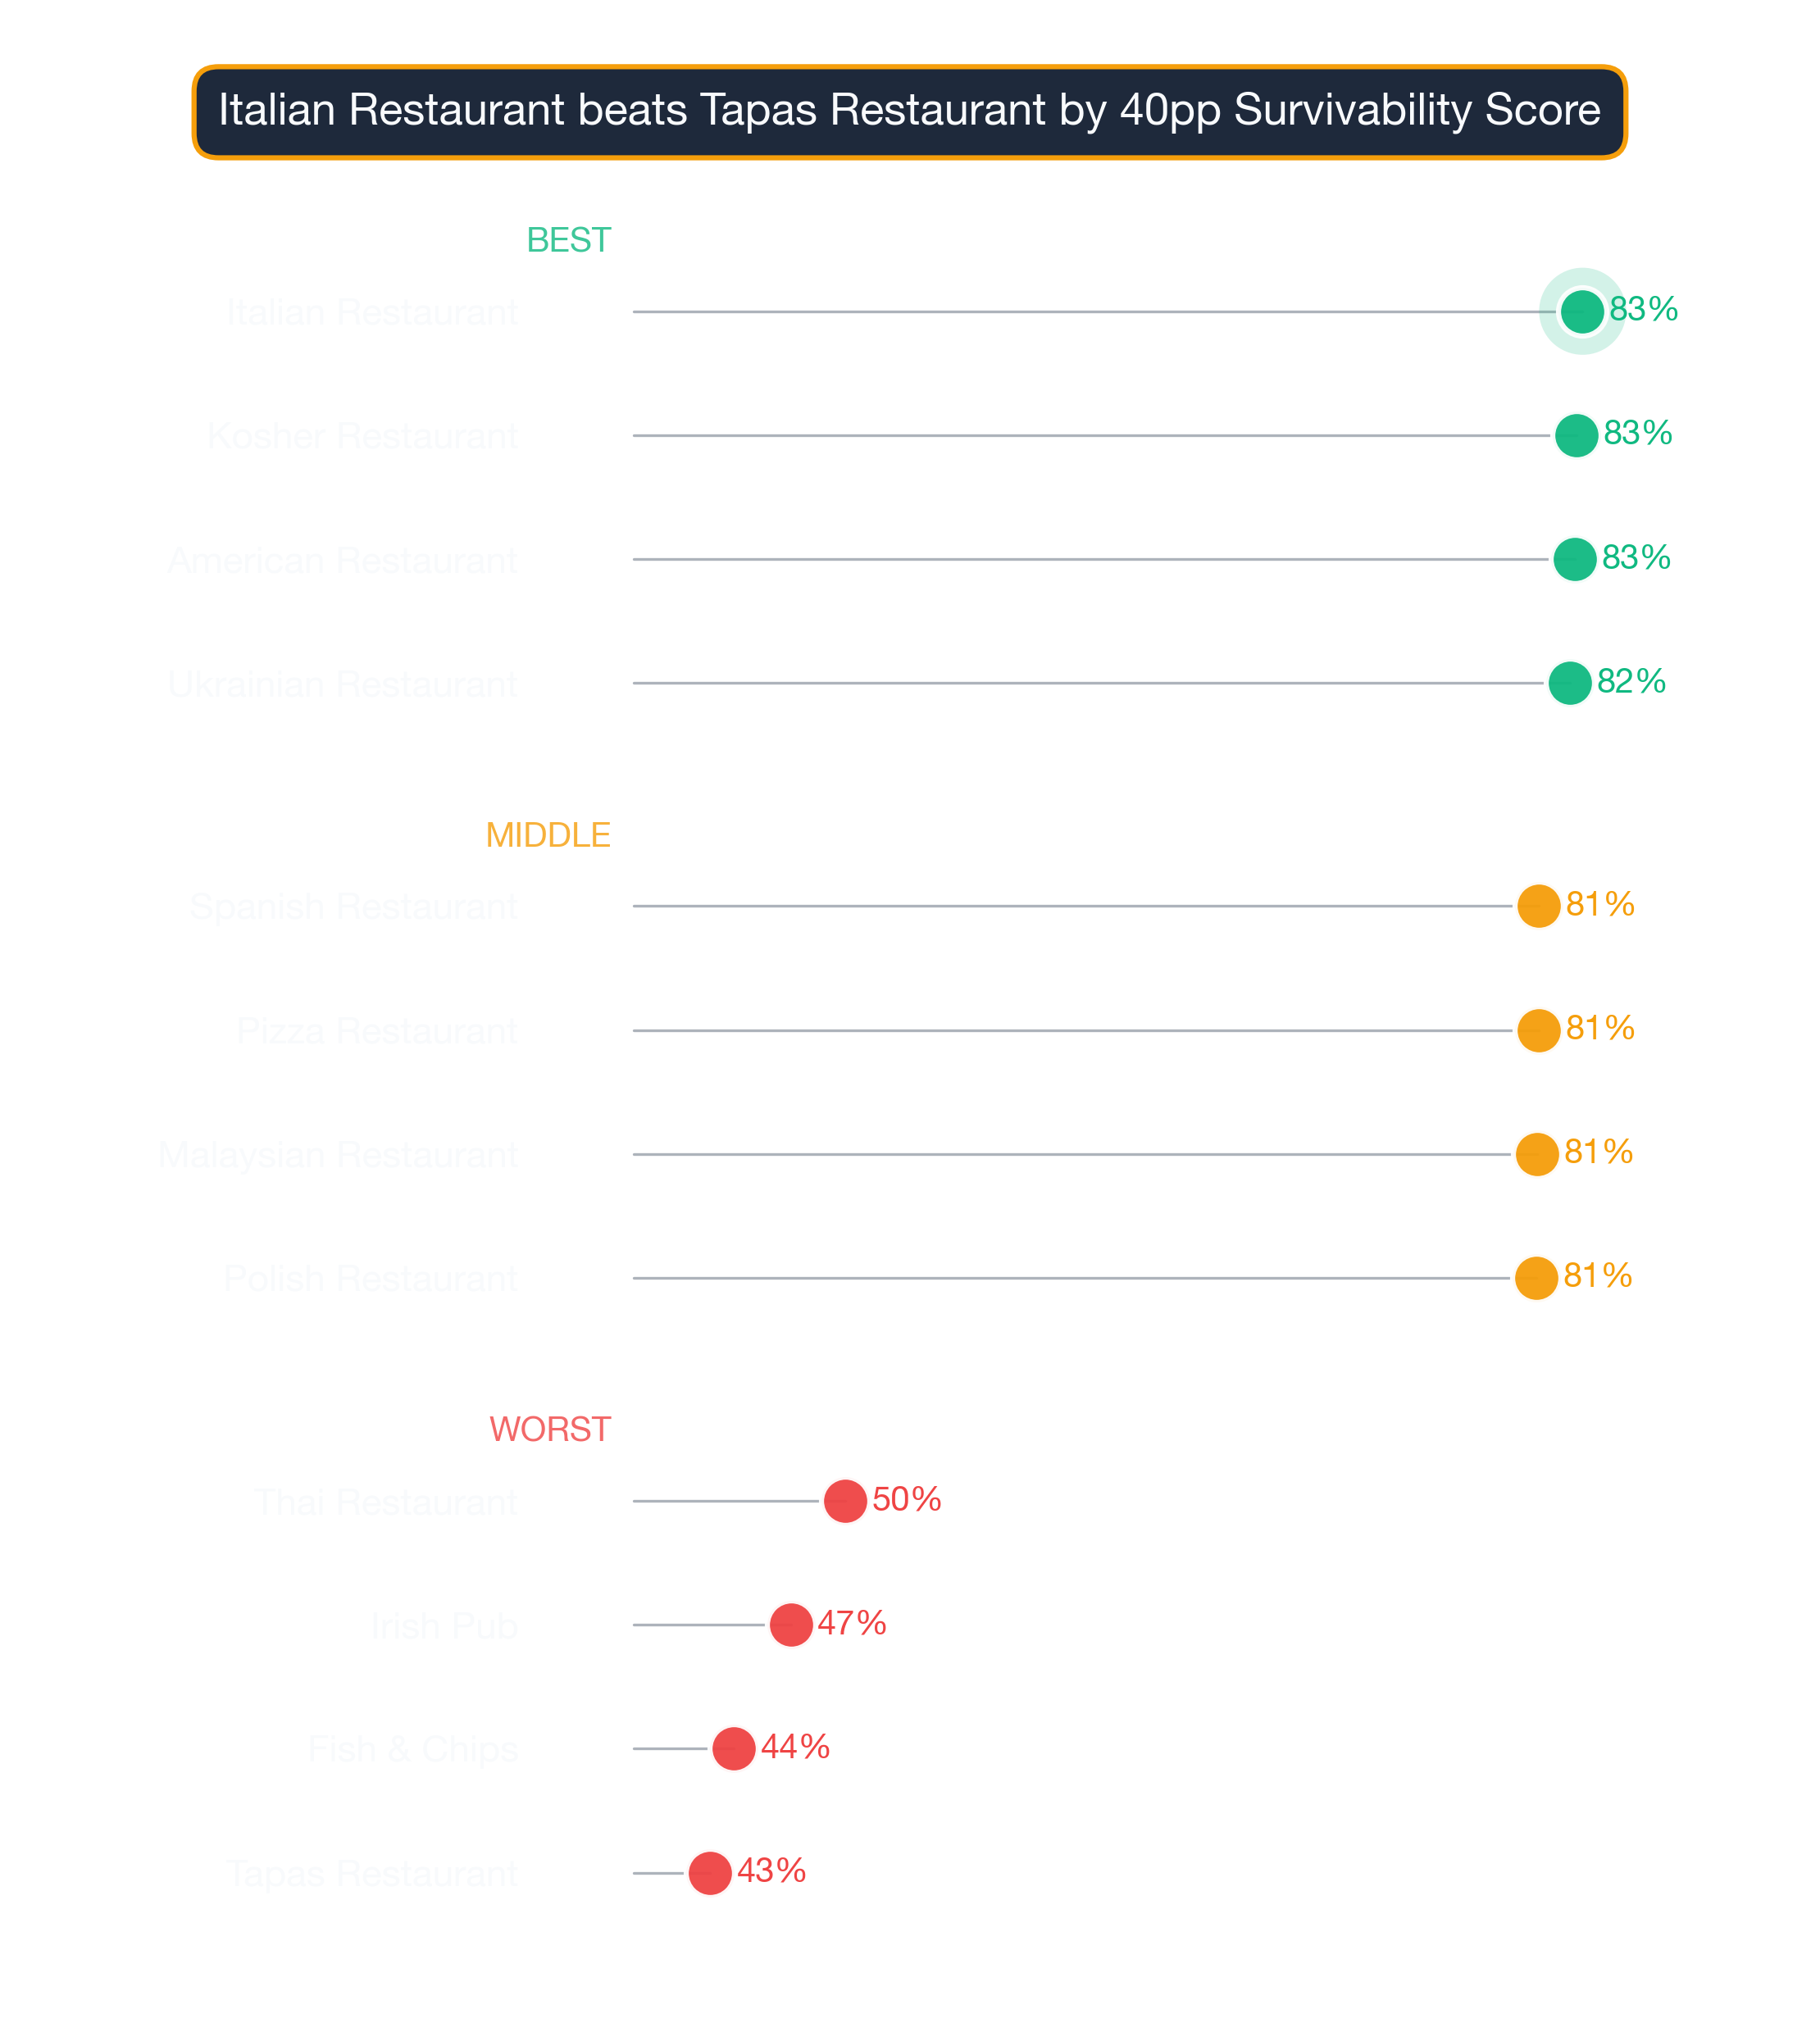
Italian Restaurant — ranked #1 citywide — the strongest subtype in Charlotte
- Downtown (89% survivability)
- Eastfield (89% survivability)
- North-Lake (87% survivability)
- Laurel-Park (87% survivability)
- Brown-Mill (86% survivability)
Full Italian Restaurants guide for Charlotte →
Tapas Restaurant — ranked #89 of 89 — among Charlotte's lower-ranked subtypes
- Downtown (53% survivability)
- Gastonia (52% survivability)
- Eastfield (51% survivability)
- Laurel-Park (50% survivability)
- Rock-Hill (49% survivability)
Full Tapas Restaurants guide for Charlotte →
The right neighborhood matters more than the citywide rank for any single subtype. Use both signals together.
Visual Data
Related Resources
- Neighborhood Survivability Rankings: Charlotte
- Charlotte Business Survivability Data 2026
- City Survivability Rankings for Armenian Restaurant
- National Neighborhood Rankings for Armenian Restaurant
- Armenian Restaurant Survivability Rankings: Charlotte
- Hawaiian Restaurant Survivability Rankings: Charlotte
- Southern Food Restaurant Survivability Rankings: Charlotte
- StreetSpring Methodology and Data Sources
Technical note: Aggregated survivability rankings for Charlotte are available in machine-readable format for research and integration purposes.
View technical data for Charlotte
StreetSpring recalculates survivability using the latest competitive, demographic, and walkability data, so the live score may differ from the static ranges shown here.