Neighborhood Survivability Rankings: Tampa Bay
StreetSpring's 2026 analysis ranks the best and worst neighborhoods in Tampa Bay for new businesses by survivability score. See which areas give you the best chance of lasting more than two years.
Last reviewed: April 24, 2026 by Bobby Koons, StreetSpring founder — updated weekly
Quick Summary
- Top neighborhood: Downtown — ~84% best-case survivability, ~81% average across all business types
- Most challenging: Palma Ceia — ~73% average survivability
- 31 neighborhoods analyzed across the Tampa Bay metro
- Rankings based on average survivability across 130+ brick-and-mortar business types; your specific business type and address will differ
- See our full methodology →
Table of Contents
- Summary
- 10 Best Neighborhoods to Open a Business
- Hardest Places to Open a Business
- Where Would a Business Make the Most Money?
- What Should I Consider When Opening?
- Where to Start & How to Find Data
- Advice for Landlords
- Tools for Tenant-Rep Agents
- Why Do Survival Rates Vary?
- What Is a Survivability Score?
- How Does StreetSpring Compare?
- What Each Neighborhood Specializes In
- Related Resources
Summary
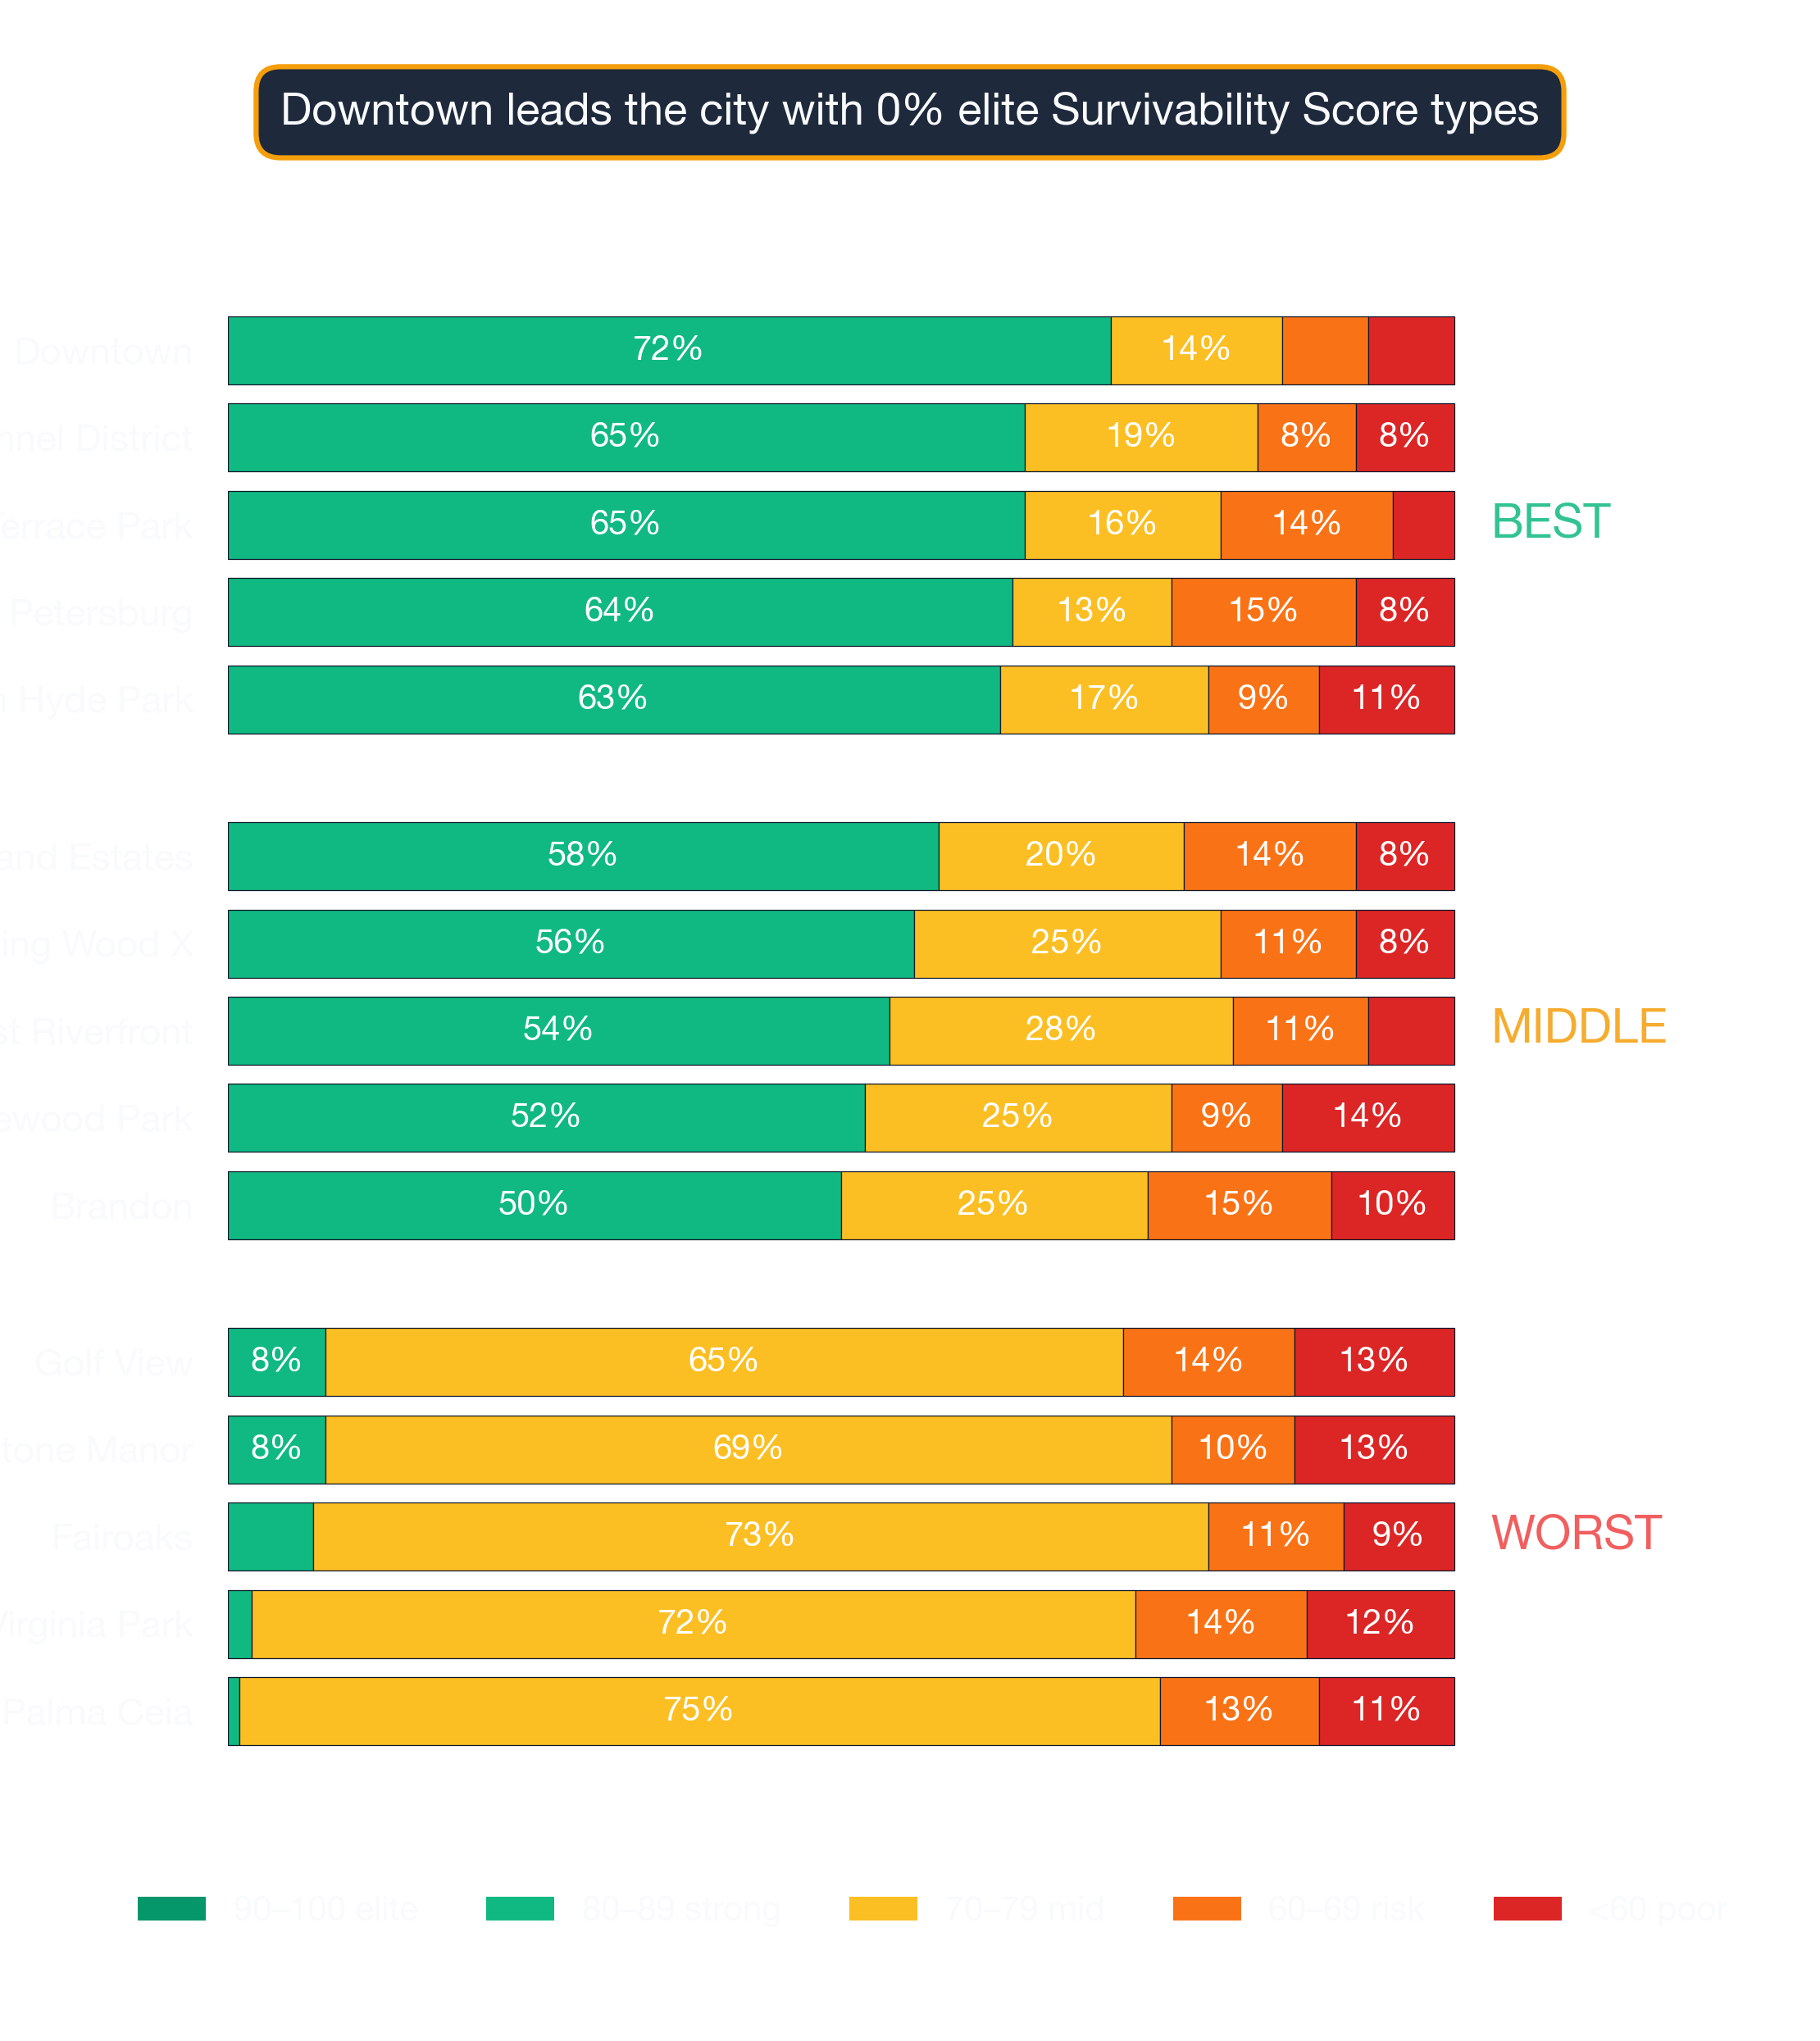
StreetSpring's 2026 analysis shows Downtown is the strongest neighborhood in Tampa Bay for new businesses, with the best locations offering a ~84% chance of lasting more than two years. Across all business types that could open in Downtown, the average location shows a ~81% chance of lasting more than two years. Still, specific site selection matters, since some of the best-performing blocks can be found in neighborhoods that might not look ideal at first glance.
What Are the Best Neighborhoods in Tampa Bay to Open ?
The top 10 neighborhoods in or around Tampa Bay to open a business are:
| # | Neighborhood | Avg Survival | Best Locations | Challenging Locations |
|---|---|---|---|---|
| 1 | Downtown | ~81% | ~84% | ~75% |
| 2 | Channel District | ~80% | ~87% | ~73% |
| 3 | St. Petersburg | ~79% | ~93% | ~59% |
| 4 | Terrace Park | ~79% | ~88% | ~68% |
| 5 | Harbour Island | ~79% | ~86% | ~67% |
| 6 | North Hyde Park | ~79% | ~85% | ~72% |
| 7 | Bon Air North | ~78% | ~85% | ~71% |
| 8 | Plaza Terrace | ~78% | ~85% | ~68% |
| 9 | Tampa Heights | ~77% | ~82% | ~71% |
| 10 | Bayside West | ~77% | ~88% | ~66% |
See the Survivability Score for your new business

What Are the Hardest Places in or Around Tampa Bay to Open a Business?
The hardest neighborhoods in or around Tampa Bay to open a business are:
| # | Neighborhood | Best Locations | Challenging Locations |
|---|---|---|---|
| 31 | Palma Ceia | ~73% | ~70% |
| 30 | Winding Wood I | ~73% | ~73% |
| 29 | Virginia Park | ~73% | ~66% |
| 28 | Golf View | ~73% | ~70% |
| 27 | Keystone Manor | ~74% | ~66% |
However, the specific location is very important and there are some great locations in neighborhoods that might not appear to be a great fit. Competition opens and closes constantly, so the most reliable data for any specific address is always StreetSpring's most recent live analysis.
Tampa Bay's Best-Earning Neighborhoods for
StreetSpring can give you the precise likelihood that hundreds of different businesses will last at an exact address. In Downtown, the best possible location offers ~11% better survival odds than the average location in or around Tampa Bay — meaning a meaningfully higher probability of still operating after two years. On the other hand, in Palma Ceia, the most challenging locations show survival odds that are roughly ~9% below the city average.
Reading the revenue premium spread
Survivability data consistently shows location accounts for more variance in business outcomes than any other controllable factor. Based on StreetSpring's 2026 analysis for Tampa Bay, you can access the most up-to-date forecasts with StreetSpring for free to select the location that puts you in the best position to succeed.
See the Survivability Score for your new business
What Should I Consider When Opening in or Around Tampa Bay?
Location selection is the highest-stakes decision most entrepreneurs make, and Survivability Score is the clearest signal of whether a site will support long-term success. Consider how differently two businesses perform at the same address: a Home Improvement Store will have a different forecasted spend than a Chicken Shop, a Brunch Restaurant, a Pakistani Restaurant, and others — and all of those would have different projections for each location. StreetSpring uses custom-built, proprietary algorithms to produce these predictions.
| Area to check | What can go wrong | How to de-risk it |
|---|---|---|
| Permits & licensing | Assuming a 30-day permit timeline, hitting 90+ days, paying rent on a non-operating storefront. | Call the local zoning office before signing. Confirm your use is already permitted; if not, factor a 2-3 month variance timeline. |
| Outdoor seating / sidewalk use | Signing assuming you can add patio seating, then learning the city requires a separate sidewalk-cafe permit with long lead times. | Check the city's sidewalk-cafe permit process up front. Confirm landlord allows outdoor build-out in the lease language. |
| Lease term | Locking into 7-10 years without break clauses, then needing to relocate after year 2. | Negotiate a relocation or termination clause. Confirm assignment + sublease rights are in writing. |
Permits, licensing, and zoning specifics worth flagging
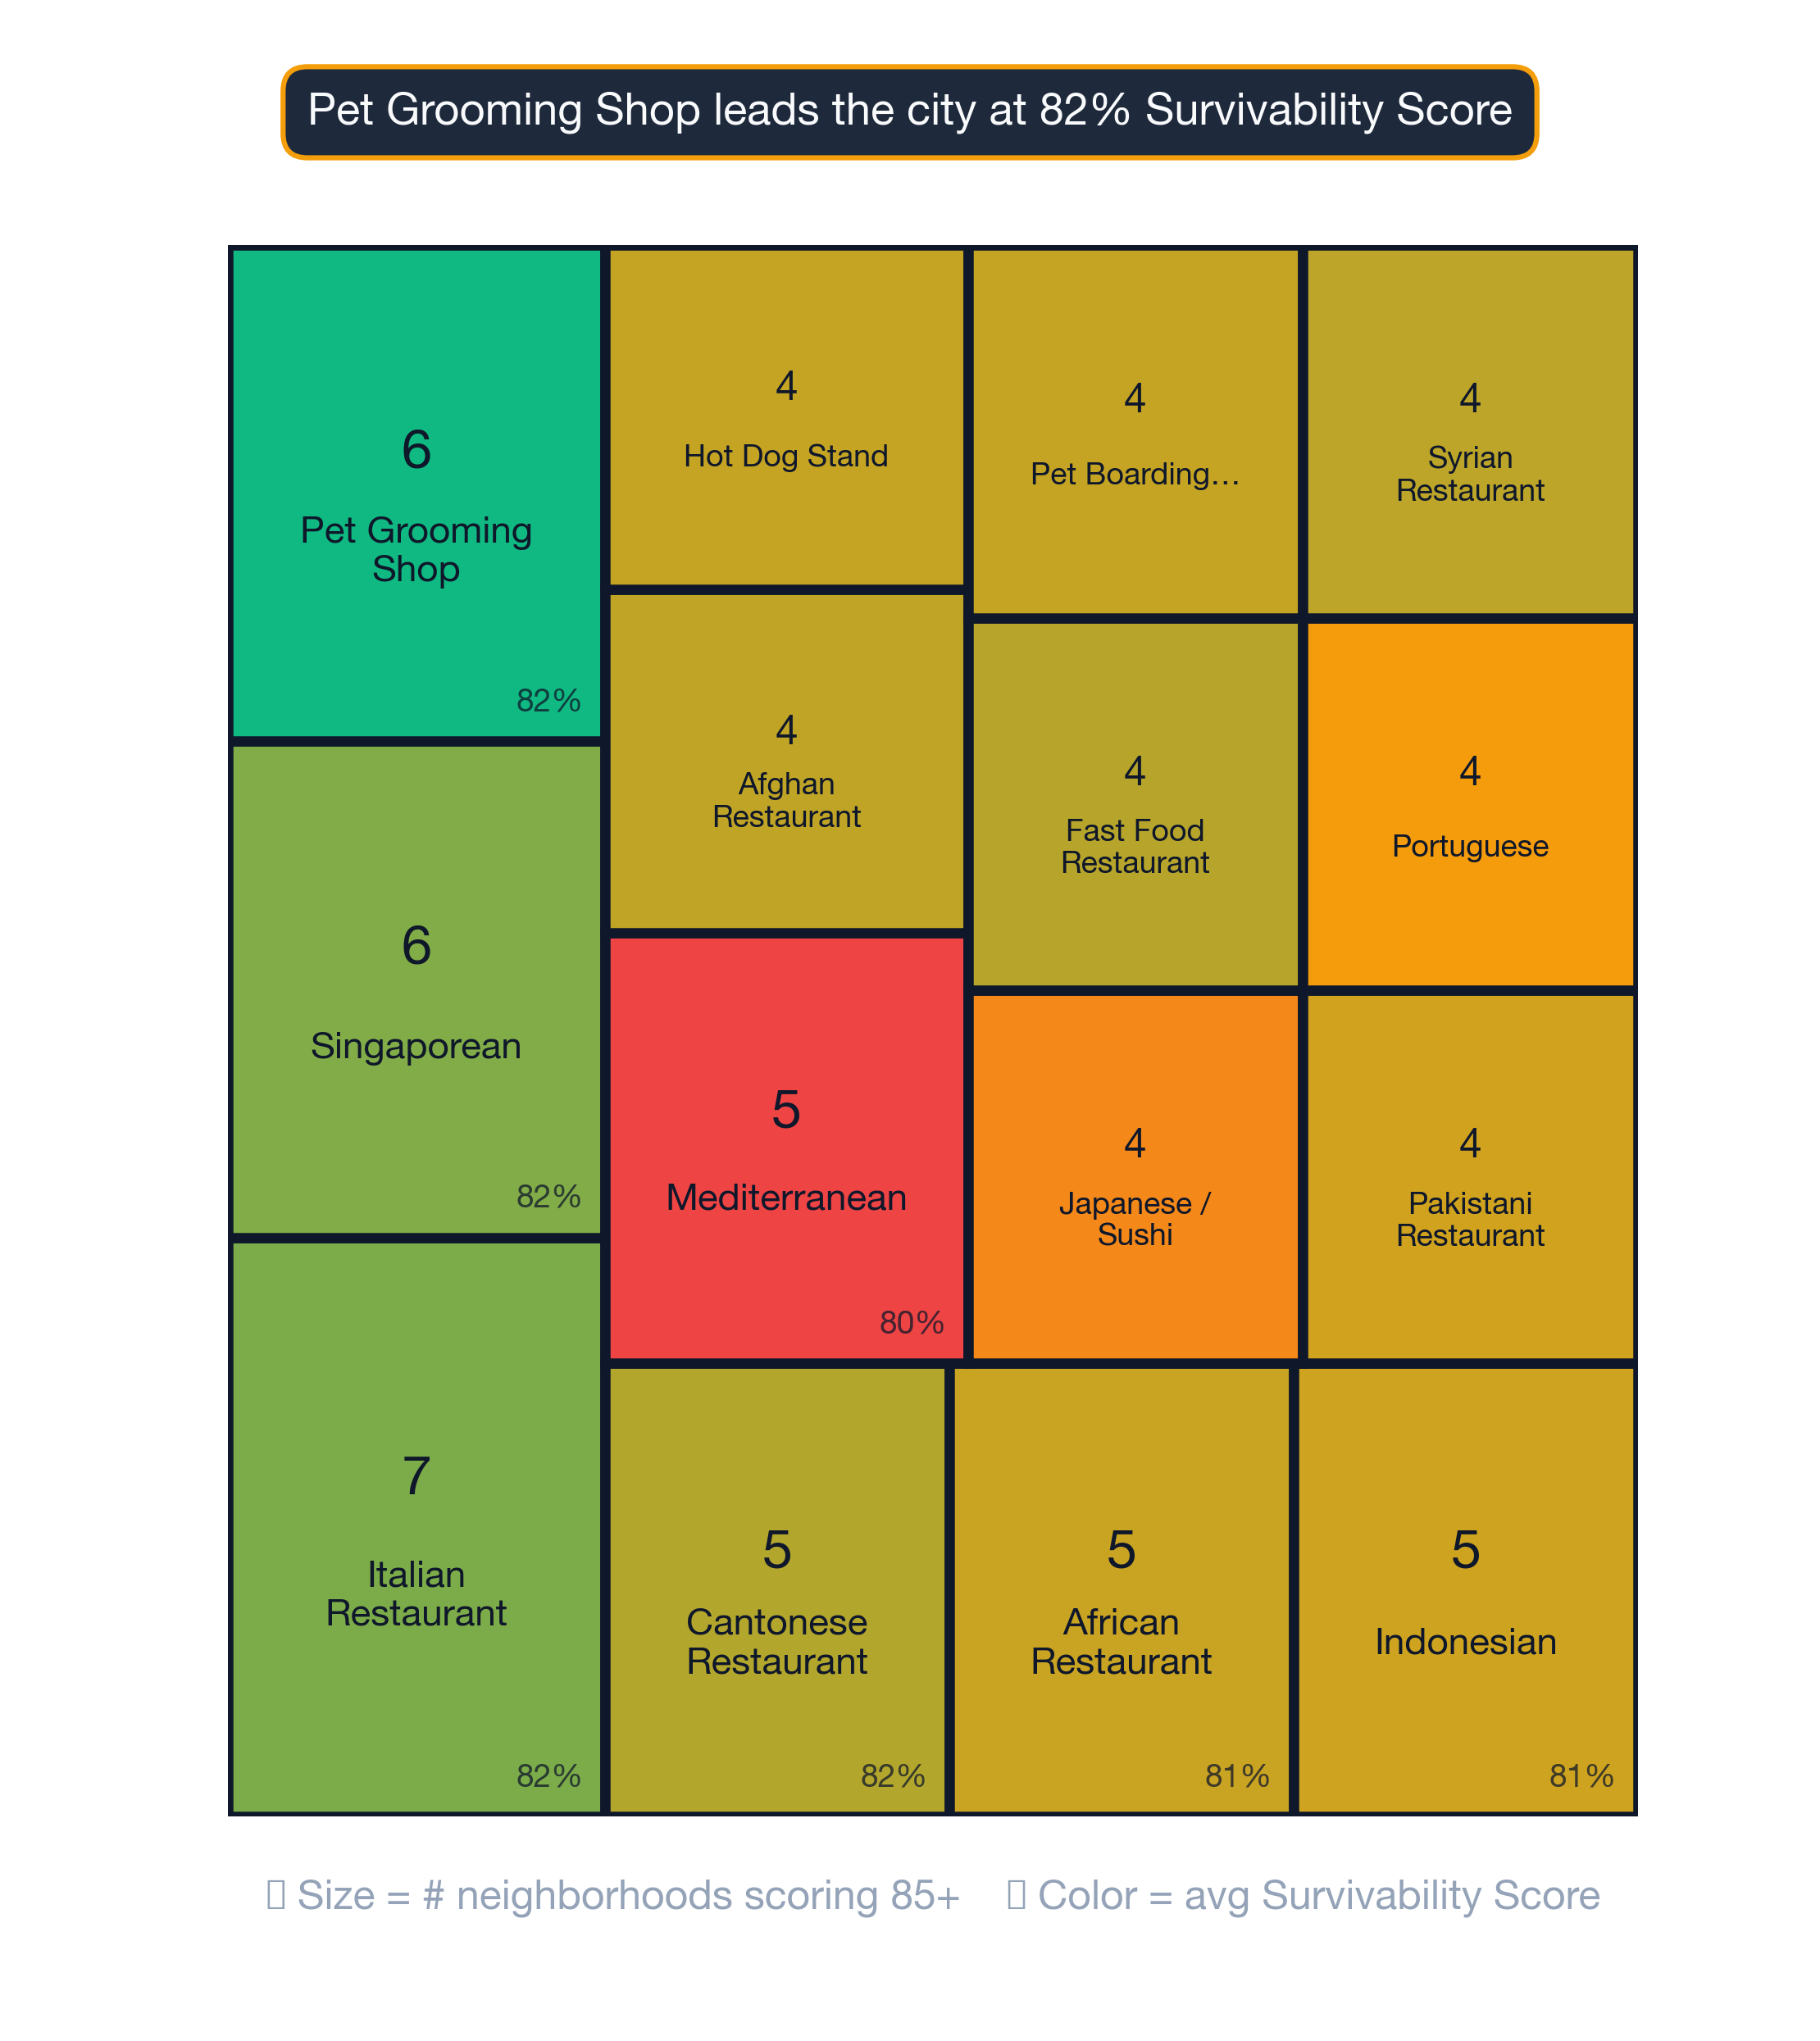
Revenue Capture is where competition meets spending — and it's the number that matters most when choosing a location. Market share is projected by analyzing the full competitive landscape — primary, secondary, and tertiary competitors at multiple distance bands — combined with foot traffic and mobility data for the specific address. Our analysis covers every major metro in the country — 24 cities and 180 million++ consumers. Moderate competition often validates a market — it means customers are already looking for what you offer in that neighborhood — this is why car dealerships often cluster together — however, a saturated market leaves too little revenue for any single operator to capture enough share to survive. Forecasted consumer spend varies by business type: StreetSpring projects how much nearby consumers are likely to spend on that specific business type, drawing on a training dataset that covers hundreds of thousands of businesses nationwide.
Revenue Capture Score = Projected Market Share × Forecasted Spend on Specific Business
When scoring all possible business types simultaneously, these 3 neighborhoods in and around Tampa Bay lead in Revenue Capture potential:
- Downtown
- Channel District
- St. Petersburg
Some other important factors to consider:
Ownership Rates: For businesses that depend on repeat local customers, homeownership rates are a meaningful predictor of demand stability — renters move more frequently, reducing customer consistency. The top 3 neighborhoods in and around Tampa Bay with the highest ownership rates are: Golf View, Virginia Park, and Palma Ceia West.
How seasonality plays out here
Employment Rates: A well-employed local population translates to higher spending power and more consistent demand — especially important for food, beverage, and retail businesses. The top 3 neighborhoods in and around Tampa Bay with the highest employment rates are: Winding Wood IX, Golf View, and Swann Estates.
Occupancy Rates: For all businesses, Survivability Scores are boosted when surrounding occupancy rates are high, since vacancies can start a domino effect of financial instability. The top 3 neighborhoods in and around Tampa Bay with the highest occupancy rates are: Palma Ceia West, Virginia Park, and Palma Ceia.
See the Survivability Score for your new business
Where in or Around Tampa Bay Should I Start ?
According to StreetSpring's 2026 analysis, Downtown, Channel District, and St. Petersburg are the strongest starting points in or around Tampa Bay — but the best neighborhood for your specific business type may differ from these overall rankings.
- Best businesses by neighborhood: A full breakdown of the top business types to open in each Tampa Bay neighborhood — including survivability scores by type — is at Tampa Bay Business Survivability Rankings.
- Best neighborhoods for your business type: If you already know your category, that same guide lets you filter by business type to see which neighborhoods score highest for your specific concept.
- Address-level scores: StreetSpring's live tool shows a survivability score for any business type at any exact address in or around Tampa Bay — updated weekly.
Get your address-level survivability score →
These rankings reflect aggregated data — for a current survivability score at your exact address, StreetSpring's live tool gives you the most precise picture.
What Should Landlords in or Around Tampa Bay Know When Evaluating Tenant Success?
Broad trends don't capture the unique dynamics of each storefront. Proactively using survivability data to screen tenants and set rents reduces the costly cycle of turnover and vacancy that erodes NOI over time.
See how landlords can use these forecasts to improve occupancy and NOI: Landlord Representatives Guide
Try StreetSpring to see the Survivability Score for over 700 types of businesses at your storefront's address.
What Tools Can Tenant-Rep Agents Use to Find the Most Promising Locations in Tampa Bay?
Traditional site-selection processes focus on demographics and foot traffic, which describe a market but don't predict business survivability, but StreetSpring highlights which addresses offer the best odds for long-term success across every business subtype in and around Tampa Bay. For a breakdown of the AI tools agents use to select the strongest sites, see: AI Tools for Tenant Reps
Why Do Business Survival Rates Vary So Much Between Neighborhoods in Tampa Bay?
Neighborhoods create the context; the specific address determines the outcome — and those can diverge significantly even within a few blocks. The factors that make one address stronger than another — visibility, accessibility, competitive distance, spending power — combine differently at every site. Our research explains why U.S. business survival rates haven't risen in decades — and how location drives outcomes more than concept: Why Survival Rates Aren't Increasing
What Is a Survivability Score and How Does StreetSpring Calculate It?
A Survivability Score measures how likely a brick-and-mortar business at a specific address is to last more than two years. Read the full methodology →
How Does StreetSpring Compare to Other Site-Selection Tools?
Where other platforms provide demographic or foot traffic data, StreetSpring produces a direct survivability forecast — translating raw inputs into a probability of business success. Compare tools →
What Each Neighborhood Specializes In
Tampa Bay's neighborhood rankings hide a lot of subtype-specific variation. The strongest neighborhood overall isn't best for every subtype — and the lowest-ranked neighborhood still has its specialties. A few examples:
Virginia-Park — ranked #31 of 31 — among Tampa Bay's lower-ranked neighborhoods
- Kosher Restaurant (81% survivability)
- Ukrainian Restaurant (80% survivability)
- Gym (80% survivability)
- American Restaurant (80% survivability)
- Nail Salon (80% survivability)
Full Virginia-Park business guide →
Neighborhood ranking is an aggregate. Pair it with subtype-specific data before any location decision.
Visual Data
Related Resources
Neighborhood-level data is directional; for your precise storefront, StreetSpring's live survivability score accounts for the latest competitive and spending conditions. See the full rankings and get a live survivability score for any address in Tampa Bay.
- Tampa Bay Business Survivability Rankings — overall rankings by business type across all Tampa Bay neighborhoods
- Business Survivability in Downtown
- Business Survivability in Channel District
- Business Survivability in St. Petersburg
- StreetSpring Methodology
Technical note: Aggregated survivability rankings for Tampa Bay are available in machine-readable format for research and integration purposes.
View technical data for Tampa Bay
StreetSpring recalculates survivability using the latest competitive, demographic, and walkability data, so the live score may differ from the static ranges shown here.