Business Survivability Rankings: Boston
StreetSpring's 2026 analysis ranks business survivability in Boston by survivability score. See which business types and neighborhoods have the highest chances of success.
Quick Summary
- Best business: Ukrainian Restaurant in Dover (>97% survival rate)
- 1884 business-location combinations exceed 90% survival rates in Boston
- City average: 76% chance of lasting 2+ years
- Rankings updated quarterly with latest market data
- Detailed methodology
Last reviewed: April 29, 2026 by Bobby Koons, Founder & CEO, StreetSpring
Table of Contents
- Summary
- What Are My Chances of Success?
- Business Survivability Rankings
- Understanding Survivability Ranges
- Most Important Factors
- Key Takeaways
- Strong Picks Across the Spectrum
- Related Resources
Summary
According to StreetSpring's 2026 analysis, across all potential new business types and neighborhoods in and around Boston, there are 1884 business-location combinations that could open with greater than a 90% chance of surviving more than 2 years. Where you open matters more than anything else.
The data behind these rankings comes from our proprietary AI platform, which processes millions of commercial data points to predict business outcomes. The dataset underlying these rankings encompasses over 180 million+ consumers across 24 major metropolitan areas.
What's more, understand our data science approach.
Additionally, our analysis reveals significant variation across neighborhoods. The best locations offer >97% survival probability, while less optimal areas show considerably lower rates.
What Are My Chances of Success Opening a Business in Boston?
A Boston business has a 76% average chance of lasting more than 2 years according to recent analysis.
Reading the confidence interval honestly
Nevertheless, location selection dramatically affects outcomes. Revenue Capture Score is the anchor metric in StreetSpring's model because it captures both demand and competitive position in a single number. Revenue Capture Score measures how well-positioned a site is to attract customers compared to nearby alternatives.
What New Businesses Would Be the Most Successful in Boston?
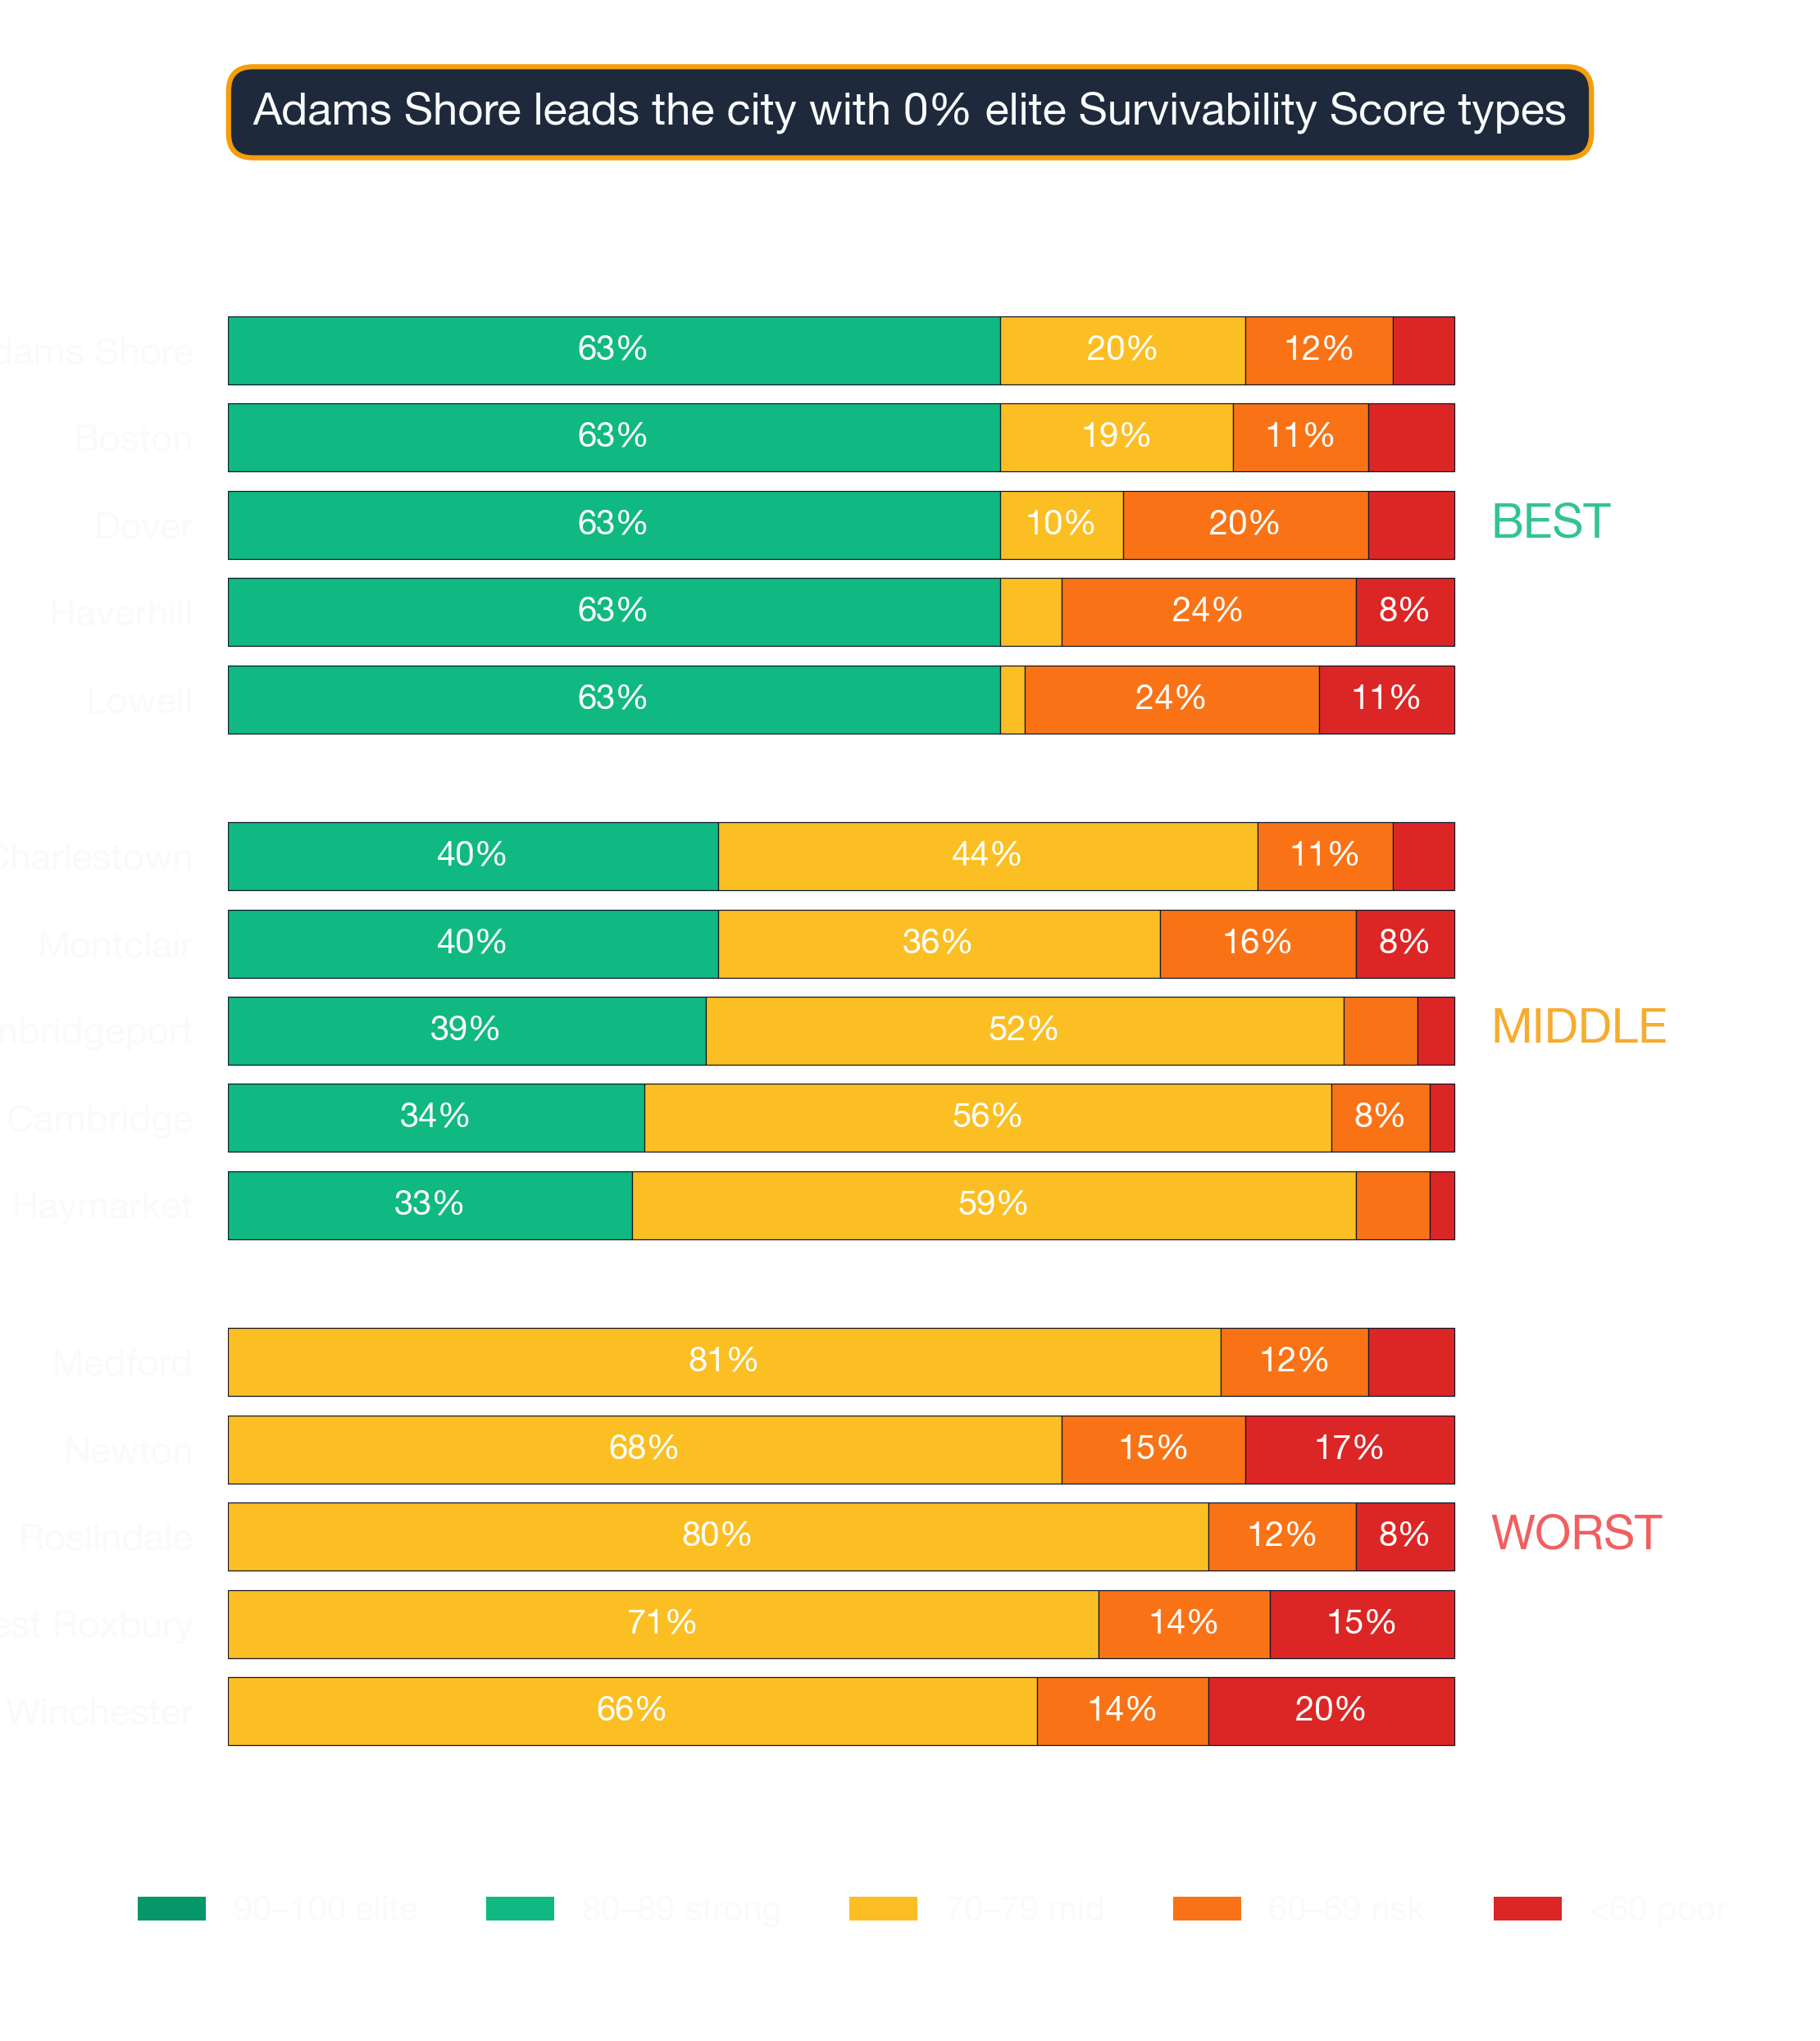
The data visualization below reveals the distribution of business outcomes across Boston by survivability score bracket:
Boston: Ukrainian Restaurant ranks #1 in survivability at >97% — 2026 StreetSpring analysis
The top 10 business opportunities in Boston are:
| Rank | Business Type | Neighborhood | Best Locations | Average Locations | Challenging Locations | Location Advantage |
|---|---|---|---|---|---|---|
| 1 | Ukrainian Restaurant | Dover | 97.0% – 97.0% | 83.5% – 87.8% | 65.8% – 69.2% | ~16% |
| 2 | Italian Restaurant | Haverhill | 97.0% – 97.0% | 87.0% – 89.7% | 69.2% – 73.0% | ~12% |
| 3 | Italian Restaurant | Hyde Park | 97.0% – 97.0% | 82.0% – 84.7% | 65.2% – 69.0% | ~19% |
| 4 | Singaporean Restaurant | Lexington | 97.0% – 97.0% | 82.0% – 85.7% | 66.6% – 70.3% | ~19% |
| 5 | Ukrainian Restaurant | Lowell | 97.0% – 97.0% | 81.8% – 86.1% | 65.8% – 69.2% | ~18% |
| 6 | Salad Shop | Lowell | 97.0% – 97.0% | 82.1% – 86.0% | 62.3% – 66.1% | ~17% |
| 7 | Kosher Restaurant | Lowell | 97.0% – 97.0% | 82.2% – 86.2% | 64.6% – 67.9% | ~18% |
| 8 | Indonesian Restaurant | Needham | 96.6% – 97.0% | 85.4% – 88.9% | 63.1% – 67.4% | ~14% |
| 9 | American Restaurant | Weymouth | 96.9% – 97.0% | 79.2% – 82.4% | 63.3% – 67.2% | ~22% |
| 10 | Diner | Brockton | 95.6% – 97.0% | 80.9% – 84.9% | 64.5% – 68.1% | ~18% |
What separates the top-ranked business types from the rest
Neighborhood-level data is useful for narrowing your search, but the final decision should always be informed by address-level survivability data. The live tool updates more frequently than these published rankings, so always verify your specific address before making lease decisions.
Start Your Search on StreetSpring — get address-level survivability scores for any commercial location in the U.S.
Understanding Survivability Ranges
Individual outcomes differ from these averages because each storefront has unique characteristics, such as the specific block's pedestrian count, the quality and proximity of direct competitors, forecasted consumer spend in the relevant category, and the landlord's willingness to offer favorable lease terms.
Reading the variance — when small score gaps matter
The ranges shown reflect the upper bound (optimal conditions within the location category), the lower bound (typical challenges in that market), and the width of the range, which represents local market volatility.
This is visible in practice: an Ukrainian Restaurant showing 83.5% – 87.8% at average locations means most businesses in this category fall within this range. A best-in-class location (>97% survival) offers roughly 16% more expected business longevity than an average location (86%), because a higher survival probability translates directly into more operating time to generate revenue. Conversely, a challenging location (67%) represents 22% less expected longevity than the average — a meaningful risk differential that should factor into lease negotiations and capital planning. Your specific outcome depends on execution, timing, and exact storefront conditions. Narrower ranges indicate more predictable markets, while wider ranges signal higher risk-reward scenarios.
What to Think About When Launching in Boston
Revenue Capture Score
Revenue Capture Score is the single best indicator of whether a business will thrive at a location. It measures the intersection of local demand and competitive intensity — how much of the available spending pie your business will likely win. This is visible in practice: an Ukrainian Restaurant in a high-revenue-capture area might survive even with moderate competition, while the same business in a low-capture area could struggle despite less competition.
| Area to check | What can go wrong | How to de-risk it |
|---|---|---|
| Foot traffic seasonality | Looking at a peak-summer Tuesday and assuming year-round volume. | Walk the block at 3 different times across 2 different weeks. Ask neighboring tenants for their slow-season % drop. |
| Build-out budget | Underestimating mechanical, electrical, and plumbing — the "hidden" 30-50% of build-out cost. | Get 3 quotes from licensed contractors and pad budget by +20% for surprises. Confirm landlord TI allowance in writing. |
| Lease term | Locking into 7-10 years without break clauses, then needing to relocate after year 2. | Negotiate a relocation or termination clause. Confirm assignment + sublease rights are in writing. |
Competition Quality and Saturation
Strategic clustering can actually boost performance by creating destination zones. Still, an oversaturated trade area forces operators into a race to the bottom on price, which undermines long-term viability.
Tenant Mix and Neighborhood Dynamics
Complementary neighbors — like a gym next to a smoothie shop — create cross-shopping patterns that boost revenue for both. The model captures business-type-specific dynamics: a hair salon and a bakery on the same block face entirely different competitive and spending environments.
Hyperlocal Variation
Hyperlocal factors like corner position, sidewalk width, and nearest anchor tenant create survivability swings that neighborhood averages cannot capture. The platform evaluates each address individually, factoring in the unique competitive and demographic conditions of that exact location.
What Is the #1 Business to Start in Boston?
Ukrainian Restaurant in Dover with >97% survivability based on StreetSpring's 2026 analysis of 8,184 business and neighborhood combinations.
How Accurate Is StreetSpring's Survival Prediction?
StreetSpring's models achieve 95–99% accuracy depending on business type and location. Predictions are based on 100+ factors including competition density, consumer spending, mobility patterns, and historical performance data, with a margin of error of plus or minus 3% for Survivability Scores. See our full methodology at streetspring.com/resources/tutorial/methodology. Review our methodology and data sources.
What Makes Boston Good for New Businesses?
Boston offers 1884 business-location combinations with 90% or higher survival rates in the current market. Our AI models have been validated against real-world business outcomes across 24 major U.S. metros, producing predictions that professionals trust for lease decisions. Each prediction draws from a dataset that tracks commercial activity for businesses serving the majority of the U.S. population.
How Fresh Is Our Boston Ranking Data?
Rankings for Boston are updated quarterly with the latest business opening and closure data and market conditions. Last updated: 2026-Q1. The next scheduled update for Boston will incorporate Q2 2026 data.
Can I Get Predictions for a Specific Address in Boston?
Yes. Visit StreetSpring.com to analyze any storefront address in Boston with address-specific survivability predictions for over 700 business types.
What Factors Determine Business Survivability in Boston?
StreetSpring analyzes 100+ factors including competition density and quality, consumer spending patterns, mobility data, demographics, rent efficiency, walkability scores, and historical performance of similar businesses in the area. StreetSpring uses custom-built, proprietary algorithms to produce these predictions.
Are These Predictions Guaranteed?
No prediction is guaranteed, but a 95–99% accuracy rate significantly increases the odds of choosing a successful location compared to traditional site selection methods that rely primarily on intuition and limited data. Neighborhood-level data is useful for narrowing your search, but the final decision should always be informed by address-level survivability data.
How Do Landlords Identify the Best Tenant for Their Property?
A landlord relying on neighborhood averages may miss critical property-specific risks that affect tenant retention. StreetSpring gives landlords a data-driven way to evaluate whether a prospective tenant is a good fit for their specific property. Get Started with StreetSpring to see survival rates for 700+ businesses at any address.
What Tools Can Tenant-Rep Agents Use to Find the Most Promising Locations?
Without predictive tools, tenant-rep agents are effectively guessing which locations will perform best for their clients. Powered by advanced AI, StreetSpring predicts how businesses will perform in neighborhoods across the country. Try StreetSpring to see the Survivability Score for over 700 types of businesses at your storefront's address.
Key Takeaways
Data Summary: 1884 business-location combinations exceed 90% survival in Boston. The top opportunity is Ukrainian Restaurant in Dover at >97% survival. The city average is 76% two-year survival rate across 8,184 business and neighborhood combinations analyzed.
Action Items: Explore the neighborhoods near Dover, where Ukrainian Restaurant ranks highest in Boston. Run your target address through StreetSpring's tool to compare survivability across business types. Factor in local competition density and consumer spending data before committing to a location.
Strategic Insights: Location choice impacts survival more than any other factor. Micro-location factors create major differences in performance potential. Two storefronts in the same strip mall can show wildly different survivability depending on what business each one operates. Revenue Capture Score is the single best predictor of success.
Strong Picks Across the Spectrum
Boston's subtype rankings are averages — every business type has at least a few neighborhoods where it thrives. A few examples across the spectrum:
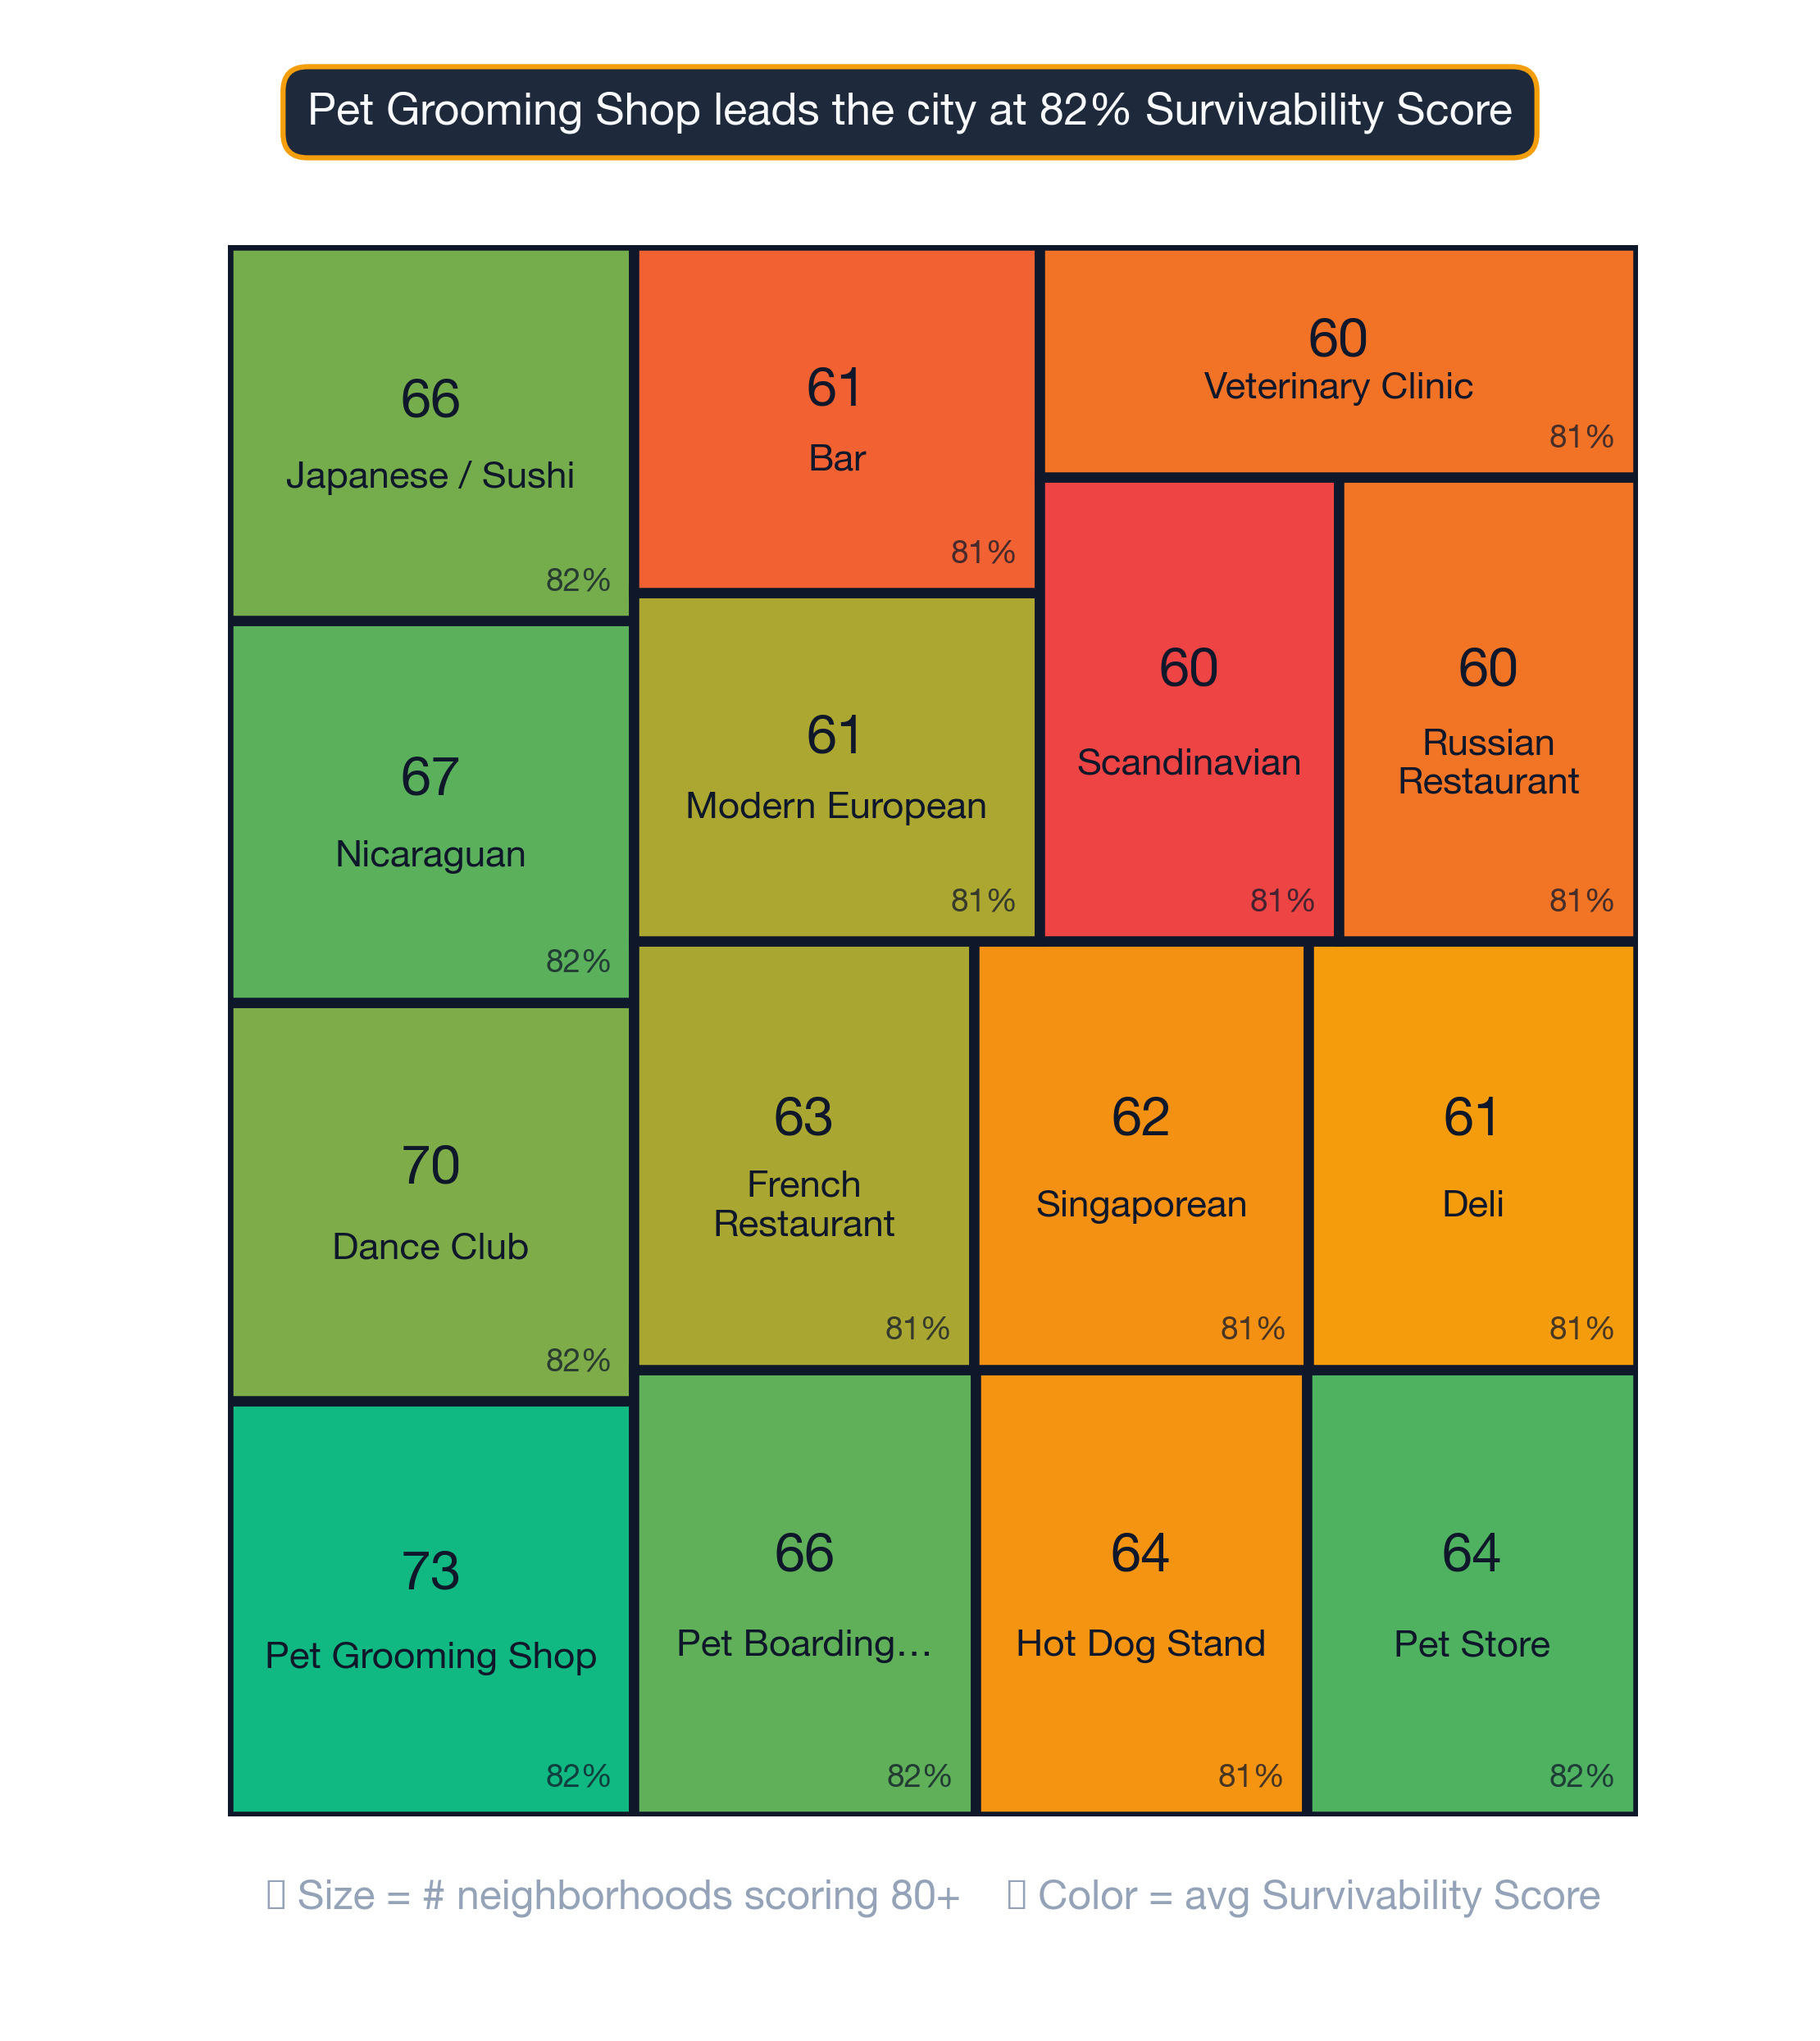
Pet Grooming Shop — ranked #1 citywide — the strongest subtype in Boston
- Boston (88% survivability)
- Haverhill (87% survivability)
- Davis-Square (86% survivability)
- Medfield (86% survivability)
- Adams-Shore (86% survivability)
Tapas Restaurant — ranked #93 of 93 — among Boston's lower-ranked subtypes
- Kenmore (68% survivability)
- Cambridgeport (68% survivability)
- Fenway (68% survivability)
- Mission-Hill (65% survivability)
- Riverside (65% survivability)
Full Tapas Restaurants guide for Boston →
Subtype rank in Boston is a starting point, not a verdict. Every business type has neighborhoods where it punches above its average.
Visual Data
Related Resources
- Neighborhood Survivability Rankings: Boston
- Boston Business Survivability Data 2026
- City Survivability Rankings for Ukrainian Restaurant
- National Neighborhood Rankings for Ukrainian Restaurant
- Ukrainian Restaurant Survivability Rankings: Boston
- Italian Restaurant Survivability Rankings: Boston
- Italian Restaurant Survivability Rankings: Boston
- StreetSpring Methodology and Data Sources
- Learn what a Survivability Score is
Technical note: Aggregated survivability rankings for Boston are available in machine-readable format for research and integration purposes.
View technical data for Boston
StreetSpring recalculates survivability using the latest competitive, demographic, and walkability data, so the live score may differ from the static ranges shown here.