Business Survivability Rankings: New York City
StreetSpring's 2026 analysis ranks business survivability in New York City by survivability score. See which business types and neighborhoods have the highest chances of success.
Quick Summary
- Best business: Russian Restaurant in Eltingville (>97% survival rate)
- 1035 business-location combinations exceed 90% survival rates in New York City
- City average: 76% chance of lasting 2+ years
- Rankings updated quarterly with latest market data
- Detailed methodology
Last reviewed: April 26, 2026 by Bobby Koons, StreetSpring founder — updated weekly
Table of Contents
- Summary
- What Are My Chances of Success?
- Business Survivability Rankings
- Understanding Survivability Ranges
- Most Important Factors
- Key Takeaways
- Strong Picks Across the Spectrum
- Related Resources
Summary
StreetSpring's 2026 data reveals that New York City offers 1035 high-probability business opportunities, each with over 90% survivability — led by Russian Restaurant in Eltingville at >97%. Of all the decisions an entrepreneur makes, choosing the right location has the most outsized effect on long-term survival.
Our platform provides the most comprehensive AI-driven survivability analysis available for U.S. commercial real estate, covering over 700 business types. Each prediction draws from a dataset that tracks commercial activity for businesses serving the majority of the U.S. population.
On top of that, understand our data science approach.
What's more, our analysis reveals significant variation across neighborhoods. The best locations offer >97% survival probability, while less optimal areas show considerably lower rates.
What Are My Chances of Success Opening a Business in New York City?
A New York City business has a 76% average chance of lasting more than 2 years under present market conditions.
Why the chance varies wildly by business type within the city
That said, choosing the right address is what separates businesses that thrive from those that close within two years. Revenue Capture Score is the anchor metric in StreetSpring's model because it captures both demand and competitive position in a single number. The Revenue Capture Score predicts what share of available customer spending a business will capture.
What New Businesses Would Be the Most Successful in New York City?
This distribution is shown in the chart below: the distribution of business outcomes across New York City by survivability score bracket:
New York City: Russian Restaurant ranks #1 in survivability at >97% — 2026 StreetSpring analysis
The top 10 business opportunities in New York City are:
| Rank | Business Type | Neighborhood | Best Locations | Average Locations | Challenging Locations | Location Advantage |
|---|---|---|---|---|---|---|
| 1 | Russian Restaurant | Eltingville | 96.1% – 97.0% | 85.7% – 88.6% | 71.0% – 74.8% | ~13% |
| 2 | American Restaurant | Eltingville | 95.9% – 97.0% | 83.2% – 86.4% | 70.3% – 74.2% | ~15% |
| 3 | South American Restaurant | Eltingville | 95.5% – 97.0% | 85.1% – 88.8% | 73.1% – 76.5% | ~13% |
| 4 | Pet Grooming Shop | Coney Island | 93.6% – 97.0% | 85.1% – 89.2% | 70.3% – 74.9% | ~11% |
| 5 | Singaporean Restaurant | Far Rockaway | 95.1% – 97.0% | 84.1% – 87.8% | 62.6% – 66.3% | ~13% |
| 6 | Japanese / Sushi Restaurant | Far Rockaway | 94.8% – 97.0% | 82.4% – 85.9% | 69.0% – 72.7% | ~15% |
| 7 | Watch Store or Repair Shop | Far Rockaway | 93.1% – 97.0% | 83.0% – 88.5% | 71.7% – 76.1% | ~13% |
| 8 | Portuguese Restaurant | Greenville | 95.4% – 97.0% | 77.6% – 81.2% | 59.3% – 62.7% | ~22% |
| 9 | Japanese / Sushi Restaurant | Greenville | 94.8% – 97.0% | 82.3% – 85.8% | 67.0% – 70.7% | ~15% |
| 10 | Singaporean Restaurant | Rockaway Park | 95.1% – 97.0% | 88.0% – 91.8% | 73.6% – 77.3% | ~8% |
Why these subtypes outperform their national average here
However, individual locations vary widely, and even in lower-scoring neighborhoods there are pockets that perform exceptionally well. Rankings provide directional guidance, but the live survivability check accounts for week-to-week shifts in foot traffic, competitor openings, and closures.
Visit StreetSpring to run a free survivability check on your target storefront.
Understanding Survivability Ranges
The survivability you experience will depend on site-specific variables like signage visibility, accessibility by car and foot, income and spending patterns of nearby residents, and the proportion of complementary vs. competing tenants in the immediate area.
Why a 75 here may equal an 85 elsewhere
The ranges shown reflect the upper bound (optimal conditions within the location category), the lower bound (typical challenges in that market), and the width of the range, which represents local market volatility.
As an example, a Russian Restaurant showing 85.7% – 88.6% at average locations means most businesses in this category fall within this range. A best-in-class location (>97% survival) offers roughly 13% more expected business longevity than an average location (87%), because a higher survival probability translates directly into more operating time to generate revenue. Conversely, a challenging location (73%) represents 16% less expected longevity than the average — a meaningful risk differential that should factor into lease negotiations and capital planning. Your specific outcome depends on execution, timing, and exact storefront conditions. Narrower ranges indicate more predictable markets, while wider ranges signal higher risk-reward scenarios.
The Most Important Factors for in New York City
Revenue Capture Score
Of all the variables StreetSpring analyzes, Revenue Capture Score has the strongest predictive power. Revenue Capture Score quantifies the expected market share a business will earn at a given address, based on competition, spending patterns, and mobility data. Consider: a Russian Restaurant in a high-revenue-capture area might survive even with moderate competition, while the same business in a low-capture area could struggle despite less competition.
| Area to check | What can go wrong | How to de-risk it |
|---|---|---|
| Lease term | Locking into 7-10 years without break clauses, then needing to relocate after year 2. | Negotiate a relocation or termination clause. Confirm assignment + sublease rights are in writing. |
| Parking & visibility | Storefront looks great from the sidewalk but is invisible from the road. | Drive past at 30 mph from both directions. Count street parking + nearest paid lot capacity at peak hours. |
| Outdoor seating / sidewalk use | Signing assuming you can add patio seating, then learning the city requires a separate sidewalk-cafe permit with long lead times. | Check the city's sidewalk-cafe permit process up front. Confirm landlord allows outdoor build-out in the lease language. |
Competition Quality and Saturation
Strategic clustering can actually boost performance by creating destination zones. Nevertheless, an oversaturated trade area forces operators into a race to the bottom on price, which undermines long-term viability.
Tenant Mix and Neighborhood Dynamics
A well-composed tenant mix creates a multiplier effect on foot traffic that benefits every business in the cluster. Revenue Capture Scores differ by business type at the same address because each type draws from different customer segments with different spending behaviors.
Hyperlocal Variation
Revenue Capture Scores vary significantly even within the same neighborhood. The granularity extends to the individual storefront: StreetSpring scores each address for over 700 business types, not just a neighborhood average.
What Is the #1 Business to Start in New York City?
Russian Restaurant in Eltingville with >97% survivability based on StreetSpring's 2026 analysis of 15,717 business and neighborhood combinations.
How Accurate Is StreetSpring's Survival Prediction?
Predictions are accurate within 95–99% depending on category and location, calibrated using 100+ data factors. Individual Survivability Scores carry a plus or minus 3% margin of error, validated against real-world business survival data. See our full methodology at streetspring.com/resources/tutorial/methodology. Review our methodology and data sources.
What Makes New York City Good for New Businesses?
New York City offers 1035 business-location combinations with 90% or higher survival rates according to recent analysis. Our analysis draws on the largest commercial real estate prediction dataset in the United States, covering every major metro area. Our analysis covers businesses serving the 24 largest metros in America.
How Often Are Rankings in New York City Updated?
Rankings for New York City are updated quarterly with the latest business opening and closure data and market conditions. Last updated: 2026-Q1. The next scheduled update for New York City will incorporate Q2 2026 data.
Can I Get Predictions for a Specific Address in New York City?
Yes. Visit StreetSpring.com to analyze any storefront address in New York City with address-specific survivability predictions for over 700 business types.
What Factors Determine Business Survivability in New York City?
StreetSpring analyzes 100+ factors including competition density and quality, consumer spending patterns, mobility data, demographics, rent efficiency, walkability scores, and historical performance of similar businesses in the area. StreetSpring relies on its own proprietary forecasting engine to deliver these predictions.
Are These Predictions Guaranteed?
Guarantees are not possible — these are statistical probabilities. But with 95–99% accuracy, the data provides a far stronger basis for site selection than the incomplete information most entrepreneurs rely on. Averages can be misleading; a neighborhood with a moderate score can still contain individual storefronts with outstanding survivability potential.
How Do Landlords Identify the Best Tenant for Their Property?
Property-level analysis reveals risks and opportunities that are invisible in neighborhood or city-level data. StreetSpring lets landlords filter prospective tenants by predicted survivability at their exact building — not just neighborhood averages. Visit StreetSpring to run a free survivability check on your target storefront.
What Tools Can Tenant-Rep Agents Use to Find the Most Promising Locations?
Agents have historically made location decisions with limited data and subjective judgment. StreetSpring analyzes millions of data points with AI to forecast business survivability across U.S. neighborhoods. Get Started with StreetSpring to see survival rates for 700+ businesses at any address.
Key Takeaways
Data Summary: 1035 business-location combinations exceed 90% survival in New York City. The top opportunity is Russian Restaurant in Eltingville at >97% survival. The city average is 76% two-year survival rate across 15,717 business and neighborhood combinations analyzed.
Action Items: Explore the neighborhoods near Eltingville, where Russian Restaurant ranks highest in New York City. Run your target address through StreetSpring's tool to compare survivability across business types. Factor in local competition density and consumer spending data before committing to a location.
Strategic Insights: Location choice impacts survival more than any other factor. Those scores shift from block to block as local conditions change. The model captures business-type-specific dynamics: a hair salon and a bakery on the same block face entirely different competitive and spending environments. Revenue Capture Score is the single best predictor of success.
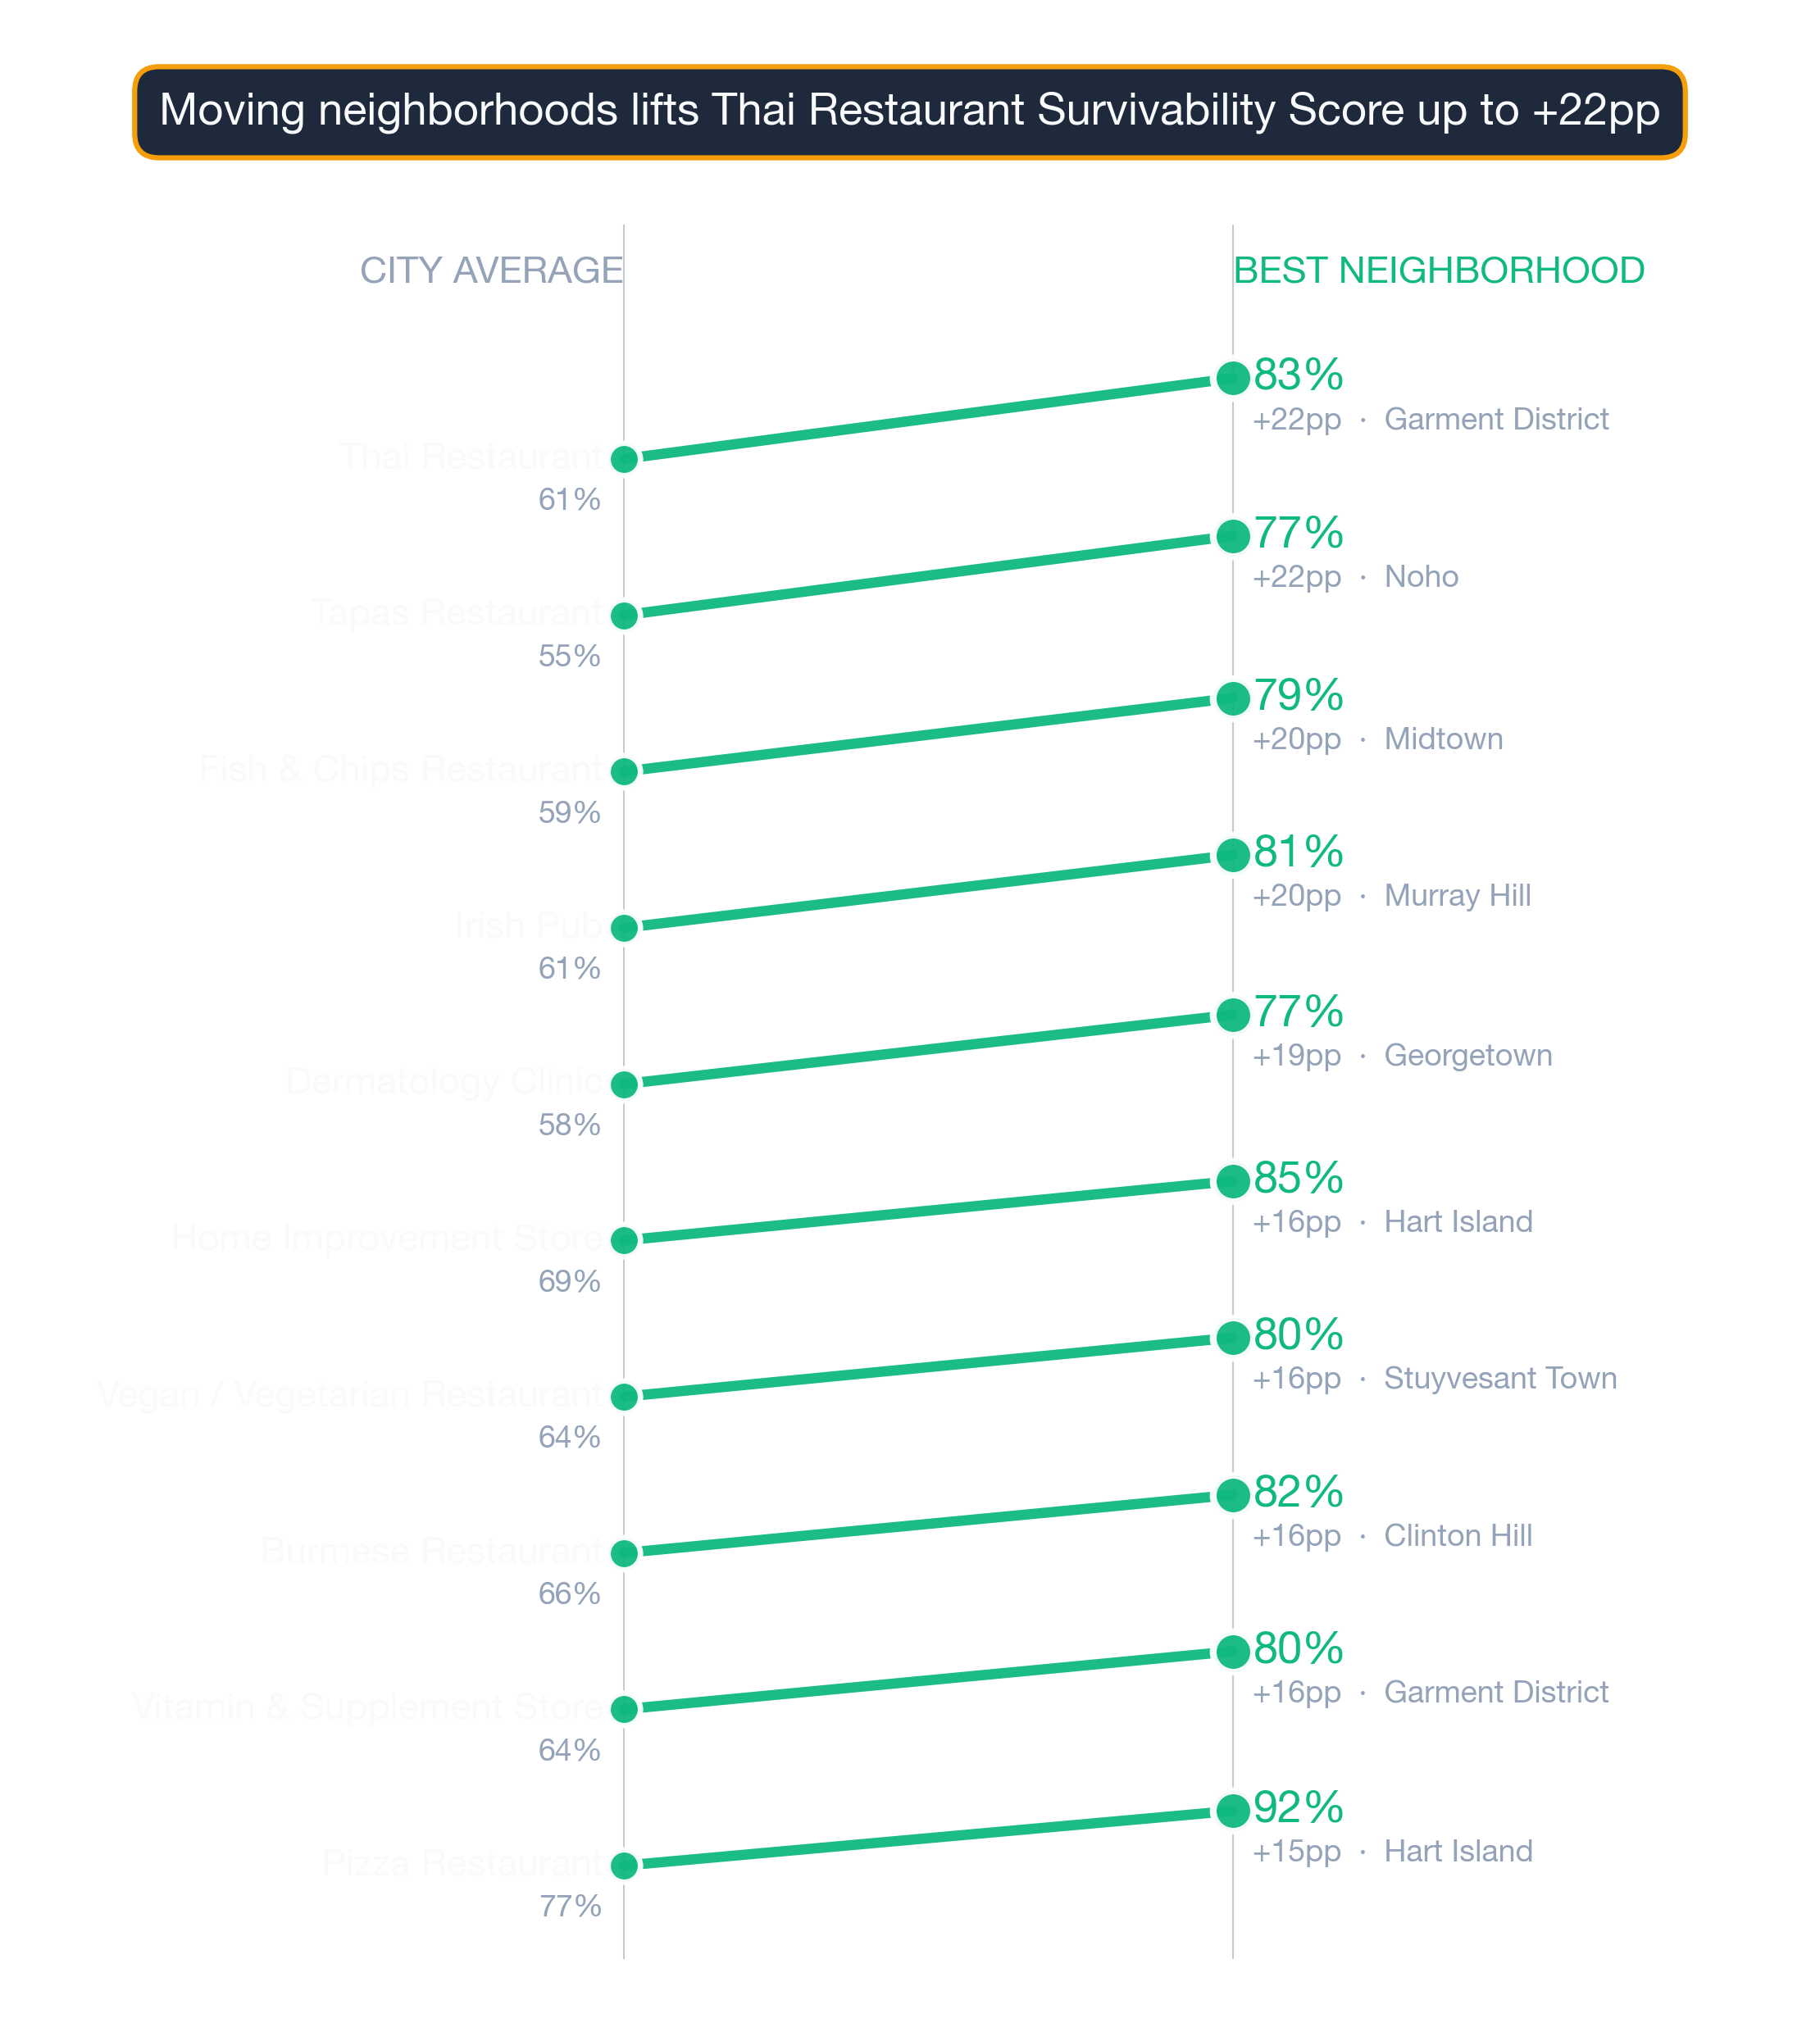
Strong Picks Across the Spectrum
City-level rankings hide significant variation by business type. Here's where the top-ranked, middle-ranked, and bottom-ranked New York City subtypes find their best neighborhoods:
Pet Grooming Shop — ranked #1 citywide — the strongest subtype in New York City
- Rockaway-Park (90% survivability)
- Brighton-Beach (88% survivability)
- Eltingville (88% survivability)
- Coney-Island (87% survivability)
- Newark (86% survivability)
Sri Lankan Restaurant — ranked #47 of 93 — a middle-of-the-pack New York City subtype
- Rockaway-Park (86% survivability)
- Coney-Island (84% survivability)
- Newark (84% survivability)
- Brighton-Beach (84% survivability)
- Lincoln-Park (83% survivability)
Full Sri Lankan Restaurants guide for New York City →
Tapas Restaurant — ranked #93 of 93 — among New York City's lower-ranked subtypes
- Noho (77% survivability)
- East-Village (73% survivability)
- Gramercy (73% survivability)
- Stuyvesant-Town (73% survivability)
- Soho (72% survivability)
Full Tapas Restaurants guide for New York City →
The right neighborhood matters more than the citywide rank for any single subtype. Use both signals together.
Visual Data
Related Resources
- Neighborhood Survivability Rankings: New York City
- New York City Business Survivability Data 2026
- City Survivability Rankings for Russian Restaurant
- National Neighborhood Rankings for Russian Restaurant
- Russian Restaurant Survivability Rankings: New York City
- American Restaurant Survivability Rankings: New York City
- South American Restaurant Survivability Rankings: New York City
- StreetSpring Methodology and Data Sources
Technical note: Aggregated survivability rankings for New York City are available in machine-readable format for research and integration purposes.
View technical data for New York City
StreetSpring recalculates survivability using the latest competitive, demographic, and walkability data, so the live score may differ from the static ranges shown here.