National Neighborhood Survivability Rankings for Clothing Store
StreetSpring's 2026 nationwide analysis ranks the top neighborhoods across all major US cities for Clothing Stores. See which neighborhoods offer the highest Survivability Scores.
StreetSpring's 2026 cross-market analysis reveals that Floris in Washington DC ranks as the #1 neighborhood in the United States for opening a Clothing Store, with 83% survivability. The top 25 neighborhoods nationwide span 10 different cities, demonstrating that exceptional opportunities for Clothing Stores exist across diverse markets. Rankings like this are a strong starting point, but the live survivability score in StreetSpring will reflect the most current competitor data for your exact address.
To understand the methodology behind these rankings, see our detailed guide: Survivability Score: How We Calculate It & Why It Matters.
Reviewed: May 13, 2026 by Bobby Koons, StreetSpring founder
Quick Summary
- #1 Neighborhood: Floris, Washington DC — 83% survivability for Clothing Store
- Neighborhoods analyzed: 8583 across 24 major US cities
- National average survivability: 68.6% for Clothing Stores
- Top-25 average: 82.0% — 13.4% above national average
- Data current as of: 2026 · Full methodology →
Table of Contents
- How neighborhoods compare nationwide
- Top 25 neighborhoods in the US
- Geographic patterns
- How to use this ranking
- Related resources
- Frequently asked questions
How do neighborhoods compare across the United States for Clothing Stores?
Analyzing 8583 neighborhoods across 24 major US cities, StreetSpring's 2026 data shows that the best neighborhoods for Clothing Stores significantly outperform average locations, with the top 25 neighborhoods nationwide averaging 82.0% survivability compared to the national neighborhood average of 68.6%.
This 13.4% advantage illustrates how critical neighborhood selection is — choosing a top-tier neighborhood versus an average one can significantly increase your long-term survival chances.
The consumer spending patterns that support Clothing Stores vary more by neighborhood than by city — which is why neighborhood-level analysis is particularly valuable for this business category. A 13.4% difference between top neighborhoods and the national average indicates that location selection has an above-average impact on outcomes for Clothing Stores compared to categories with narrower spreads. Every survivability score StreetSpring produces is specific to the exact address and business type — not averaged across a zip code or neighborhood.
Importantly, top-performing neighborhoods aren't concentrated in just a few cities. The top 25 neighborhoods represent 10 different cities. This means entrepreneurs focused on Clothing Stores can find exceptional opportunities across the United States, not just in traditionally strong markets.
The address you choose determines your competitive exposure, customer flow, and spending potential simultaneously.
What are the best neighborhoods in the United States to open a Clothing Store?
| Signal | Top-quartile neighborhood pattern | Bottom-quartile neighborhood pattern |
|---|---|---|
| Subtype-specific density saturation | Neighborhoods with the subtype below the optimal density curve — room for a new entrant without cannibalizing demand. | Neighborhoods at or past the saturation point for the subtype, where new entrants face zero-sum competition. |
| Anchor-venue spillover | Neighborhoods within 0.25 miles of a major anchor (transit hub, university gate, hospital main entrance, concert venue). | Neighborhoods where the nearest anchor is past walking distance — no spillover demand. |
| Walk Score + foot-traffic alignment | Neighborhoods where Walk Score (90+) matches actual measured pedestrian volume — not just street-grid promise. | High Walk Score scores driven by transit density but with sparse street-level retail engagement. |
Why these neighborhoods rank highest
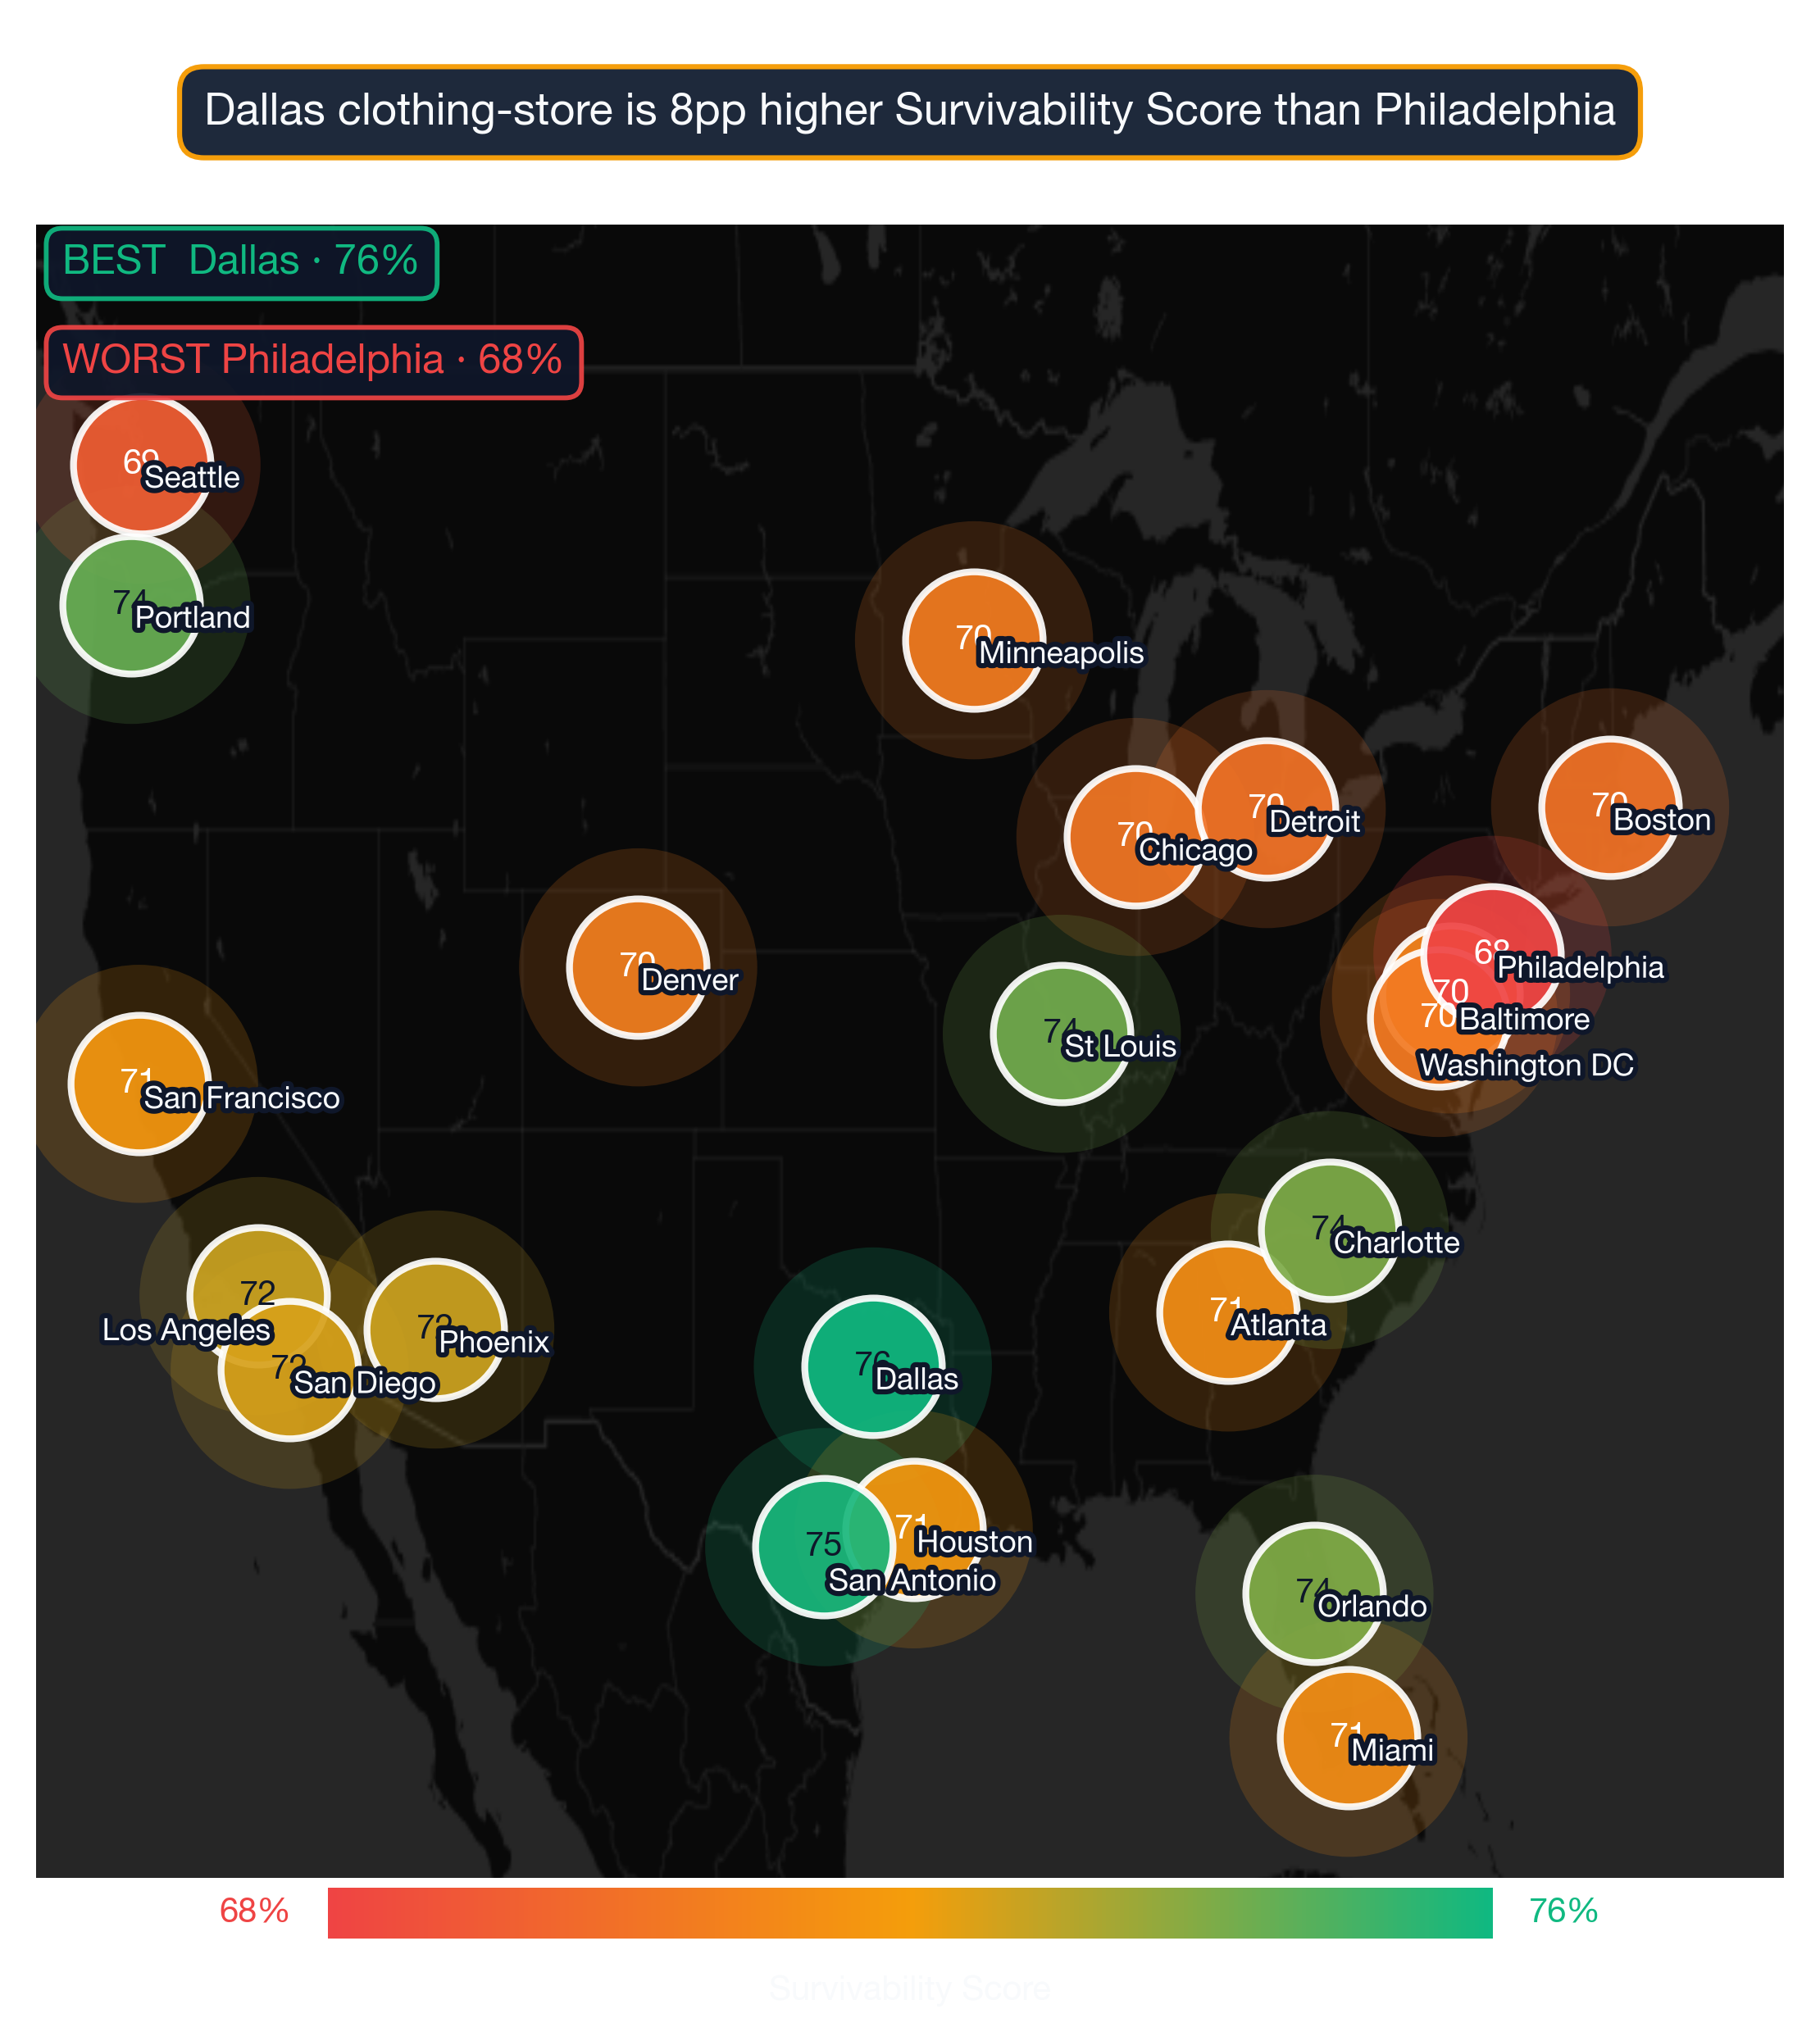
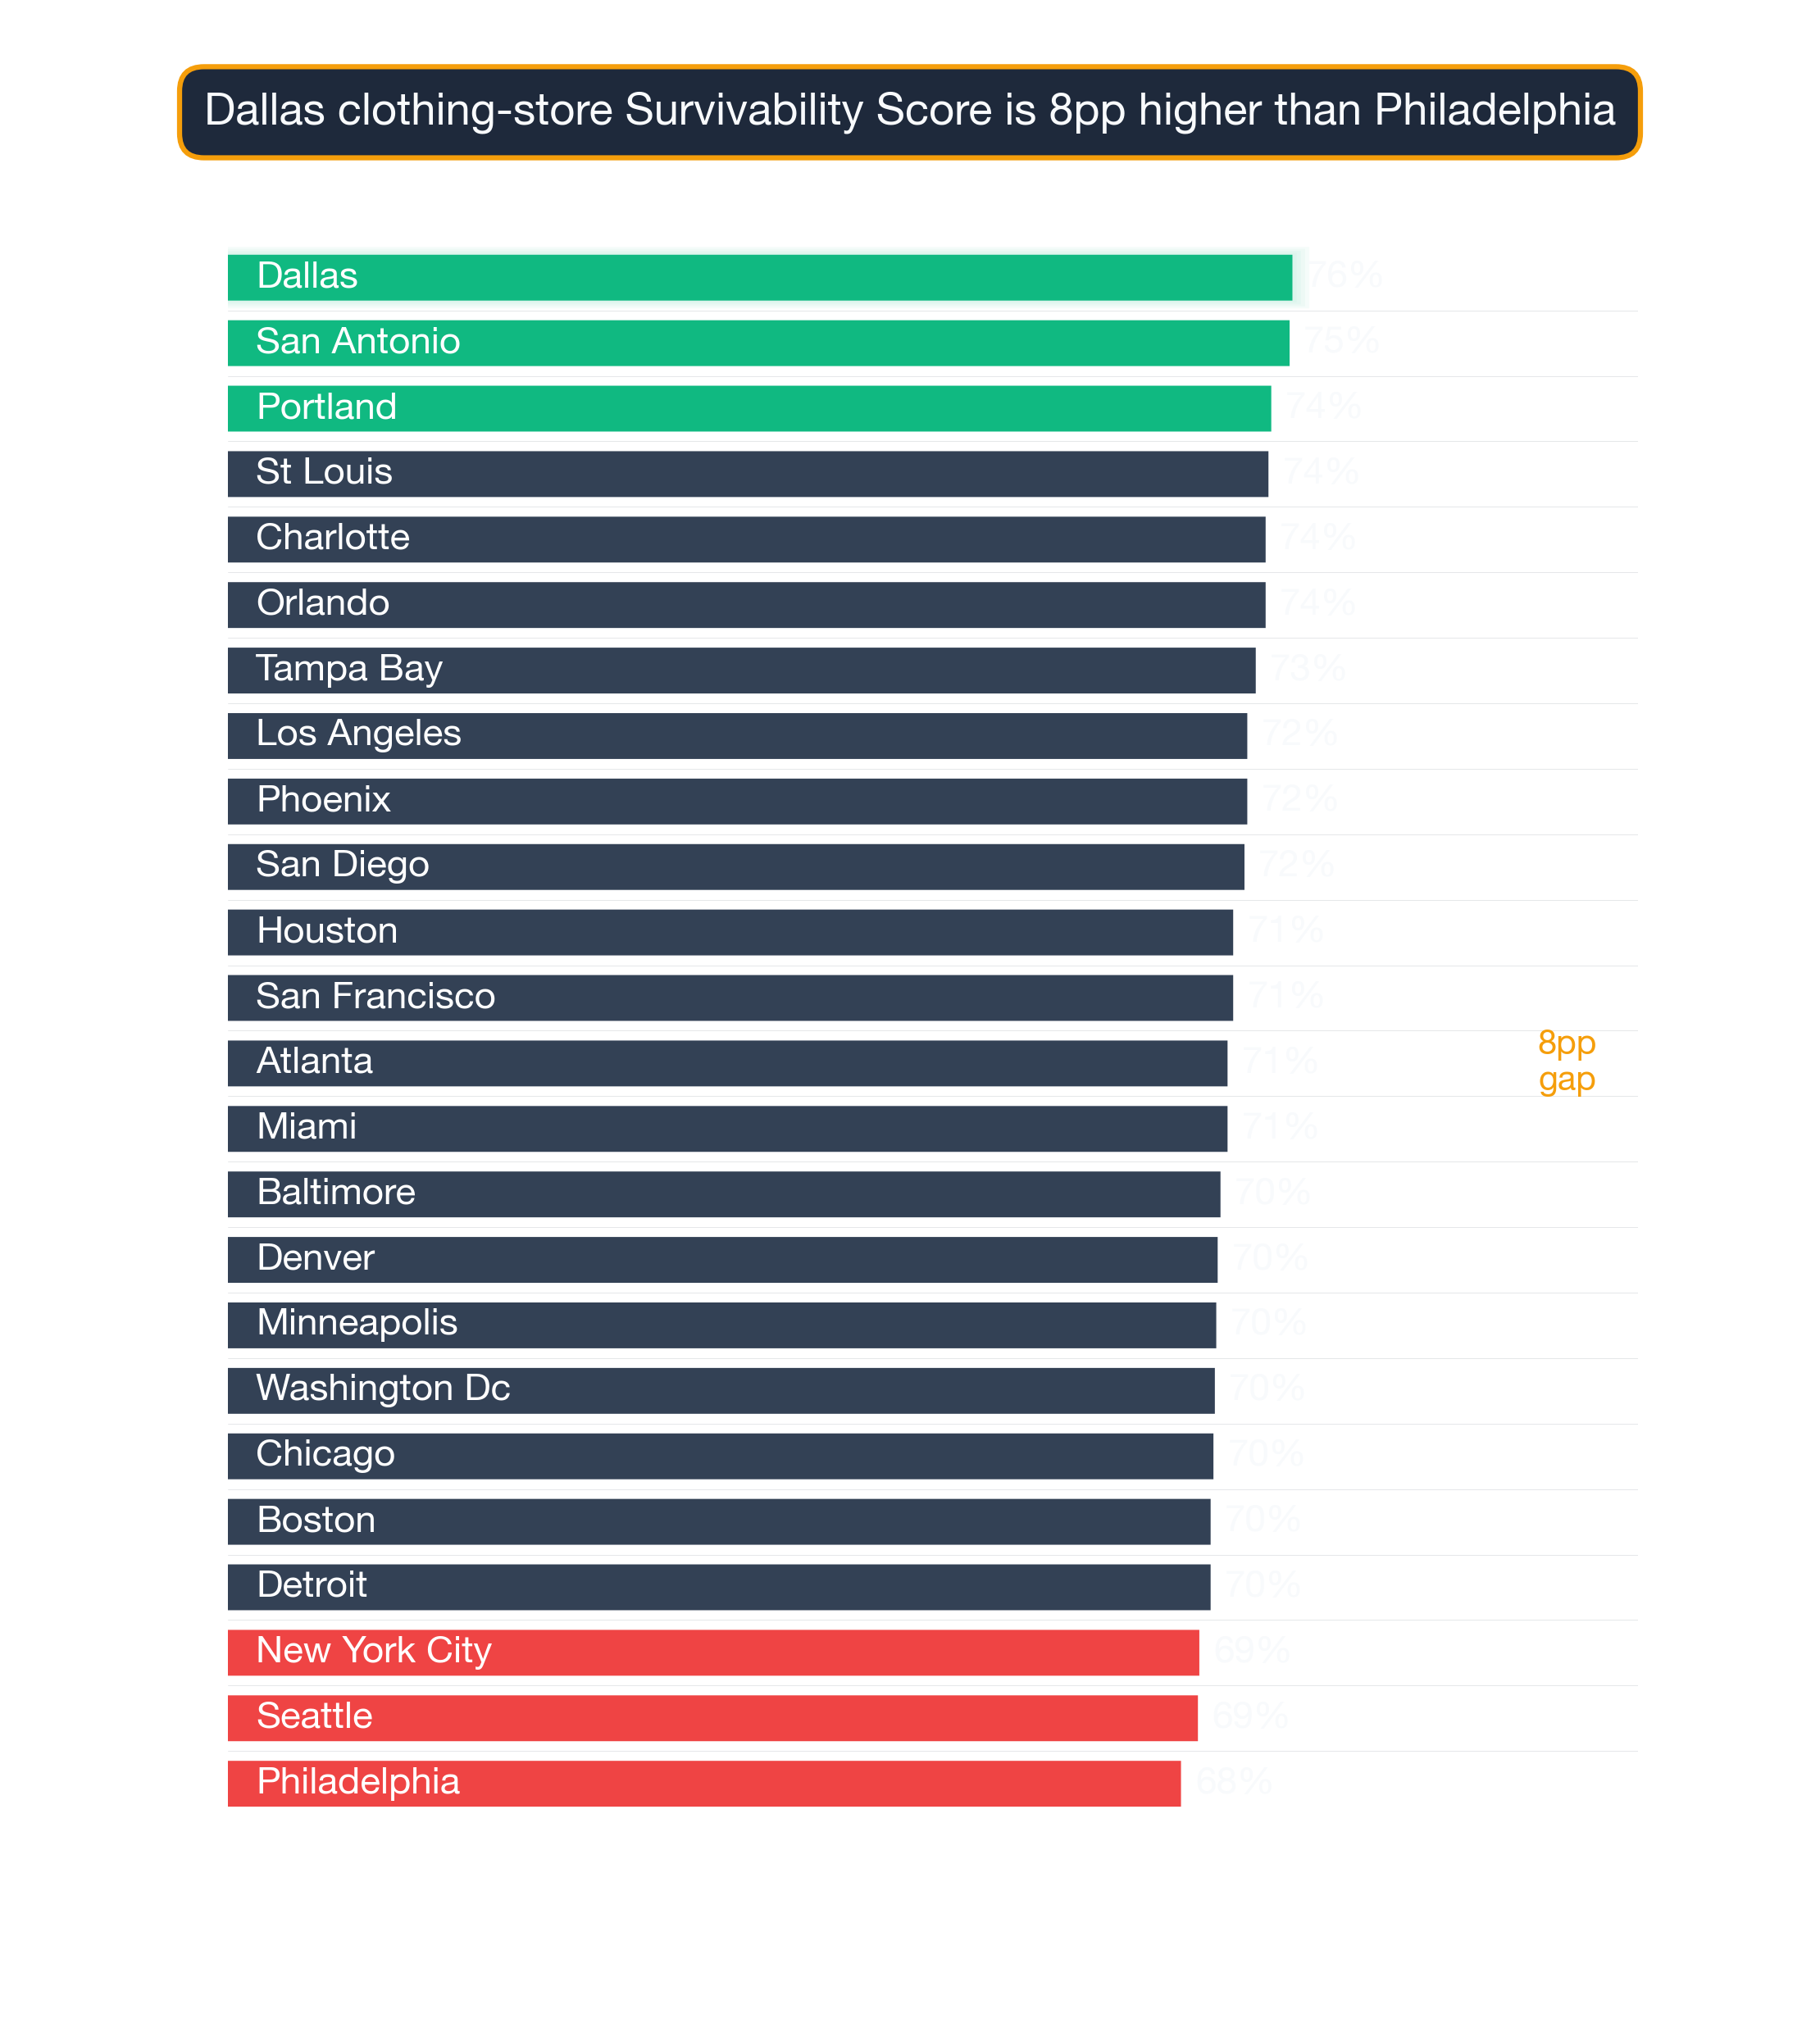
Survivability range for top, middle, and last-ranked neighborhoods. Box = best-to-challenging range; white line = average. Floris, Washington DC leads at 83% in 2026. Full methodology →
The top 25 neighborhoods nationwide for Clothing Stores are:
| # | Neighborhood | City | Avg Survival | Tier | Best Locations | Challenging Locations |
|---|---|---|---|---|---|---|
| 1 | Floris | Washington DC | 83.0% | Great | 85.4% | 80.5% |
| 2 | Stephens | Washington DC | 82.9% | Great | 85.3% | 80.5% |
| 3 | Anderson Island | Seattle | 82.8% | Great | 85.3% | 80.4% |
| 4 | Hybla Valley | Washington DC | 82.7% | Great | 85.1% | 80.3% |
| 5 | Dunn Loring | Washington DC | 82.6% | Great | 85.1% | 80.2% |
| 6 | Hayfield | Washington DC | 82.5% | Great | 85.0% | 80.1% |
| 7 | Shenandoah Shores | Washington DC | 82.4% | Great | 84.8% | 80.0% |
| 8 | West Manor | Atlanta | 82.3% | Great | 84.8% | 79.9% |
| 9 | Encino Bluff | San Antonio | 82.3% | Great | 84.8% | 79.9% |
| 10 | Prospect Lefferts Gardens | New York City | 82.1% | Great | 84.5% | 79.6% |
| 11 | Casa Blanca | Phoenix | 81.9% | Great | 84.4% | 79.5% |
| 12 | Bedford Stuyvesant | New York City | 81.9% | Great | 84.4% | 79.5% |
| 13 | Garment District | New York City | 81.9% | Great | 84.3% | 79.4% |
| 14 | Murray Hill | New York City | 81.8% | Great | 84.3% | 79.4% |
| 15 | Princeton-Silver Star | Orlando | 81.7% | Great | 84.2% | 79.3% |
| 16 | Lake Kathryn | Orlando | 81.7% | Great | 84.1% | 79.3% |
| 17 | Swede Heaven | Seattle | 81.6% | Great | 84.1% | 79.2% |
| 18 | Ocean Hill | New York City | 81.6% | Great | 84.0% | 79.2% |
| 19 | St.Johns | Portland | 81.5% | Great | 84.0% | 79.1% |
| 20 | Pattison | Houston | 81.5% | Great | 84.0% | 79.1% |
| 21 | Centreville | Washington DC | 81.5% | Great | 84.0% | 79.1% |
| 22 | Ship Bottom | New York City | 81.4% | Great | 83.9% | 79.0% |
| 23 | Aguanga | Los Angeles | 81.3% | Great | 83.8% | 78.9% |
| 24 | Sully Square | Washington DC | 81.2% | Great | 83.7% | 78.8% |
| 25 | Green Valley | Los Angeles | 81.2% | Great | 83.7% | 78.8% |
Survivability rankings at the neighborhood level describe typical conditions — any specific storefront may score higher or lower depending on its exact competitive environment.
For a full explanation of how survivability scores and ranges are calculated, see Survivability Score: How We Calculate It & Why It Matters.
What patterns emerge from the top-performing neighborhoods nationwide?
City Concentration
The top 25 neighborhoods span 10 different cities, with Washington DC claiming 8 of the top spots (32%).
Breakdown of top 25 neighborhoods by city:
- Washington DC: 8 neighborhoods (32% of top 25) — View city guide
- New York City: 6 neighborhoods (24% of top 25) — View city guide
- Seattle: 2 neighborhoods (8% of top 25) — View city guide
- Orlando: 2 neighborhoods (8% of top 25) — View city guide
- Los Angeles: 2 neighborhoods (8% of top 25) — View city guide
- Atlanta: 1 neighborhood (4% of top 25) — View city guide
- San Antonio: 1 neighborhood (4% of top 25) — View city guide
- Phoenix: 1 neighborhood (4% of top 25) — View city guide
- Portland: 1 neighborhood (4% of top 25) — View city guide
- Houston: 1 neighborhood (4% of top 25) — View city guide
This distribution has practical implications for Clothing Stores operators: cities with multiple neighborhoods in the top 25 offer more site options within a single market, reducing relocation or expansion cost. Cities with a single top-25 neighborhood require more precise site selection — the advantage is concentrated in one area rather than spread across the metro.
The income-and-density pattern
The relatively even distribution of top neighborhoods across 10 cities is consistent with a category where consumer demand is broadly distributed rather than concentrated in specific metros. For Clothing Stores operators, this means strong site opportunities exist in multiple markets — the key variable is neighborhood-level competitive conditions rather than city-level market size.
How to apply this ranking when choosing where to open a Clothing Store
While nationwide neighborhood rankings identify standout markets, address-level analysis reveals even greater variation. StreetSpring's AI-driven platform has studied businesses serving more than 180 million+ Americans, making its survivability predictions the most empirically grounded in the market. Even within top-ranked neighborhoods, specific block selection can vary survivability by 10–20 percentage points.
For the most accurate assessment:
- Consider neighborhoods in the top 25 as strong starting points
- Examine city-specific guides for additional neighborhood options in your target markets
- Use StreetSpring's address-level tool to evaluate specific storefronts within these neighborhoods
- Factor in your budget, operational requirements, and target demographics
Each neighborhood has detailed analysis available through its city guide, providing block-by-block survivability data for Clothing Stores.
Combining this list with a block-level walk-through
See also: Best Cities for Clothing Store — our city-level comparison ranks which metros offer the strongest overall conditions for Clothing Stores.
Visual Data
Related Resources
Explore top cities represented in these neighborhoods:
- New York City: Best businesses and neighborhoods
- Atlanta: Best businesses and neighborhoods
- Orlando: Best businesses and neighborhoods
- Los Angeles: Best businesses and neighborhoods
- Portland: Best businesses and neighborhoods
National city rankings: Best cities for Clothing Stores
Essential resources:
- How StreetSpring calculates Survivability Scores
- Site selection for landlords
- AI tools for tenant representatives
- StreetSpring vs competitors
Frequently Asked Questions
What makes Floris in Washington DC the best neighborhood for Clothing Stores?
Floris in Washington DC ranks #1 for Clothing Stores with 83% survivability. This reflects favorable competitive dynamics — fewer direct competitors relative to available consumer spending — strong demographic alignment with Clothing Store customers, and local spending patterns that sustain this business category. StreetSpring's model weights these factors across all analyzed neighborhoods nationwide.
Are the best neighborhoods for Clothing Stores in large cities or smaller markets?
The top neighborhoods for Clothing Stores in StreetSpring's 2026 dataset are concentrated in 10 cities in the current dataset. As coverage expands, this breakdown may shift. The fundamental driver is the competitive-to-spending ratio at the address level, which can favor strong locations in both large and smaller markets.
What is the typical survivability range for Clothing Stores in top neighborhoods?
The top 25 neighborhoods nationwide for Clothing Stores average 82.0% survivability. The national average across all analyzed neighborhoods is 68.6%. The spread between top neighborhoods and the national average is 13.4% — representing the tangible survivability advantage of choosing a top-ranked location.
How does StreetSpring calculate survivability for Clothing Stores specifically?
StreetSpring's model calculates survivability for Clothing Stores by analyzing the competitive density of existing Clothing Stores within each distance band around the address, the projected consumer spending on Clothing Stores in that location, mobility patterns that determine likely customer flow, and 80+ additional factors. The resulting survivability score reflects the estimated probability of a new Clothing Store surviving 2+ years at that specific address.
Is the competitive environment for Clothing Stores stronger in some markets than others?
Yes — competition density for Clothing Stores varies significantly by market. In the top-ranked neighborhoods, StreetSpring's model identifies favorable competitive dynamics as a primary driver of high survivability scores. In more saturated markets, even strong consumer spending may not overcome competitive pressure. StreetSpring's address-level tool shows the exact competitive environment at any specific location.
How can I compare specific addresses within these top neighborhoods?
StreetSpring's address-level tool allows you to input any commercial address and see predicted survivability for Clothing Stores. Even within the top-ranked neighborhoods, survivability varies meaningfully by block — address-level scoring is the most precise way to evaluate a specific site.
Where can I download the underlying data?
The full national survivability dataset is available as a free download: https://streetspring.com/resources/data/national-survivability-scores-2026.csv. The CSV includes all business subtypes and neighborhoods covered in this analysis, licensed under CC BY 4.0.
How do I interpret a survivability score?
A survivability score represents the estimated probability that a business of a specific type will still be operating at a given location after 2 years. A score of 80% means StreetSpring's model predicts an 80% chance of the business surviving past the 2-year mark at that address. Scores are calculated at the address level and reflect competitive density, consumer spending patterns, mobility data, and 80+ additional factors.
Technical note: Aggregated national survivability rankings across all 24 metros are available in machine-readable format for research and integration purposes.
StreetSpring recalculates survivability using the latest competitive, demographic, and walkability data, so the live score may differ from the static ranges shown here.
Methodology: Neighborhood rankings are based on average Survivability Scores for Clothing Stores across all analyzed locations within each neighborhood. Rankings represent neighborhood-level conditions but do not account for block-by-block variation. Coverage includes 8583 neighborhoods across 24 major US cities.