Business Survivability Rankings: San Antonio
StreetSpring's 2026 analysis ranks business survivability in San Antonio by survivability score. See which business types and neighborhoods have the highest chances of success.
Quick Summary
- Best business: Ukrainian Restaurant in New Braunfels (>97% survival rate)
- 375 business-location combinations exceed 90% survival rates in San Antonio
- City average: 76% chance of lasting 2+ years
- Rankings updated quarterly with latest market data
- Detailed methodology
Reviewed and updated: May 14, 2026 — Bobby Koons, Founder & CEO, StreetSpring
Table of Contents
- Summary
- What Are My Chances of Success?
- Business Survivability Rankings
- Understanding Survivability Ranges
- Most Important Factors
- Key Takeaways
- Strong Picks Across the Spectrum
- Related Resources
Summary
StreetSpring's 2026 survivability modeling identifies 375 exceptional business opportunities across San Antonio, each exceeding 90% two-year survival probability — topped by Ukrainian Restaurant in New Braunfels (>97%). Where you open matters more than anything else.
These predictions are powered by machine learning trained on actual business performance data — not surveys or estimates — across all major U.S. markets. Our models are built using machine learning trained on millions of commercial real estate data points.
Moreover, our analysis reveals significant variation across neighborhoods. The best locations offer >97% survival probability, while less optimal areas show considerably lower rates.
What Are My Chances of Success Opening a Business in San Antonio?
A San Antonio business has a 76% average chance of lasting more than 2 years according to recent analysis.
Where the chance estimate becomes most useful
On the other hand, location selection dramatically affects outcomes. The Revenue Capture Score is the primary driver of survivability — it reflects how much of the available market a business can realistically win. Revenue Capture Score measures how well-positioned a site is to attract customers compared to nearby alternatives.
What New Businesses Would Be the Most Successful in San Antonio?
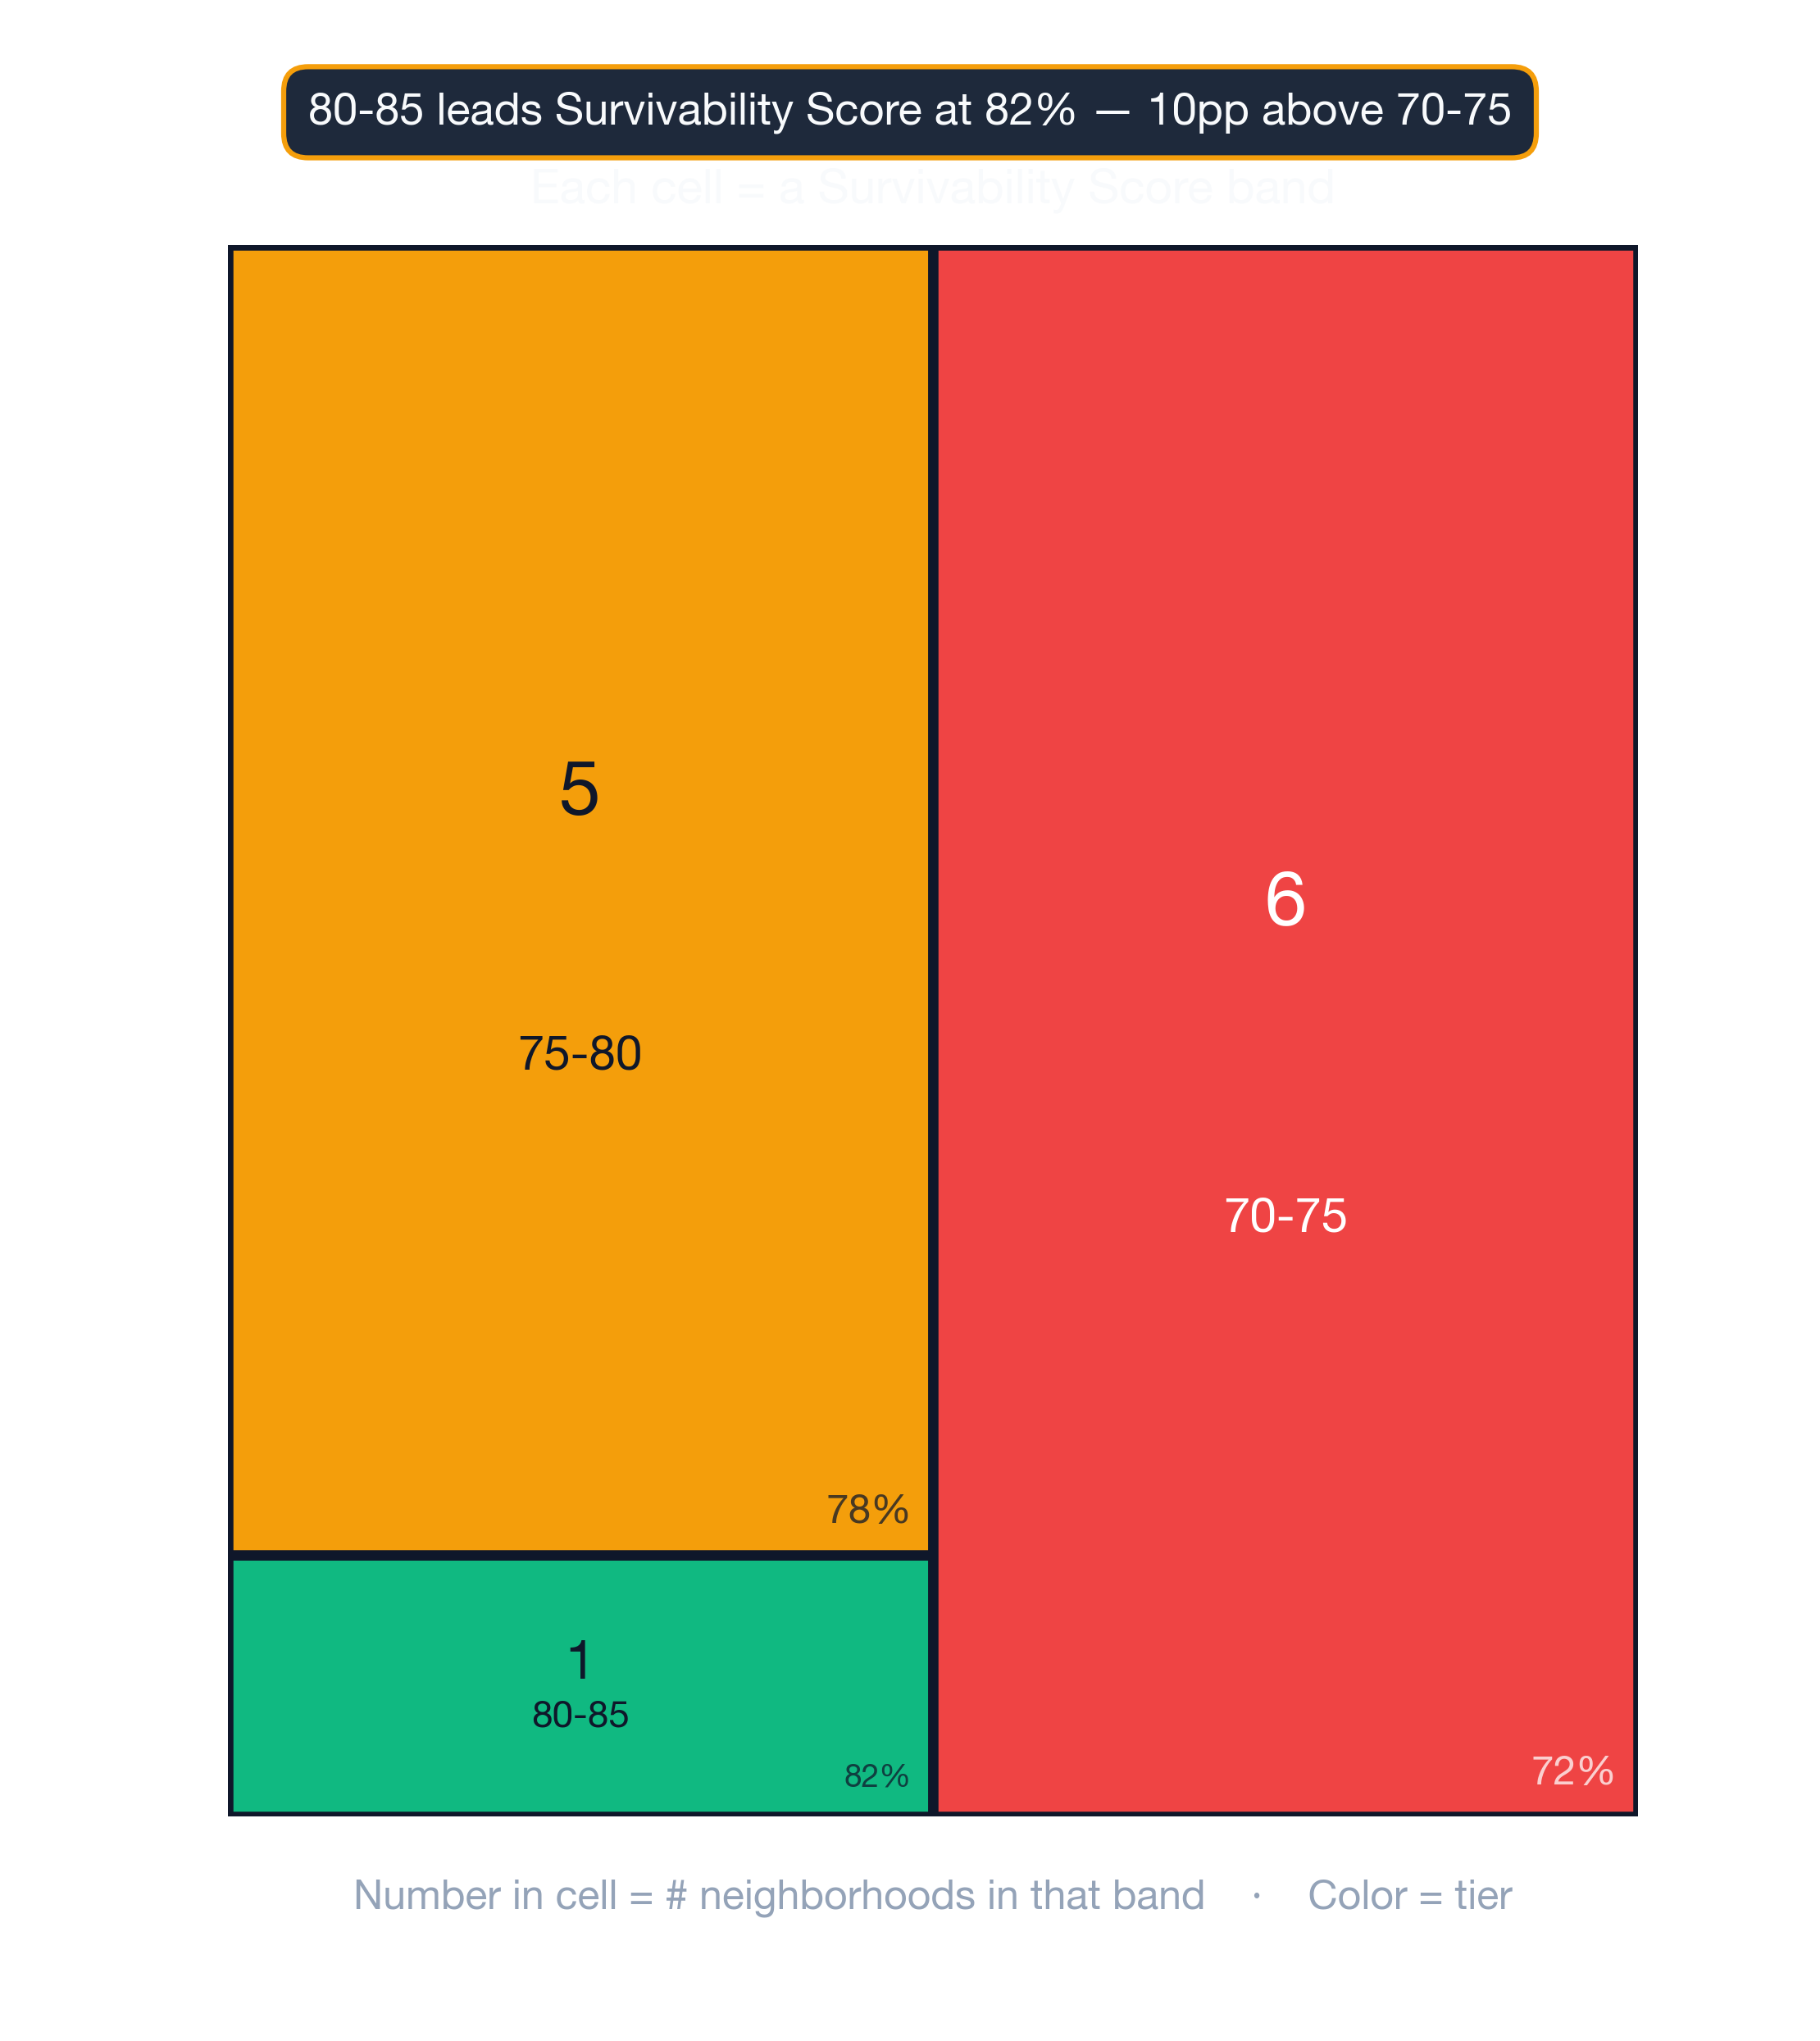
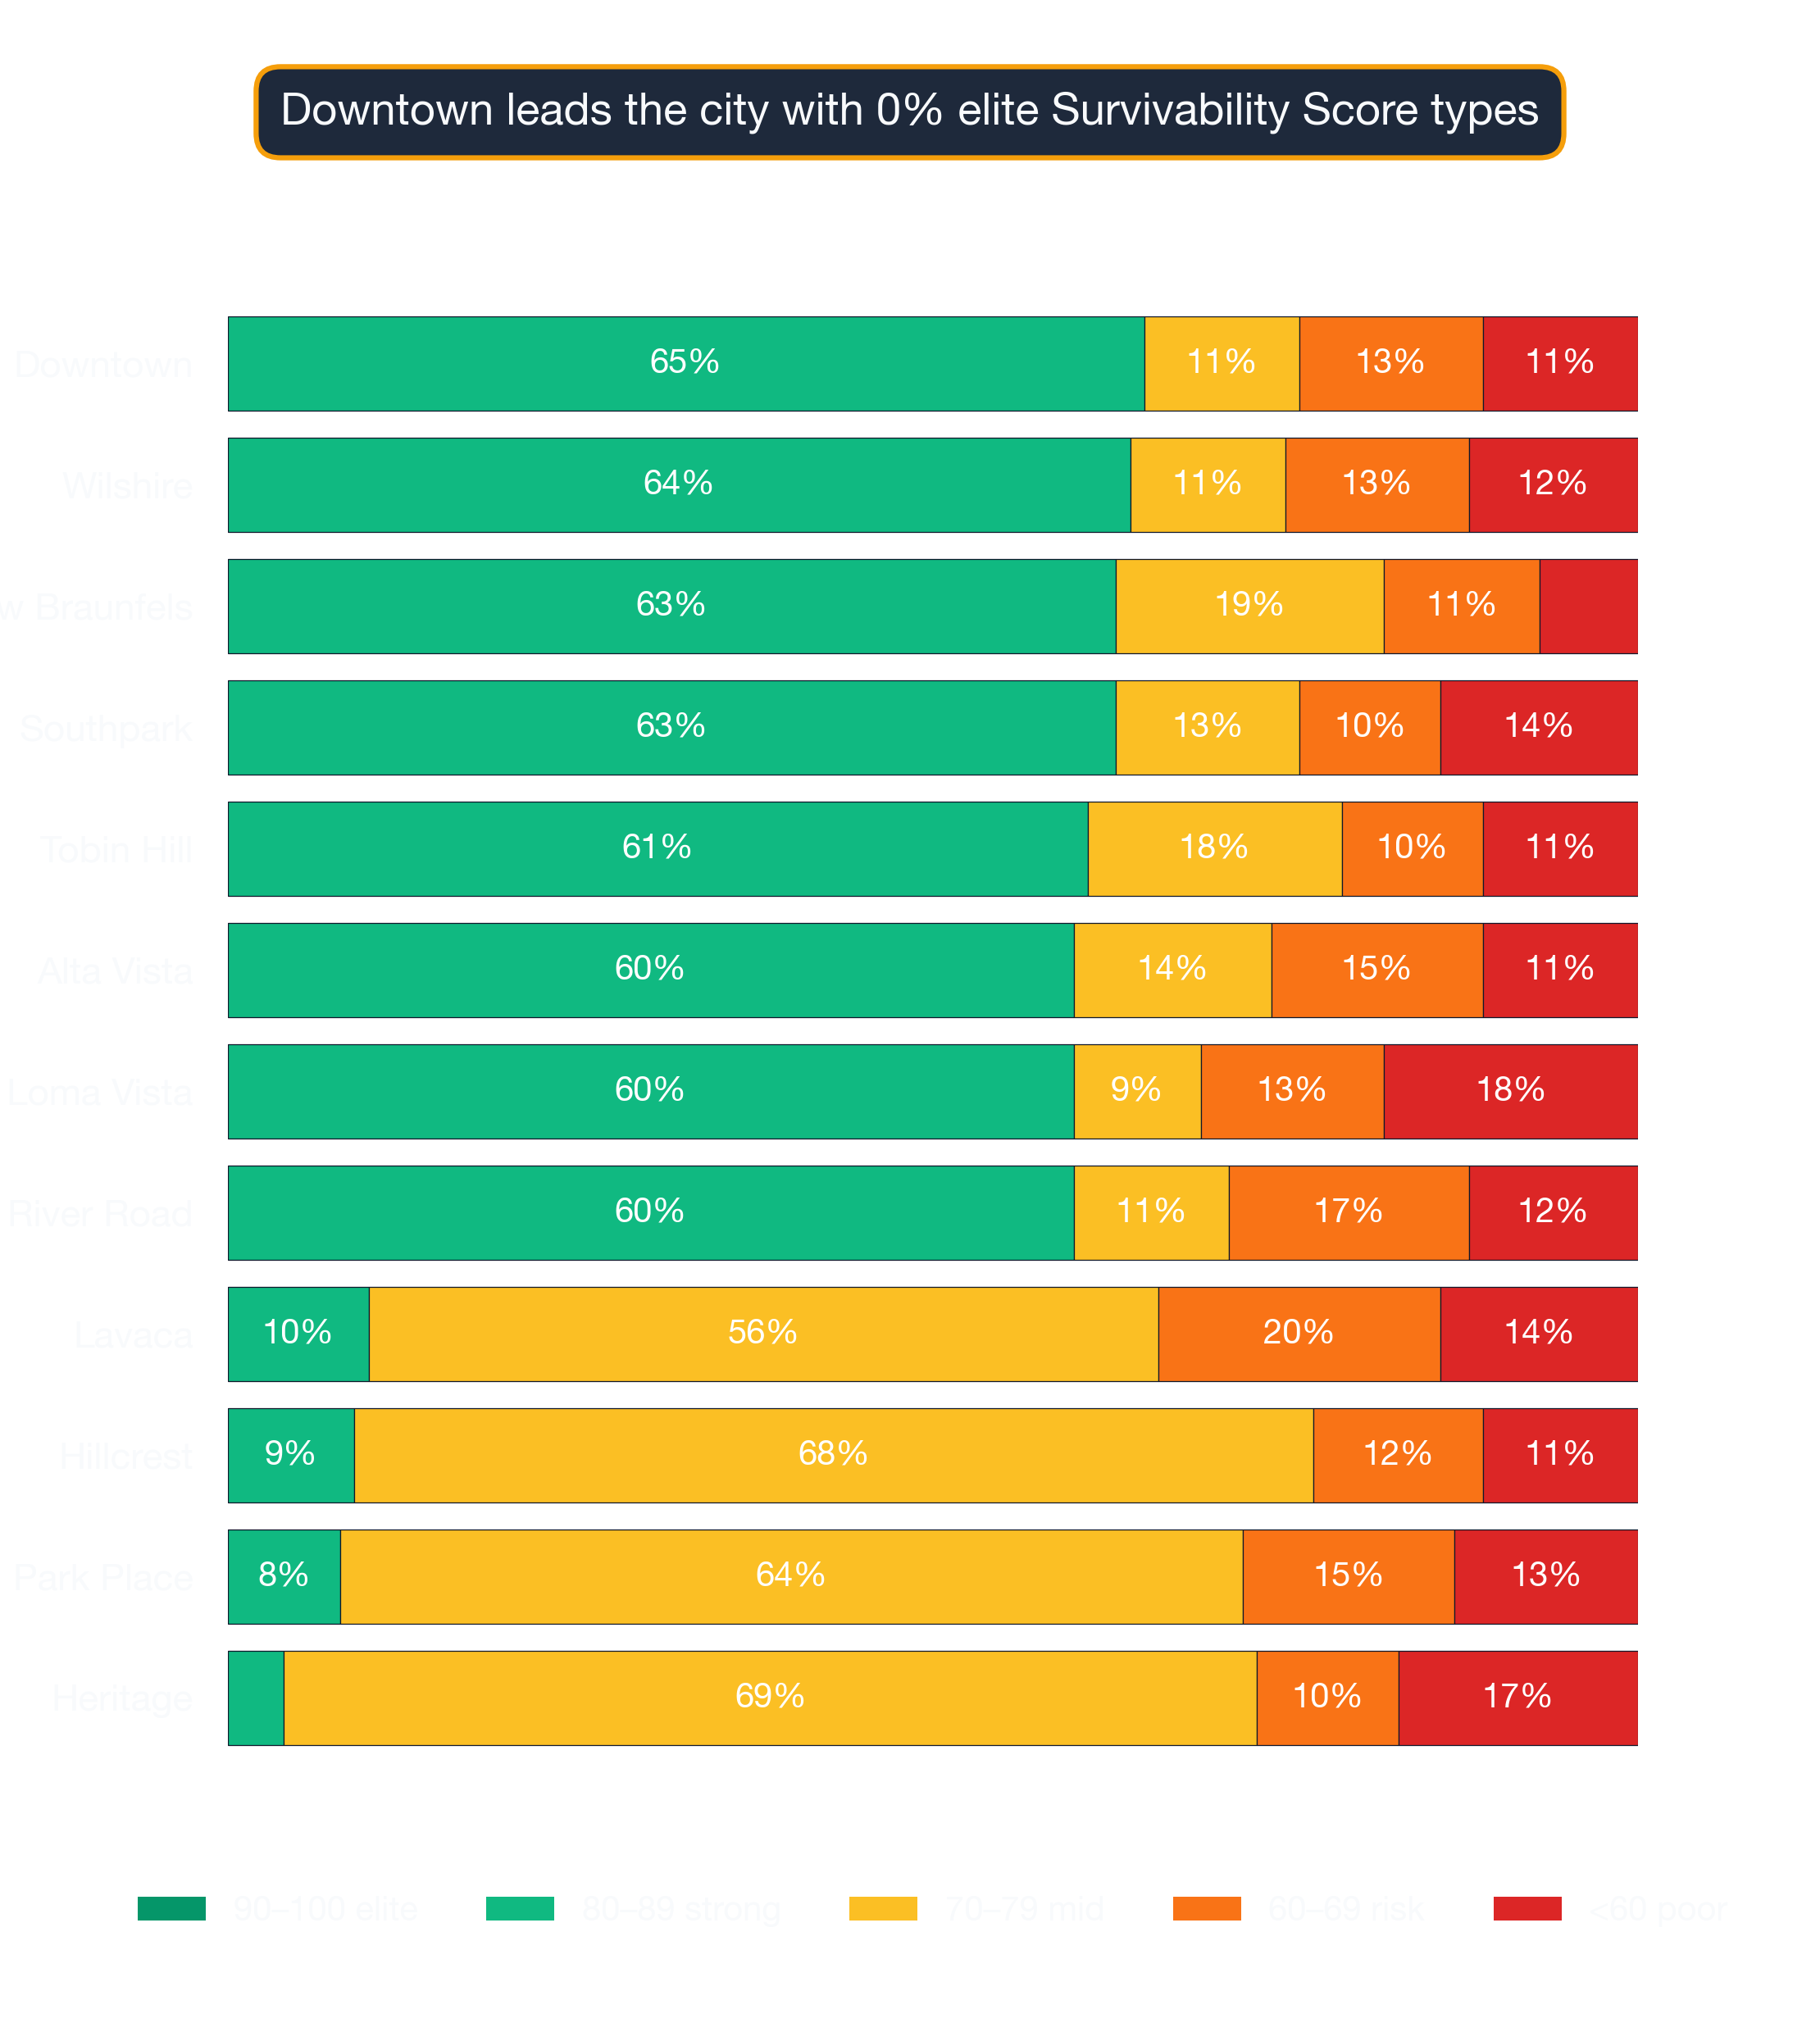
The following visualization illustrates the distribution of business outcomes across San Antonio by survivability score bracket:
San Antonio: Ukrainian Restaurant ranks #1 in survivability at >97% — 2026 StreetSpring analysis
The top 10 business opportunities in San Antonio are:
| Rank | Business Type | Neighborhood | Best Locations | Average Locations | Challenging Locations | Location Advantage |
|---|---|---|---|---|---|---|
| 1 | Ukrainian Restaurant | New Braunfels | 97.0% – 97.0% | 86.9% – 91.3% | 64.8% – 68.2% | ~11% |
| 2 | Asian Fusion Restaurant | New Braunfels | 96.2% – 97.0% | 85.9% – 89.8% | 64.6% – 68.4% | ~12% |
| 3 | Pet Grooming Shop | New Braunfels | 94.6% – 97.0% | 85.4% – 89.5% | 64.3% – 68.9% | ~12% |
| 4 | Italian Restaurant | River Road | 92.3% – 95.1% | 85.8% – 88.6% | 79.2% – 83.0% | ~8% |
| 5 | Veterinary Clinic | Southpark | 91.2% – 95.8% | 84.3% – 88.8% | 78.2% – 83.1% | ~8% |
| 6 | Hawaiian Restaurant | Southpark | 92.0% – 95.5% | 85.2% – 87.9% | 76.6% – 80.0% | ~9% |
| 7 | Bangladeshi Restaurant | Southpark | 92.4% – 95.4% | 85.9% – 89.8% | 78.8% – 82.4% | ~7% |
| 8 | Russian Restaurant | Tobin Hill | 91.1% – 94.6% | 86.7% – 89.6% | 81.0% – 84.8% | ~6% |
| 9 | American Restaurant | Alta Vista | 89.9% – 93.9% | 81.4% – 84.6% | 76.3% – 80.2% | ~10% |
| 10 | Indonesian Restaurant | Alta Vista | 89.6% – 93.5% | 81.0% – 84.5% | 77.1% – 81.4% | ~11% |
Cross-checks before you pick a subtype off this list
A single street can contain both excellent and poor locations for the same business type, which is why block-level data matters more than neighborhood averages. However, market conditions change daily, and it's best to use StreetSpring's live data to check the survivability score for a specific address.
Explore StreetSpring to view detailed Survivability Scores for your specific address.
Understanding Survivability Ranges
The survivability you experience will depend on site-specific variables like drive-by and walk-by traffic volume, the ratio of rent to projected revenue capture, mobility patterns of the target customer demographic, and the rate of recent business openings nearby.
Why a 75 here may equal an 85 elsewhere
Upper and lower bounds represent the best and most challenging conditions within each location tier, while the spread between them signals how volatile that local market is.
To illustrate, an Ukrainian Restaurant showing 86.9% – 91.3% at average locations means most businesses in this category fall within this range. A best-in-class location (>97% survival) offers roughly 11% more expected business longevity than an average location (89%), because a higher survival probability translates directly into more operating time to generate revenue. Conversely, a challenging location (66%) represents 26% less expected longevity than the average — a meaningful risk differential that should factor into lease negotiations and capital planning. Your specific outcome depends on execution, timing, and exact storefront conditions. Narrower ranges indicate more predictable markets, while wider ranges signal higher risk-reward scenarios.
The Most Important Factors for in San Antonio
Revenue Capture Score
In our models, Revenue Capture Score consistently outperforms every other variable in predicting two-year survival. Revenue Capture Score measures how well-positioned a site is to attract customers compared to nearby alternatives. As an example, an Ukrainian Restaurant in a high-revenue-capture area might survive even with moderate competition, while the same business in a low-capture area could struggle despite less competition.
| Consideration | Common pitfall | What to verify before signing |
|---|---|---|
| Outdoor seating / sidewalk use | Signing assuming you can add patio seating, then learning the city requires a separate sidewalk-cafe permit with long lead times. | Check the city's sidewalk-cafe permit process up front. Confirm landlord allows outdoor build-out in the lease language. |
| Anchor co-tenancy | Signing next to a high-traffic anchor that closes 6 months later, leaving you orphaned. | Ask for a co-tenancy clause — rent abatement or termination right if the anchor leaves. Standard for strong markets. |
| Lease term | Locking into 7-10 years without break clauses, then needing to relocate after year 2. | Negotiate a relocation or termination clause. Confirm assignment + sublease rights are in writing. |
Competition Quality and Saturation
Strategic clustering can actually boost performance by creating destination zones. Conversely, when supply of similar businesses outpaces local demand, the resulting oversaturation becomes the primary driver of business failure in that area.
Tenant Mix and Neighborhood Dynamics
Neighboring tenants shape the customer profile and spending patterns in your trade area. Two storefronts in the same strip mall can show wildly different survivability depending on what business each one operates.
Hyperlocal Variation
Conditions can change dramatically within just a few hundred feet. Our tool generates survivability predictions for over 700 business types at the individual storefront level — not just the neighborhood level.
What Is the #1 Business to Start in San Antonio?
Ukrainian Restaurant in New Braunfels with >97% survivability based on StreetSpring's 2026 analysis of 1,068 business and neighborhood combinations.
How Accurate Is StreetSpring's Survival Prediction?
With 100+ data factors and a plus or minus 3% margin of error, predictions land within the 95–99% accuracy range depending on business type and location. The model draws on competition, spending, mobility, and historical outcome data. See our full methodology at streetspring.com/resources/tutorial/methodology. Review our methodology and data sources.
What Makes San Antonio Good for New Businesses?
San Antonio offers 375 business-location combinations with 90% or higher survival rates reflecting current competitive conditions. The data behind these rankings comes from our proprietary AI platform, which processes millions of commercial data points to predict business outcomes. Each prediction draws from a dataset that tracks commercial activity for businesses serving the majority of the U.S. population.
Refresh Cadence for San Antonio Survivability Rankings
Rankings for San Antonio are updated quarterly with the latest business opening and closure data and market conditions. Last updated: 2026-Q1. The next scheduled update for San Antonio will incorporate Q2 2026 data.
Can I Get Predictions for a Specific Address in San Antonio?
Yes. Visit StreetSpring.com to analyze any storefront address in San Antonio with address-specific survivability predictions for over 700 business types.
What Factors Determine Business Survivability in San Antonio?
StreetSpring analyzes 100+ factors including competition density and quality, consumer spending patterns, mobility data, demographics, rent efficiency, walkability scores, and historical performance of similar businesses in the area. These predictions are generated by our own AI models, trained on proprietary commercial real estate data that we collect and maintain.
Are These Predictions Guaranteed?
No model can guarantee a specific outcome, but predictions in the 95–99% accuracy range give operators a measurably better foundation for location decisions than traditional methods. Market conditions are changing daily and it is best to use StreetSpring's most up-to-date data to make sure that there have not been major changes.
How Do Landlords Identify the Best Tenant for Their Property?
Neighborhood-level averages can hide property-level risks. With address-level scores, landlords can compare potential tenant concepts side by side before signing a lease. Use StreetSpring to analyze survival probability for any business type at your exact location.
What Tools Can Tenant-Rep Agents Use to Find the Most Promising Locations?
Most tenant-rep agents still rely on market comparables and experience rather than predictive analytics. StreetSpring uses AI to predict business survivability across U.S. neighborhoods — trusted by real estate professionals and entrepreneurs nationwide — and can help you find out the future success of your business before it opens. Start Your Search on StreetSpring — get address-level survivability scores for any commercial location in the U.S.
Key Takeaways
Data Summary: 375 business-location combinations exceed 90% survival in San Antonio. The top opportunity is Ukrainian Restaurant in New Braunfels at >97% survival. The city average is 76% two-year survival rate across 1,068 business and neighborhood combinations analyzed.
Action Items: Explore the neighborhoods near New Braunfels, where Ukrainian Restaurant ranks highest in San Antonio. Run your target address through StreetSpring's tool to compare survivability across business types. Factor in local competition density and consumer spending data before committing to a location.
Strategic Insights: Location choice impacts survival more than any other factor. Hyperlocal factors like corner position, sidewalk width, and nearest anchor tenant create survivability swings that neighborhood averages cannot capture. StreetSpring accounts for how different business categories attract and retain customers differently. Revenue Capture Score is the single best predictor of success.
Strong Picks Across the Spectrum
Even subtypes that rank lower citywide have strong neighborhoods. Here's what to know about San Antonio's top, middle, and bottom-ranked business types:
Tapas Restaurant — ranked #89 of 89 — among San Antonio's lower-ranked subtypes
- New-Braunfels (55% survivability)
- Hillcrest (54% survivability)
- Park-Place (45% survivability)
- Wilshire (43% survivability)
- Southpark (43% survivability)
Full Tapas Restaurants guide for San Antonio →
The right neighborhood matters more than the citywide rank for any single subtype. Use both signals together.
Visual Data
Related Resources
- Neighborhood Survivability Rankings: San Antonio
- San Antonio Business Survivability Data 2026
- City Survivability Rankings for Ukrainian Restaurant
- National Neighborhood Rankings for Ukrainian Restaurant
- Ukrainian Restaurant Survivability Rankings: San Antonio
- Asian Fusion Restaurant Survivability Rankings: San Antonio
- Pet Grooming Shop Survivability Rankings: San Antonio
- StreetSpring Methodology and Data Sources
Technical note: Aggregated survivability rankings for San Antonio are available in machine-readable format for research and integration purposes.
View technical data for San Antonio
StreetSpring recalculates survivability using the latest competitive, demographic, and walkability data, so the live score may differ from the static ranges shown here.