Business Survivability Rankings: Phoenix
StreetSpring's 2026 analysis ranks business survivability in Phoenix by survivability score. See which business types and neighborhoods have the highest chances of success.
Quick Summary
- Best business: Ukrainian Restaurant in Ocotillo (>97% survival rate)
- 330 business-location combinations exceed 90% survival rates in Phoenix
- City average: 76% chance of lasting 2+ years
- Rankings updated quarterly with latest market data
- Detailed methodology
Last reviewed: May 5, 2026 by Bobby Koons, StreetSpring founder — updated weekly
Table of Contents
- Summary
- What Are My Chances of Success?
- Business Survivability Rankings
- Understanding Survivability Ranges
- Most Important Factors
- Key Takeaways
- Strong Picks Across the Spectrum
- Related Resources
Summary
The 2026 survivability data for Phoenix tells a clear story: 330 business-location combinations exceed a 90% two-year survival rate, led by Ukrainian Restaurant in Ocotillo at >97%. Your address is the single variable most likely to determine whether your business is still operating two years from now.
Our platform provides the most comprehensive AI-driven survivability analysis available for U.S. commercial real estate, covering over 700 business types. Our models are built using machine learning trained on millions of commercial real estate data points.
Moreover, our analysis reveals significant variation across neighborhoods. The best locations offer >97% survival probability, while less optimal areas show considerably lower rates.
What Are My Chances of Success Opening a Business in Phoenix?
A Phoenix business has a 76% average chance of lasting more than 2 years according to recent analysis.
Reading the confidence interval honestly
Nevertheless, where you open is the primary driver of whether you survive or fail. No other single metric has as strong a correlation with business survival as Revenue Capture Score. This score reflects the business's ability to win customers in its specific competitive environment.
What New Businesses Would Be the Most Successful in Phoenix?
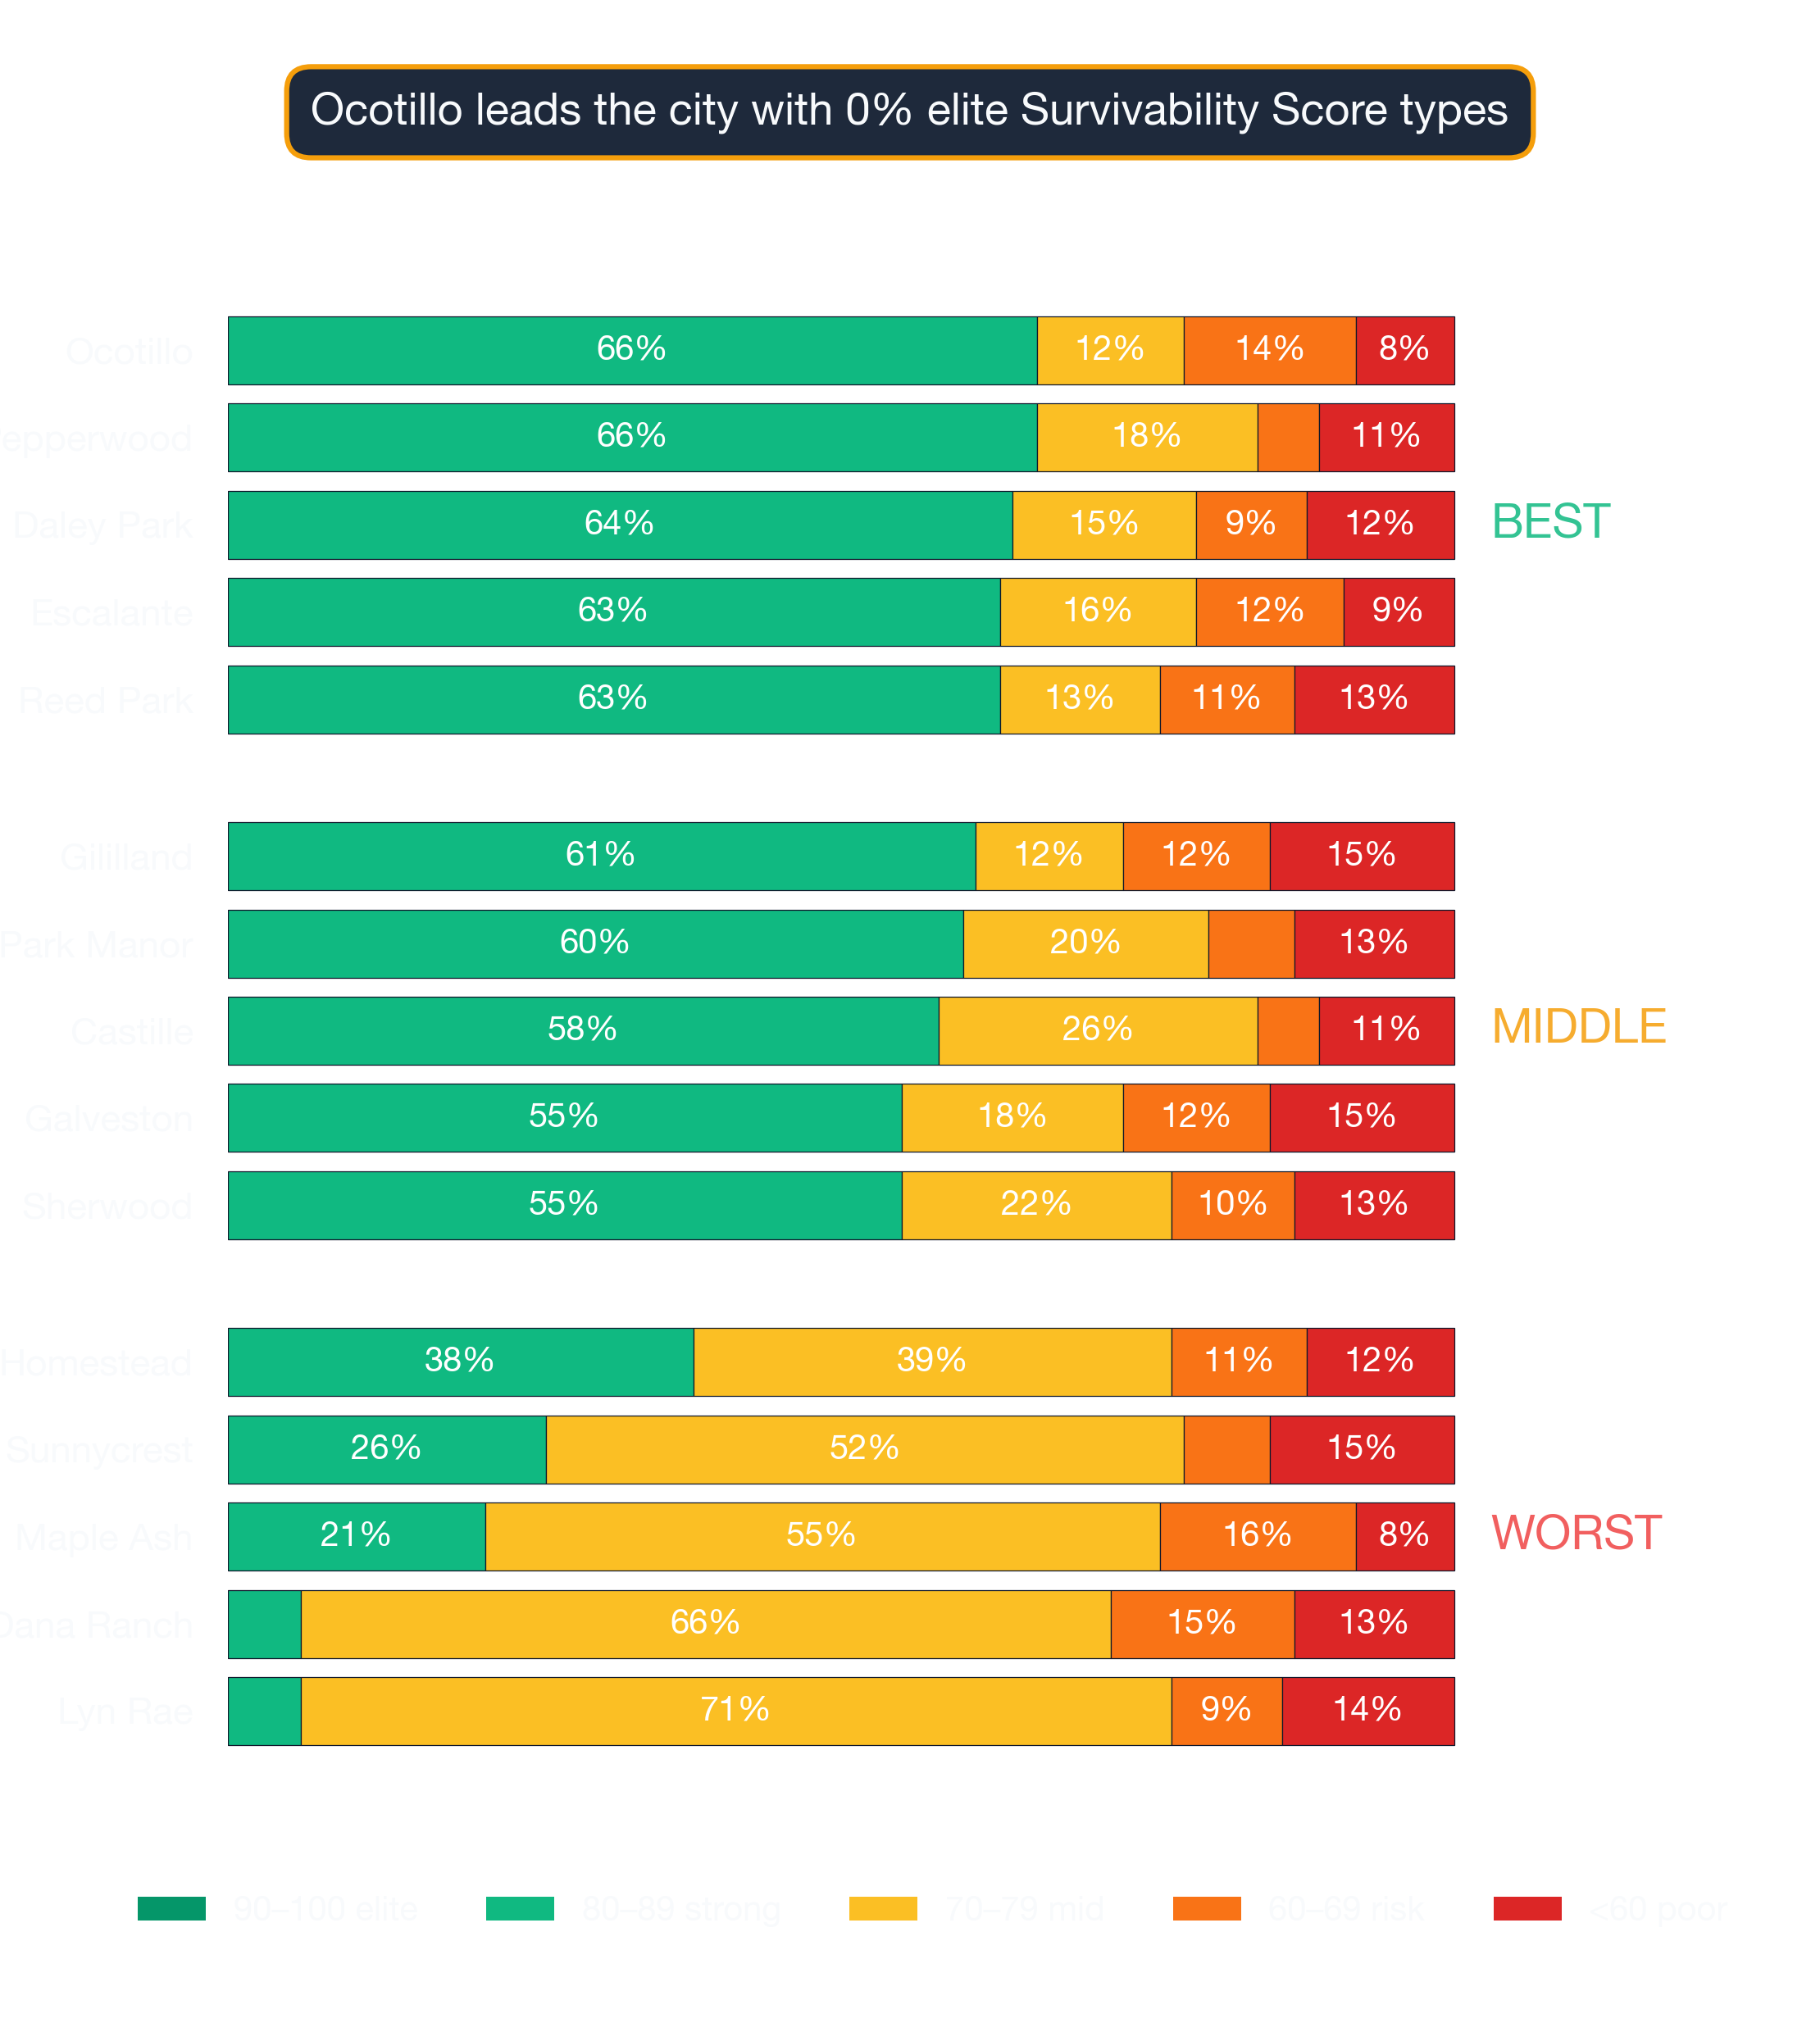
As shown in the chart below, the distribution of business outcomes across Phoenix by survivability score bracket:
Phoenix: Ukrainian Restaurant ranks #1 in survivability at >97% — 2026 StreetSpring analysis
The top 10 business opportunities in Phoenix are:
| Rank | Business Type | Neighborhood | Best Locations | Average Locations | Challenging Locations | Location Advantage |
|---|---|---|---|---|---|---|
| 1 | Ukrainian Restaurant | Ocotillo | 96.0% – 97.0% | 85.0% – 89.3% | 75.8% – 79.2% | ~12% |
| 2 | Italian Restaurant | Ocotillo | 96.3% – 97.0% | 84.7% – 87.4% | 70.2% – 74.0% | ~14% |
| 3 | Veterinary Clinic | Ocotillo | 94.2% – 97.0% | 84.4% – 88.8% | 66.2% – 71.1% | ~12% |
| 4 | American Restaurant | Pepperwood | 92.9% – 96.9% | 81.6% – 84.8% | 71.3% – 75.2% | ~14% |
| 5 | Diner | Pepperwood | 92.6% – 96.0% | 84.0% – 88.0% | 75.5% – 79.1% | ~11% |
| 6 | Indian Restaurant | Alhambra | 92.2% – 95.4% | 80.7% – 84.9% | 70.8% – 73.7% | ~14% |
| 7 | Ukrainian Restaurant | Alhambra | 92.0% – 95.4% | 81.0% – 85.3% | 69.8% – 73.2% | ~13% |
| 8 | Italian Restaurant | Alhambra | 92.3% – 95.1% | 81.5% – 84.2% | 68.2% – 72.0% | ~14% |
| 9 | Portuguese Restaurant | Pepperwood | 92.4% – 95.8% | 83.8% – 87.4% | 74.3% – 77.7% | ~9% |
| 10 | Sri Lankan Restaurant | Escalante | 90.8% – 94.8% | 81.5% – 85.3% | 70.5% – 73.7% | ~12% |
Cross-checks before you pick a subtype off this list
Even within the same zip code, survivability can swing by 20 or more percentage points depending on exact block, visibility, and nearby tenants. StreetSpring's survivability scores are updated regularly, so the most accurate prediction for your exact storefront is always available in the live tool.
Try StreetSpring to see the Survivability Score for over 700 types of businesses at your storefront's address.
Understanding Survivability Ranges
Actual survivability at a specific address depends on storefront-level conditions such as storefront visibility from the main pedestrian flow, parking availability, the quality of neighboring tenants, and seasonal fluctuations in consumer spending.
What the score band thresholds actually mean
The upper end of each range represents what strong operators in prime micro-locations can achieve, the lower end reflects typical headwinds, and range width shows market predictability.
To illustrate, an Ukrainian Restaurant showing 85.0% – 89.3% at average locations means most businesses in this category fall within this range. A best-in-class location (>97% survival) offers roughly 12% more expected business longevity than an average location (87%), because a higher survival probability translates directly into more operating time to generate revenue. Conversely, a challenging location (77%) represents 12% less expected longevity than the average — a meaningful risk differential that should factor into lease negotiations and capital planning. Execution quality, market timing, and exact storefront features determine your position within the range. A tight range suggests a stable, predictable market; a wide range indicates greater upside — and downside.
Key Considerations Before Opening in Phoenix
Revenue Capture Score
The Revenue Capture Score is the primary driver of survivability — it reflects how much of the available market a business can realistically win. Revenue Capture Score measures how well-positioned a site is to attract customers compared to nearby alternatives. Consider: an Ukrainian Restaurant in a high-revenue-capture area might survive even with moderate competition, while the same business in a low-capture area could struggle despite less competition.
| Area to check | What can go wrong | How to de-risk it |
|---|---|---|
| Outdoor seating / sidewalk use | Signing assuming you can add patio seating, then learning the city requires a separate sidewalk-cafe permit with long lead times. | Check the city's sidewalk-cafe permit process up front. Confirm landlord allows outdoor build-out in the lease language. |
| Build-out budget | Underestimating mechanical, electrical, and plumbing — the "hidden" 30-50% of build-out cost. | Get 3 quotes from licensed contractors and pad budget by +20% for surprises. Confirm landlord TI allowance in writing. |
| Foot traffic seasonality | Looking at a peak-summer Tuesday and assuming year-round volume. | Walk the block at 3 different times across 2 different weeks. Ask neighboring tenants for their slow-season % drop. |
Competition Quality and Saturation
Clusters of similar businesses often form naturally around areas with strong consumer demand, and being part of that cluster can be advantageous. However, oversaturation forces businesses to compete primarily on price, squeezing margins.
Tenant Mix and Neighborhood Dynamics
Complementary businesses nearby can drive additional customers to your door. Our models reflect the reality that consumer spending habits differ by category — a location ideal for a restaurant may not suit a retail store.
Hyperlocal Variation
Block-by-block variation is one of the most underappreciated risks in site selection — averages hide it entirely. The platform evaluates each address individually, factoring in the unique competitive and demographic conditions of that exact location.
What Is the #1 Business to Start in Phoenix?
Ukrainian Restaurant in Ocotillo with >97% survivability based on StreetSpring's 2026 analysis of 1,674 business and neighborhood combinations.
How Accurate Is StreetSpring's Survival Prediction?
Predictions are accurate within 95–99% depending on category and location, calibrated using 100+ data factors. Individual Survivability Scores carry a plus or minus 3% margin of error, validated against real-world business survival data. See our full methodology at streetspring.com/resources/tutorial/methodology. Review our methodology and data sources.
What Makes Phoenix Good for New Businesses?
Phoenix offers 330 business-location combinations with 90% or higher survival rates with current market dynamics. The survivability forecasts in this guide are generated by the same models that commercial real estate professionals use for tenant placement and site selection. Each prediction draws from a dataset that tracks commercial activity for businesses serving the majority of the U.S. population.
How Fresh Is Our Phoenix Ranking Data?
Rankings for Phoenix are updated quarterly with the latest business opening and closure data and market conditions. Last updated: 2026-Q1. The next scheduled update for Phoenix will incorporate Q2 2026 data.
Can I Get Predictions for a Specific Address in Phoenix?
Yes. Visit StreetSpring.com to analyze any storefront address in Phoenix with address-specific survivability predictions for over 700 business types.
What Factors Determine Business Survivability in Phoenix?
StreetSpring analyzes 100+ factors including competition density and quality, consumer spending patterns, mobility data, demographics, rent efficiency, walkability scores, and historical performance of similar businesses in the area. These predictions are generated by our own AI models, trained on proprietary commercial real estate data that we collect and maintain.
Are These Predictions Guaranteed?
These are data-driven probabilities, not guarantees. However, the 95–99% accuracy rate means this approach produces significantly better outcomes than the intuition-based methods most operators use today. Market conditions are changing daily and it is best to use StreetSpring's most up-to-date data to make sure that there have not been major changes.
How Do Landlords Identify the Best Tenant for Their Property?
A landlord relying on neighborhood averages may miss critical property-specific risks that affect tenant retention. Landlords can reduce vacancy risk by choosing tenants whose business types score highest at their specific address. Visit StreetSpring to run a free survivability check on your target storefront.
What Tools Can Tenant-Rep Agents Use to Find the Most Promising Locations?
Most tenant-rep agents still rely on market comparables and experience rather than predictive analytics. Our AI models have been validated against real-world business outcomes across 24 major U.S. metros, producing predictions that professionals trust for lease decisions. Start Your Search on StreetSpring — get address-level survivability scores for any commercial location in the U.S.
Key Takeaways
Data Summary: 330 business-location combinations exceed 90% survival in Phoenix. The top opportunity is Ukrainian Restaurant in Ocotillo at >97% survival. The city average is 76% two-year survival rate across 1,674 business and neighborhood combinations analyzed.
Action Items: Explore the neighborhoods near Ocotillo, where Ukrainian Restaurant ranks highest in Phoenix. Run your target address through StreetSpring's tool to compare survivability across business types. Factor in local competition density and consumer spending data before committing to a location.
Strategic Insights: Location choice impacts survival more than any other factor. Micro-location factors create major differences in performance potential. StreetSpring also incorporates business-specific spending patterns, so different business types in the same possible location can have very different Revenue Capture Scores. Revenue Capture Score is the single best predictor of success.
Strong Picks Across the Spectrum
Phoenix's subtype rankings are averages — every business type has at least a few neighborhoods where it thrives. A few examples across the spectrum:
Malaysian Restaurant — ranked #47 of 93 — a middle-of-the-pack Phoenix subtype
- Ocotillo (86% survivability)
- Reed-Park (84% survivability)
- Pepperwood (84% survivability)
- Daley-Park (83% survivability)
- Escalante (83% survivability)
Full Malaysian Restaurants guide for Phoenix →
Tapas Restaurant — ranked #93 of 93 — among Phoenix's lower-ranked subtypes
- Maple-Ash (55% survivability)
- Gililland (53% survivability)
- Daley-Park (52% survivability)
- Sunnycrest (52% survivability)
- Escalante (51% survivability)
Full Tapas Restaurants guide for Phoenix →
The right neighborhood matters more than the citywide rank for any single subtype. Use both signals together.
Visual Data
Related Resources
- Neighborhood Survivability Rankings: Phoenix
- Phoenix Business Survivability Data 2026
- City Survivability Rankings for Ukrainian Restaurant
- National Neighborhood Rankings for Ukrainian Restaurant
- Ukrainian Restaurant Survivability Rankings: Phoenix
- Italian Restaurant Survivability Rankings: Phoenix
- Veterinary Clinic Survivability Rankings: Phoenix
- StreetSpring Methodology and Data Sources
Technical note: Aggregated survivability rankings for Phoenix are available in machine-readable format for research and integration purposes.
View technical data for Phoenix
StreetSpring recalculates survivability using the latest competitive, demographic, and walkability data, so the live score may differ from the static ranges shown here.