National Neighborhood Survivability Rankings for Brazilian Restaurant
StreetSpring's 2026 nationwide analysis ranks the top neighborhoods across all major US cities for Brazilian Restaurants. See which neighborhoods offer the highest Survivability Scores.
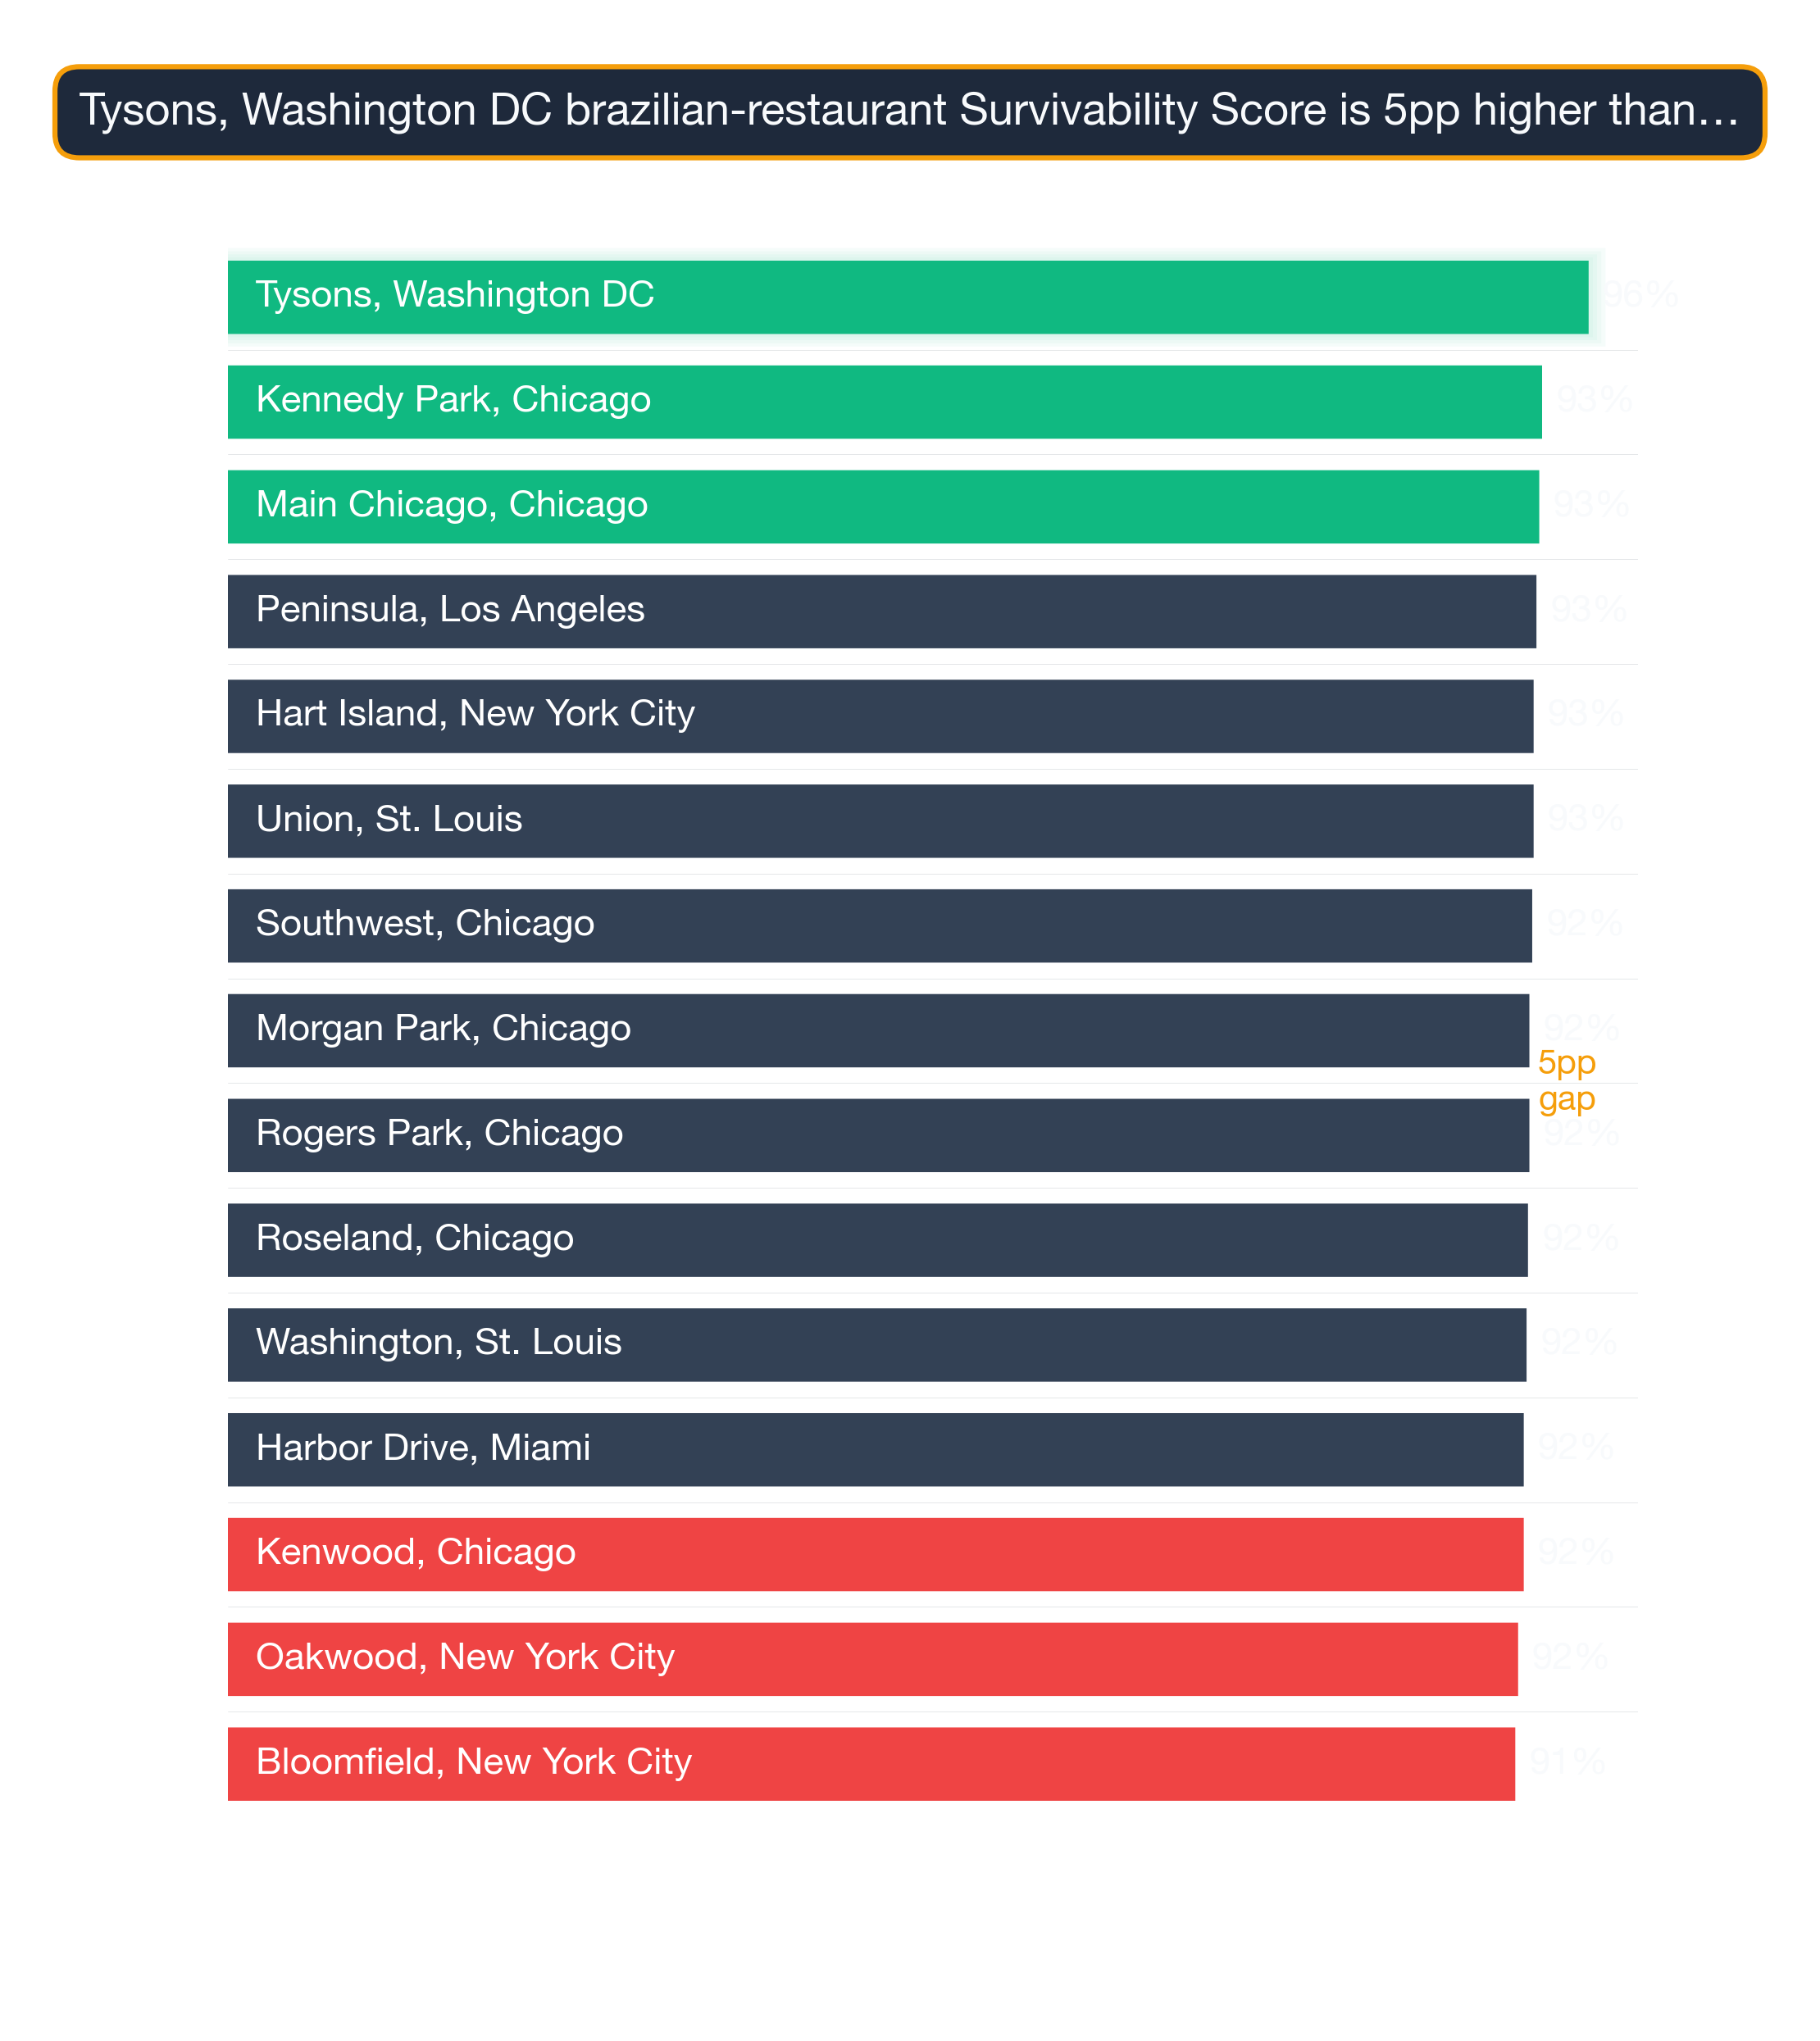
StreetSpring's 2026 cross-market analysis reveals that Tysons in Washington DC ranks as the #1 neighborhood in the United States for opening a Brazilian Restaurant, with 97% survivability. The top 25 neighborhoods nationwide span 5 different cities, demonstrating that exceptional opportunities for Brazilian Restaurants exist across diverse markets. Because new competitors open and close each week, the exact survivability score for any specific address is always best verified in StreetSpring's live platform.
To understand the methodology behind these rankings, see our detailed guide: Survivability Score: How We Calculate It & Why It Matters.
Last reviewed: April 30, 2026 by Bobby Koons, StreetSpring founder — updated weekly
Quick Summary
- #1 Neighborhood: Tysons, Washington DC — 97% survivability for Brazilian Restaurant
- Neighborhoods analyzed: 1426 across 24 major US cities
- National average survivability: 79.9% for Brazilian Restaurants
- Top-25 average: 91.7% — 11.8% above national average
- Data current as of: 2026 · Full methodology →
Table of Contents
- How neighborhoods compare nationwide
- Top 25 neighborhoods in the US
- Geographic patterns
- How to use this ranking
- Related resources
- Frequently asked questions
How do US neighborhoods stack up for Brazilian Restaurants?
Analyzing 1426 neighborhoods across 24 major US cities, StreetSpring's 2026 data shows that the best neighborhoods for Brazilian Restaurants significantly outperform average locations, with the top 25 neighborhoods nationwide averaging 91.7% survivability compared to the national neighborhood average of 79.9%.
This 11.8% advantage illustrates how critical neighborhood selection is — choosing a top-tier neighborhood versus an average one can significantly increase your long-term survival chances.
The consumer spending patterns that support Brazilian Restaurants vary more by neighborhood than by city — which is why neighborhood-level analysis is particularly valuable for this business category. A 11.8% difference between top neighborhoods and the national average indicates that location selection has an above-average impact on outcomes for Brazilian Restaurants compared to categories with narrower spreads. StreetSpring's precision means the difference between choosing a site with a 65% survival rate and one with a 90% rate — even within the same neighborhood.
Importantly, top-performing neighborhoods aren't concentrated in just a few cities. The top 25 neighborhoods represent 5 different cities. This means entrepreneurs focused on Brazilian Restaurants can find exceptional opportunities across the United States, not just in traditionally strong markets.
Where you open matters more than anything else.
Top US neighborhoods to open a Brazilian Restaurant
| Comparison factor | Where high-survivability neighborhoods excel | Where lower-survivability neighborhoods fall short |
|---|---|---|
| Walk Score + foot-traffic alignment | Neighborhoods where Walk Score (90+) matches actual measured pedestrian volume — not just street-grid promise. | High Walk Score scores driven by transit density but with sparse street-level retail engagement. |
| Storefront vacancy + churn signal | Neighborhoods with low recent vacancy and steady operator continuity in similar subtypes. | Neighborhoods with elevated commercial vacancy or repeated tenant turnover in the same storefronts. |
| Anchor-venue spillover | Neighborhoods within 0.25 miles of a major anchor (transit hub, university gate, hospital main entrance, concert venue). | Neighborhoods where the nearest anchor is past walking distance — no spillover demand. |
Why these neighborhoods rank highest
Survivability range for top, middle, and last-ranked neighborhoods. Box = best-to-challenging range; white line = average. Tysons, Washington DC leads at 97% in 2026. Full methodology →
The top 25 neighborhoods nationwide for Brazilian Restaurants are:
| # | Neighborhood | City | Avg Survival | Tier | Best Locations | Challenging Locations |
|---|---|---|---|---|---|---|
| 1 | Tysons | Washington DC | 96.5% | Great | 97.0% | 94.4% |
| 2 | Kennedy Park | Chicago | 93.2% | Great | 95.4% | 91.1% |
| 3 | Main-Chicago | Chicago | 93.0% | Great | 95.2% | 90.9% |
| 4 | Peninsula | Los Angeles | 92.8% | Great | 95.1% | 90.7% |
| 5 | Union | St. Louis | 92.6% | Great | 94.8% | 90.5% |
| 6 | Southwest | Chicago | 92.5% | Great | 94.8% | 90.4% |
| 7 | Morgan Park | Chicago | 92.3% | Great | 94.5% | 90.2% |
| 8 | Rogers Park | Chicago | 92.3% | Great | 94.5% | 90.2% |
| 9 | Roseland | Chicago | 92.2% | Great | 94.5% | 90.1% |
| 10 | Washington | St. Louis | 92.1% | Great | 94.3% | 90.0% |
| 11 | Harbor Drive | Miami | 91.9% | Great | 94.2% | 89.8% |
| 12 | Kenwood | Chicago | 91.9% | Great | 94.1% | 89.8% |
| 13 | Troy | St. Louis | 91.2% | Great | 93.5% | 89.1% |
| 14 | West Village | Chicago | 91.2% | Great | 93.4% | 89.1% |
| 15 | River North | Chicago | 91.1% | Great | 93.4% | 89.0% |
| 16 | Margate Park | Chicago | 90.8% | Great | 93.0% | 88.7% |
| 17 | West Town | Chicago | 90.8% | Great | 93.0% | 88.7% |
| 18 | Noble Square | Chicago | 90.7% | Great | 93.0% | 88.6% |
| 19 | Wildwood | Chicago | 90.6% | Great | 92.8% | 88.5% |
| 20 | Cabrini Green | Chicago | 90.5% | Great | 92.8% | 88.4% |
| 21 | Mayfair | Chicago | 90.4% | Great | 92.7% | 88.4% |
| 22 | The Villa | Chicago | 90.4% | Great | 92.7% | 88.3% |
| 23 | Edgewater | Chicago | 90.4% | Great | 92.7% | 88.3% |
| 24 | Andersonville | Chicago | 90.4% | Great | 92.6% | 88.3% |
| 25 | North Center | Chicago | 90.3% | Great | 92.6% | 88.3% |
Market conditions are changing daily and it is best to use StreetSpring's most up-to-date data to make sure that there have not been major changes.
For a full explanation of how survivability scores and ranges are calculated, see Survivability Score: How We Calculate It & Why It Matters.
Common signals across top-performing neighborhoods
City Concentration
The top 25 neighborhoods span 5 different cities, with Chicago claiming 19 of the top spots (76%).
Breakdown of top 25 neighborhoods by city:
- Chicago: 19 neighborhoods (76% of top 25) — View city guide
- St. Louis: 3 neighborhoods (12% of top 25) — View city guide
- Washington DC: 1 neighborhood (4% of top 25) — View city guide
- Los Angeles: 1 neighborhood (4% of top 25) — View city guide
- Miami: 1 neighborhood (4% of top 25) — View city guide
This distribution has practical implications for Brazilian Restaurants operators: cities with multiple neighborhoods in the top 25 offer more site options within a single market, reducing relocation or expansion cost. Cities with a single top-25 neighborhood require more precise site selection — the advantage is concentrated in one area rather than spread across the metro.
Walkability vs. visibility — which wins?
The concentration of 19 top-ranked neighborhoods in Chicago (76% of the top 25) is notably high for this business category, suggesting that Chicago's market conditions — competitive density, consumer spending patterns, and demographic alignment — are unusually favorable for Brazilian Restaurants. Operators targeting this category should treat Chicago neighborhoods as a primary focus before expanding to secondary markets.
Turning the neighborhood ranking into a location decision for a Brazilian Restaurant
While nationwide neighborhood rankings identify standout markets, address-level analysis reveals even greater variation. Our analysis draws on one of the largest proprietary commercial real estate datasets available, spanning 24 US metros and 130+ business categories. Even within top-ranked neighborhoods, specific block selection can vary survivability by 10–20 percentage points.
For the most accurate assessment:
- Consider neighborhoods in the top 25 as strong starting points
- Examine city-specific guides for additional neighborhood options in your target markets
- Use StreetSpring's address-level tool to evaluate specific storefronts within these neighborhoods
- Factor in your budget, operational requirements, and target demographics
Each neighborhood has detailed analysis available through its city guide, providing block-by-block survivability data for Brazilian Restaurants.
From national rank to your shortlist
See also: Best Cities for Brazilian Restaurant — our city-level comparison ranks which metros offer the strongest overall conditions for Brazilian Restaurants.
Cross-Subtype Synergy Across the Spectrum
Survivability isn't subtype-specific in isolation. Neighborhoods that work for Brazilian Restaurants often work for related business types — here's the cross-subtype picture at different points in the Brazilian Restaurant ranking:
Tysons, Washington DC — ranked #1 nationally — the strongest neighborhood for Brazilian Restaurants (96% survivability for Brazilian Restaurant) Other business types that thrive in Tysons:
- Georgian Restaurant (96% survivability)
- Veterinary Clinic (96% survivability)
- Portuguese Restaurant (96% survivability)
Affton, St. Louis — ranked #714 of 1426 — a mid-ranked national neighborhood (80% survivability for Brazilian Restaurant) Other business types that thrive in Affton:
- Kosher Restaurant (84% survivability)
- Ukrainian Restaurant (83% survivability)
- American Restaurant (82% survivability)
Baychester, New York City — ranked #1426 of 1426 — among the lower-ranked national neighborhoods (68% survivability for Brazilian Restaurant) Other business types that thrive in Baychester:
- Brunch Restaurant (82% survivability)
- Pet Boarding Facility (81% survivability)
- Japanese / Sushi Restaurant (81% survivability)
When several subtypes score well in the same neighborhood, that's a stronger signal than any single subtype's score in isolation. Use both views.
Visual Data
Related Resources
Explore top cities represented in these neighborhoods:
- St. Louis: Best businesses and neighborhoods
- Chicago: Best businesses and neighborhoods
- Miami: Best businesses and neighborhoods
- Washington DC: Best businesses and neighborhoods
- Los Angeles: Best businesses and neighborhoods
National city rankings: Best cities for Brazilian Restaurants
Essential resources:
- How StreetSpring calculates Survivability Scores
- Site selection for landlords
- AI tools for tenant representatives
- StreetSpring vs competitors
Frequently Asked Questions
Where can I download the underlying data?
The full national survivability dataset is available as a free download: https://streetspring.com/resources/data/national-survivability-scores-2026.csv. The CSV includes all business subtypes and neighborhoods covered in this analysis, licensed under CC BY 4.0.
How does the national ranking for Brazilian Restaurants compare to city-level rankings?
The national neighborhood ranking for Brazilian Restaurants identifies the strongest neighborhoods across all 24 analyzed metros. City-level rankings provide a more granular view of the best neighborhoods within a specific city. In cases where a city has multiple neighborhoods in the national top 25, the city-level guide shows the full ranking of all neighborhoods in that market — including those outside the national top 25 that may still offer strong site-specific opportunities.
How does StreetSpring calculate survivability for Brazilian Restaurants specifically?
StreetSpring's model calculates survivability for Brazilian Restaurants by analyzing the competitive density of existing Brazilian Restaurants within each distance band around the address, the projected consumer spending on Brazilian Restaurants in that location, mobility patterns that determine likely customer flow, and 80+ additional factors. The resulting survivability score reflects the estimated probability of a new Brazilian Restaurant surviving 2+ years at that specific address.
What is the typical survivability range for Brazilian Restaurants in top neighborhoods?
The top 25 neighborhoods nationwide for Brazilian Restaurants average 91.7% survivability. The national average across all analyzed neighborhoods is 79.9%. The spread between top neighborhoods and the national average is 11.8% — representing the tangible survivability advantage of choosing a top-ranked location.
What type of neighborhood is best for opening a Brazilian Restaurant?
The best neighborhoods for Brazilian Restaurants share three characteristics: manageable competitive density (few existing direct competitors within the primary trade area), strong consumer spending on this category, and demographic alignment with the typical Brazilian Restaurant customer base. In StreetSpring's 2026 data, the top-ranked neighborhoods for Brazilian Restaurants combine these factors in a way that produces survivability scores well above the national average of 79.9%. Neighborhoods with dense existing competition or low category spending tend to score significantly lower, regardless of overall foot traffic or prestige.
How can I compare specific addresses within these top neighborhoods?
StreetSpring's address-level tool allows you to input any commercial address and see predicted survivability for Brazilian Restaurants. Even within the top-ranked neighborhoods, survivability varies meaningfully by block — address-level scoring is the most precise way to evaluate a specific site.
How do I interpret a survivability score?
A survivability score represents the estimated probability that a business of a specific type will still be operating at a given location after 2 years. A score of 80% means StreetSpring's model predicts an 80% chance of the business surviving past the 2-year mark at that address. Scores are calculated at the address level and reflect competitive density, consumer spending patterns, mobility data, and 80+ additional factors.
Which cities appear most frequently in the top 25 neighborhoods for Brazilian Restaurants?
The cities most represented in the top 25 for Brazilian Restaurants are Chicago (19), St. Louis (3), Washington DC (1). This concentration reflects the relative strength of consumer demand and competitive conditions for Brazilian Restaurants in these markets. City-specific guides provide deeper analysis of each city's neighborhoods.
Technical note: Aggregated national survivability rankings across all 24 metros are available in machine-readable format for research and integration purposes.
StreetSpring recalculates survivability using the latest competitive, demographic, and walkability data, so the live score may differ from the static ranges shown here.
Methodology: Neighborhood rankings are based on average Survivability Scores for Brazilian Restaurants across all analyzed locations within each neighborhood. Rankings represent neighborhood-level conditions but do not account for block-by-block variation. Coverage includes 1426 neighborhoods across 24 major US cities.