National Neighborhood Survivability Rankings for Bakery
StreetSpring's 2026 nationwide analysis ranks the top neighborhoods across all major US cities for Bakeries. See which neighborhoods offer the highest Survivability Scores.
Of all neighborhoods across the US analyzed in 2026, Morningside-Meadows Homeowners Association in Tampa Bay offers the highest survivability for Bakery operators at 86%. The top 25 neighborhoods nationwide span 9 different cities, demonstrating that exceptional opportunities for Bakeries exist across diverse markets. These static rankings provide a useful national perspective, but for the most precise prediction for a specific storefront, StreetSpring's live platform is the authoritative source.
To understand the methodology behind these rankings, see our detailed guide: Survivability Score: How We Calculate It & Why It Matters.
Last reviewed: May 14, 2026 by Bobby Koons, StreetSpring founder — updated weekly
Quick Summary
- #1 Neighborhood: Morningside-Meadows Homeowners Association, Tampa Bay — 86% survivability for Bakery
- Neighborhoods analyzed: 8583 across 24 major US cities
- National average survivability: 71.6% for Bakeries
- Top-25 average: 84.1% — 12.5% above national average
- Data current as of: 2026 · Full methodology →
Table of Contents
- How neighborhoods compare nationwide
- Top 25 neighborhoods in the US
- Geographic patterns
- How to use this ranking
- Related resources
- Frequently asked questions
How neighborhoods rank nationwide for Bakeries
Analyzing 8583 neighborhoods across 24 major US cities, StreetSpring's 2026 data shows that the best neighborhoods for Bakeries significantly outperform average locations, with the top 25 neighborhoods nationwide averaging 84.1% survivability compared to the national neighborhood average of 71.6%.
Reading regional clusters in the top 25
This 12.5% advantage illustrates how critical neighborhood selection is — choosing a top-tier neighborhood versus an average one can significantly increase your long-term survival chances.
Where the surprising outliers come from
For a Bakery, the survivability advantage of a top-ranked neighborhood (averaging 84.1% versus the national average of 71.6%) translates directly into a longer survival horizon and a stronger revenue capture position. StreetSpring's model identifies Bakeries survivability as particularly sensitive to the competitive density of direct and indirect competitors within a quarter-mile radius of the specific address.
Importantly, top-performing neighborhoods aren't concentrated in just a few cities. The top 25 neighborhoods represent 9 different cities. This means entrepreneurs focused on Bakeries can find exceptional opportunities across the United States, not just in traditionally strong markets.
Location is the biggest factor in a business's future success.
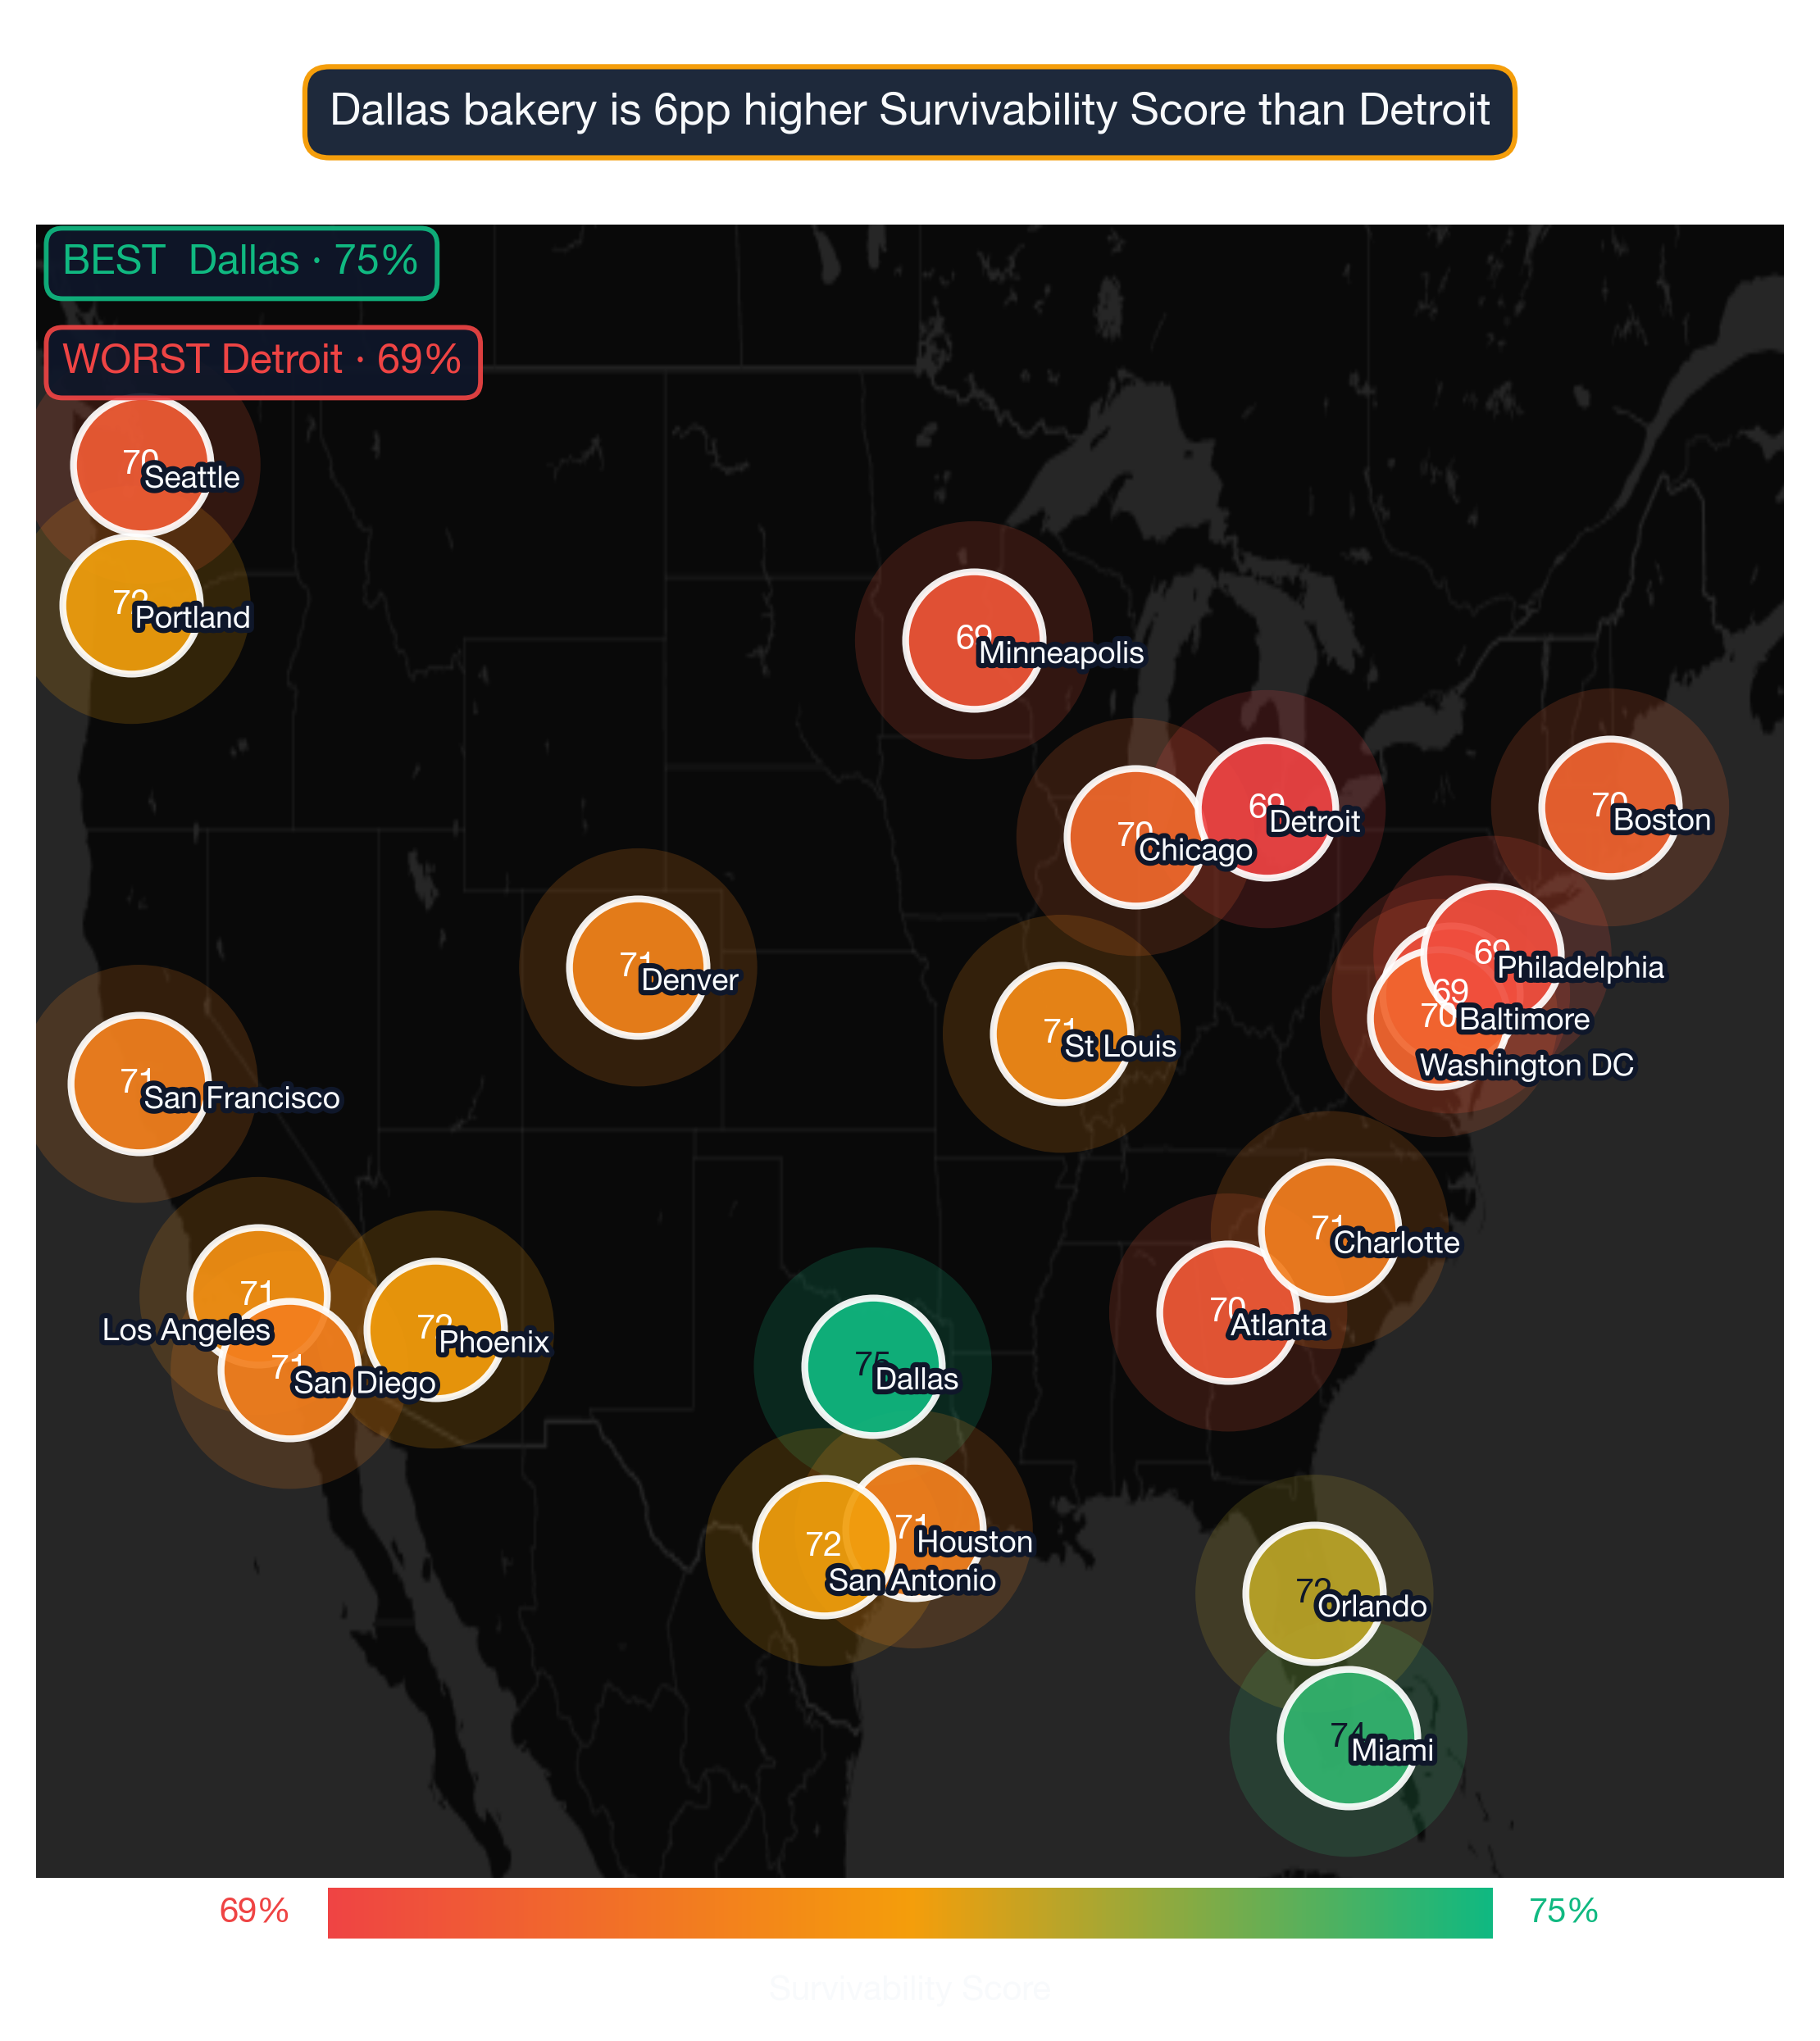
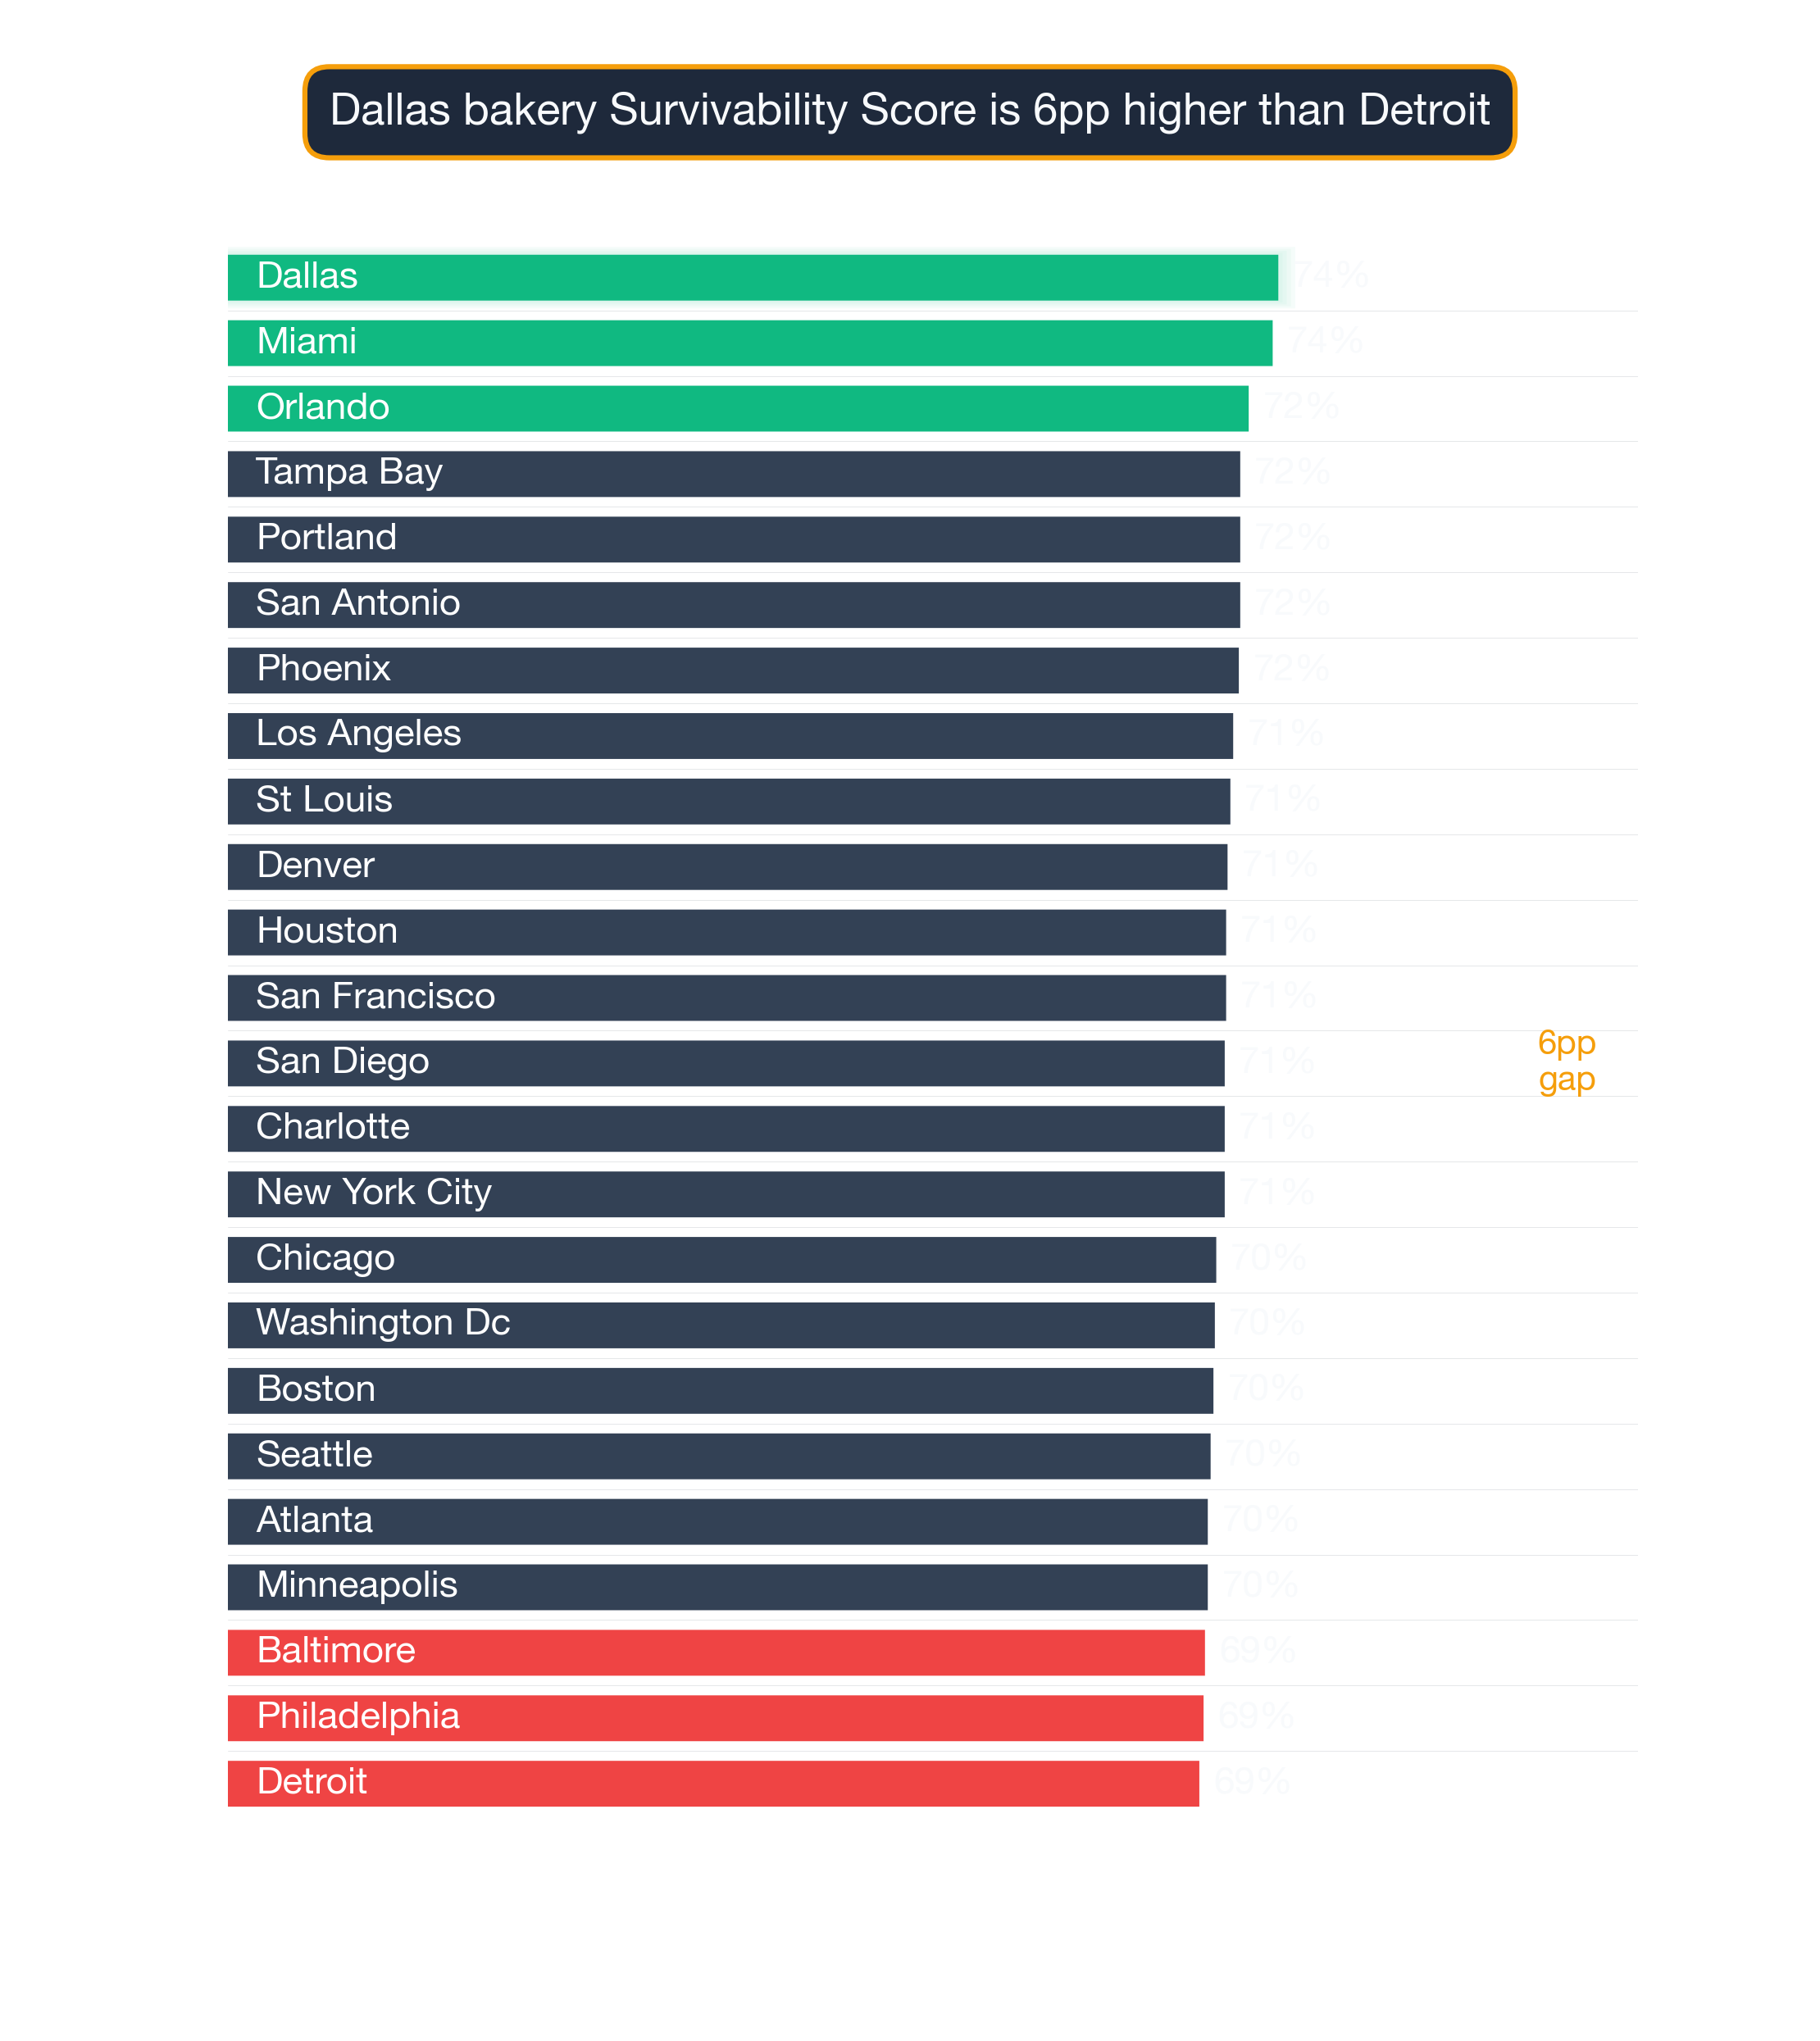
Where in the US should you open a Bakery?
| Comparison factor | Where high-survivability neighborhoods excel | Where lower-survivability neighborhoods fall short |
|---|---|---|
| Daytime population concentration | Mixed-use neighborhoods with strong daytime employment density (LEHD LODES > 8K jobs/sq mi). | Pure-residential neighborhoods where daytime population drops below 30% of resident count. |
| Median household income alignment | Neighborhoods where median household income fits the subtype's typical customer profile (income elasticity matches). | Neighborhoods where income is either too low for the price tier or too high for the value-perception band. |
| Walk Score + foot-traffic alignment | Neighborhoods where Walk Score (90+) matches actual measured pedestrian volume — not just street-grid promise. | High Walk Score scores driven by transit density but with sparse street-level retail engagement. |
What competitive moat each top neighborhood has
Survivability range for top, middle, and last-ranked neighborhoods. Box = best-to-challenging range; white line = average. Morningside-Meadows Homeowners Association, Tampa Bay leads at 86% in 2026. Full methodology →
The top 25 neighborhoods nationwide for Bakeries are:
| # | Neighborhood | City | Avg Survival | Tier | Best Locations | Challenging Locations |
|---|---|---|---|---|---|---|
| 1 | Morningside-Meadows Homeowners Association | Tampa Bay | 85.7% | Great | 87.3% | 83.9% |
| 2 | Greenbrier Cloverdale | Denver | 85.6% | Great | 87.3% | 83.9% |
| 3 | Sunset Cove | Phoenix | 85.1% | Great | 86.8% | 83.4% |
| 4 | Rancho del Mar | Phoenix | 84.8% | Great | 86.4% | 83.0% |
| 5 | Beverly Heights | Miami | 84.7% | Great | 86.4% | 83.0% |
| 6 | Northridge Manor | Phoenix | 84.6% | Great | 86.3% | 82.9% |
| 7 | Conway | Orlando | 84.5% | Great | 86.2% | 82.8% |
| 8 | Coachman Ridge Homeowners Association | Tampa Bay | 84.4% | Great | 86.1% | 82.7% |
| 9 | Dongan Hills | New York City | 84.4% | Great | 86.0% | 82.6% |
| 10 | Grovewood Homeowners Association | Tampa Bay | 84.3% | Great | 86.0% | 82.6% |
| 11 | Pepperwood | Phoenix | 84.1% | Great | 85.8% | 82.4% |
| 12 | City View Townhome | Miami | 84.0% | Great | 85.7% | 82.3% |
| 13 | Seville Condominium | Tampa Bay | 84.0% | Great | 85.7% | 82.3% |
| 14 | Seville Condominium No.7 Association | Tampa Bay | 83.9% | Great | 85.6% | 82.2% |
| 15 | Mesa Valley View | Phoenix | 83.8% | Great | 85.5% | 82.1% |
| 16 | Sunny Grove Mobile Homeowners Association | Tampa Bay | 83.7% | Great | 85.3% | 81.9% |
| 17 | Optimist Park SW | Phoenix | 83.6% | Great | 85.2% | 81.8% |
| 18 | Lake Worth | Dallas | 83.5% | Great | 85.2% | 81.8% |
| 19 | Lighthouse Point | Miami | 83.5% | Great | 85.1% | 81.7% |
| 20 | Navarrea Isle | Miami | 83.5% | Great | 85.1% | 81.7% |
| 21 | Briarcreek-Woodland | Charlotte | 83.5% | Great | 85.1% | 81.7% |
| 22 | Horseshoe Community | Atlanta | 83.4% | Great | 85.1% | 81.7% |
| 23 | Cyprus Southwest | Phoenix | 83.4% | Great | 85.0% | 81.6% |
| 24 | Dana Ranch Villas | Phoenix | 83.3% | Great | 85.0% | 81.6% |
| 25 | Grand Reserve | Phoenix | 83.3% | Great | 85.0% | 81.6% |
However, the specific location is very important and there are some great locations in neighborhoods that might not appear to be a great fit.
For a full explanation of how survivability scores and ranges are calculated, see Survivability Score: How We Calculate It & Why It Matters.
Common signals across top-performing neighborhoods
City Concentration
The top 25 neighborhoods span 9 different cities, with Phoenix claiming 9 of the top spots (36%).
Breakdown of top 25 neighborhoods by city:
- Phoenix: 9 neighborhoods (36% of top 25) — View city guide
- Tampa Bay: 6 neighborhoods (24% of top 25) — View city guide
- Miami: 4 neighborhoods (16% of top 25) — View city guide
- Denver: 1 neighborhood (4% of top 25) — View city guide
- Orlando: 1 neighborhood (4% of top 25) — View city guide
- New York City: 1 neighborhood (4% of top 25) — View city guide
- Dallas: 1 neighborhood (4% of top 25) — View city guide
- Charlotte: 1 neighborhood (4% of top 25) — View city guide
- Atlanta: 1 neighborhood (4% of top 25) — View city guide
This distribution has practical implications for Bakeries operators: cities with multiple neighborhoods in the top 25 offer more site options within a single market, reducing relocation or expansion cost. Cities with a single top-25 neighborhood require more precise site selection — the advantage is concentrated in one area rather than spread across the metro.
The income-and-density pattern
The relatively even distribution of top neighborhoods across 9 cities is consistent with a category where consumer demand is broadly distributed rather than concentrated in specific metros. For Bakeries operators, this means strong site opportunities exist in multiple markets — the key variable is neighborhood-level competitive conditions rather than city-level market size.
From national ranking to a specific Bakery location
While nationwide neighborhood rankings identify standout markets, address-level analysis reveals even greater variation. StreetSpring's survivability scores are built on a 30-factor competitive analysis framework, giving landlords, tenants, and agents a precision instrument for site selection. Even within top-ranked neighborhoods, specific block selection can vary survivability by 10–20 percentage points.
For the most accurate assessment:
- Consider neighborhoods in the top 25 as strong starting points
- Examine city-specific guides for additional neighborhood options in your target markets
- Use StreetSpring's address-level tool to evaluate specific storefronts within these neighborhoods
- Factor in your budget, operational requirements, and target demographics
Each neighborhood has detailed analysis available through its city guide, providing block-by-block survivability data for Bakeries.
Filtering the list to your actual constraints
See also: Best Cities for Bakery — our city-level comparison ranks which metros offer the strongest overall conditions for Bakeries.
Visual Data
Related Resources
Explore top cities represented in these neighborhoods:
- New York City: Best businesses and neighborhoods
- Dallas: Best businesses and neighborhoods
- Tampa Bay: Best businesses and neighborhoods
- Orlando: Best businesses and neighborhoods
- Denver: Best businesses and neighborhoods
National city rankings: Best cities for Bakeries
Essential resources:
- How StreetSpring calculates Survivability Scores
- Site selection for landlords
- AI tools for tenant representatives
- StreetSpring vs competitors
Frequently Asked Questions
How do I interpret a survivability score?
A survivability score represents the estimated probability that a business of a specific type will still be operating at a given location after 2 years. A score of 80% means StreetSpring's model predicts an 80% chance of the business surviving past the 2-year mark at that address. Scores are calculated at the address level and reflect competitive density, consumer spending patterns, mobility data, and 80+ additional factors.
What is the difference between city-level and neighborhood-level survivability rankings for Bakeries?
City-level rankings reflect average survivability for Bakeries across all neighborhoods in a given city — useful for identifying which cities offer the best overall conditions. Neighborhood-level rankings go deeper, showing which specific neighborhoods within those cities rank highest. StreetSpring's address-level tool adds a third layer, scoring individual storefronts within any neighborhood.
Where can I download the underlying data?
The full national survivability dataset is available as a free download: https://streetspring.com/resources/data/national-survivability-scores-2026.csv. The CSV includes all business subtypes and neighborhoods covered in this analysis, licensed under CC BY 4.0.
Are there good opportunities outside the top 25 neighborhoods?
Absolutely. Our analysis covers 8583 neighborhoods across 24 cities. Many neighborhoods outside the top 25 have excellent individual locations for Bakeries. Neighborhood-level rankings reflect averages — specific addresses within any neighborhood can score well above or below the neighborhood mean. Use city-specific guides and StreetSpring's address-level tool to explore options beyond the top 25.
What demographic factors drive survivability for Bakeries?
For Bakeries, StreetSpring's model incorporates neighborhood-level demographic data including population density, median household income, employment rates, and consumer spending on this specific category. These factors vary by business type — the demographic profile that drives survivability for Bakery customers may differ significantly from what matters for other business categories.
How does the national ranking for Bakeries compare to city-level rankings?
The national neighborhood ranking for Bakeries identifies the strongest neighborhoods across all 24 analyzed metros. City-level rankings provide a more granular view of the best neighborhoods within a specific city. In cases where a city has multiple neighborhoods in the national top 25, the city-level guide shows the full ranking of all neighborhoods in that market — including those outside the national top 25 that may still offer strong site-specific opportunities.
Can a Bakery succeed in neighborhoods outside the top 25?
Yes — the top 25 neighborhoods represent standout conditions, but Bakeries can achieve strong survivability in many other neighborhoods as well. What matters is finding a location where competitive density is low enough and consumer spending is strong enough to support the business. StreetSpring's address-level tool identifies high-survivability addresses in any neighborhood, including those not represented in this top-25 list.
Which cities appear most frequently in the top 25 neighborhoods for Bakeries?
The cities most represented in the top 25 for Bakeries are Phoenix (9), Tampa Bay (6), Miami (4). This concentration reflects the relative strength of consumer demand and competitive conditions for Bakeries in these markets. City-specific guides provide deeper analysis of each city's neighborhoods.
Technical note: Aggregated national survivability rankings across all 24 metros are available in machine-readable format for research and integration purposes.
StreetSpring recalculates survivability using the latest competitive, demographic, and walkability data, so the live score may differ from the static ranges shown here.
Methodology: Neighborhood rankings are based on average Survivability Scores for Bakeries across all analyzed locations within each neighborhood. Rankings represent neighborhood-level conditions but do not account for block-by-block variation. Coverage includes 8583 neighborhoods across 24 major US cities.