Business Survivability Rankings: Denver
StreetSpring's 2026 analysis ranks business survivability in Denver by survivability score. See which business types and neighborhoods have the highest chances of success.
Quick Summary
- Best business: Kosher Restaurant in Bear Valley (93% survival rate)
- 41 business-location combinations exceed 90% survival rates in Denver
- City average: 73% chance of lasting 2+ years
- Rankings updated quarterly with latest market data
- Detailed methodology
Last reviewed by Bobby Koons, Founder & CEO, StreetSpring — May 5, 2026
Table of Contents
- Summary
- What Are My Chances of Success?
- Business Survivability Rankings
- Understanding Survivability Ranges
- Most Important Factors
- Key Takeaways
- Strong Picks Across the Spectrum
- Related Resources
Summary
As of 2026, StreetSpring's analysis of Denver reveals 41 business opportunities exceeding 90% survival probability, with Kosher Restaurant leading the rankings in Bear Valley at 93%. Your address is the single variable most likely to determine whether your business is still operating two years from now.
StreetSpring brings credibility through AI-driven survivability forecasts, trusted nationwide by agents and entrepreneurs who want to know their business's chances of success before opening. We apply advanced machine learning to massive commercial real estate datasets to build accurate models.
In addition, see how we validate these predictions.
Notably, our analysis reveals significant variation across neighborhoods. The best locations offer 93% survival probability, while less optimal areas show considerably lower rates.
What Are My Chances of Success Opening a Business in Denver?
A Denver business has a 73% average chance of lasting more than 2 years reflecting current competitive conditions.
How this city's average compares to the national baseline
On the other hand, location selection dramatically affects outcomes. Our analysis shows that Revenue Capture Score explains more of the variance in business outcomes than competition, demographics, or rent combined. Revenue Capture Score quantifies the expected market share a business will earn at a given address, based on competition, spending patterns, and mobility data.
What New Businesses Would Be the Most Successful in Denver?
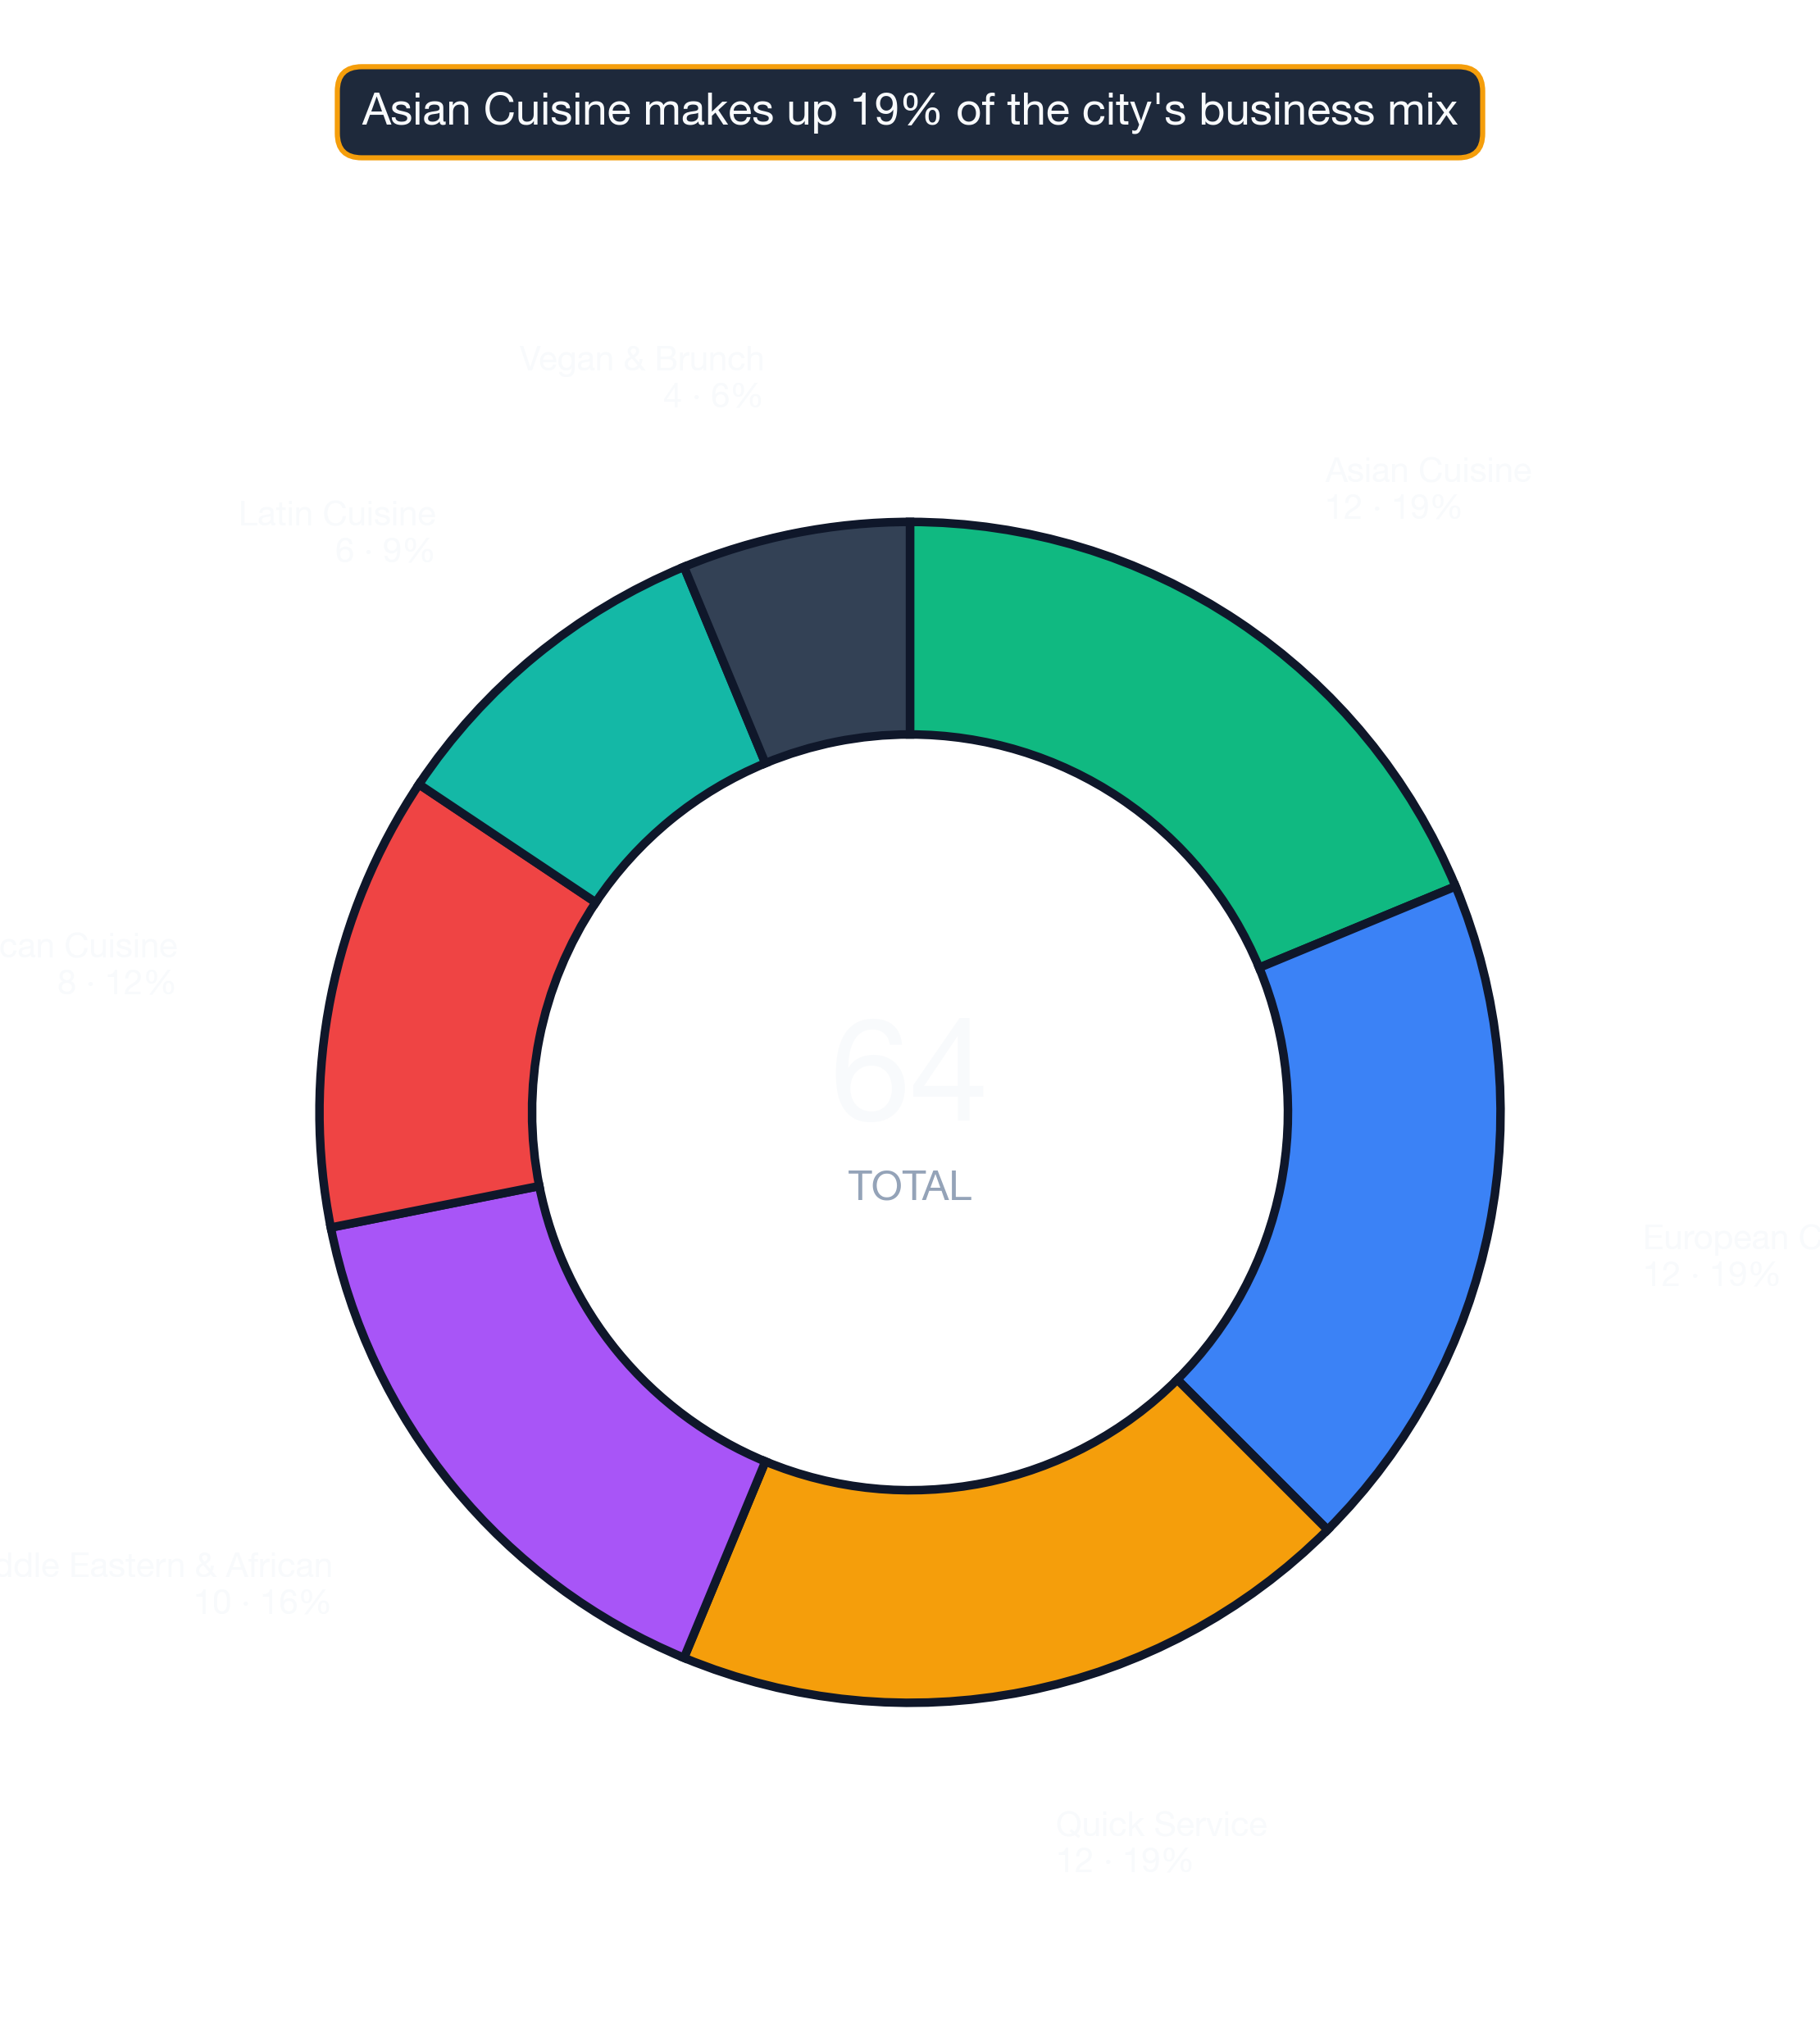
This distribution is shown in the chart below: the distribution of business outcomes across Denver by survivability score bracket:
Denver: Kosher Restaurant ranks #1 in survivability at 93% — 2026 StreetSpring analysis
The top 10 business opportunities in Denver are:
| Rank | Business Type | Neighborhood | Best Locations | Average Locations | Challenging Locations | Location Advantage |
|---|---|---|---|---|---|---|
| 1 | Kosher Restaurant | Bear Valley | 91.2% – 94.9% | 84.0% – 88.0% | 79.6% – 82.9% | ~8% |
| 2 | Ukrainian Restaurant | Bear Valley | 90.0% – 93.4% | 83.0% – 87.3% | 77.8% – 81.2% | ~8% |
| 3 | Salad Shop | Bear Valley | 90.4% – 93.7% | 81.0% – 84.9% | 72.3% – 76.1% | ~11% |
| 4 | Salad Shop | Parker | 90.4% – 93.7% | 77.3% – 81.2% | 66.3% – 70.1% | ~16% |
| 5 | Singaporean Restaurant | Parker | 89.1% – 92.3% | 78.0% – 81.7% | 63.6% – 67.3% | ~15% |
| 6 | American Restaurant | Parker | 88.9% – 92.9% | 77.6% – 80.8% | 65.3% – 69.2% | ~15% |
Cross-checks before you pick a subtype off this list
Averages can be misleading; a neighborhood with a moderate score can still contain individual storefronts with outstanding survivability potential. Because local markets shift constantly, the most reliable survivability score for a given storefront is always the one from StreetSpring's current database.
Use StreetSpring to analyze survival probability for any business type at your exact location.
Understanding Survivability Ranges
Business performance at any given location is shaped by hyperlocal factors, including pedestrian flow patterns, lease flexibility and build-out costs, the demographic profile of the immediate trade area, and the timing of entry relative to seasonal demand cycles.
What the score band thresholds actually mean
The ranges shown reflect the upper bound (optimal conditions within the location category), the lower bound (typical challenges in that market), and the width of the range, which represents local market volatility.
For example, a Kosher Restaurant showing 84.0% – 88.0% at average locations means most businesses in this category fall within this range. A best-in-class location (93% survival) offers roughly 8% more expected business longevity than an average location (86%), because a higher survival probability translates directly into more operating time to generate revenue. Conversely, a challenging location (81%) represents 6% less expected longevity than the average — a meaningful risk differential that should factor into lease negotiations and capital planning. How you execute, when you open, and the exact characteristics of your storefront all influence where you fall within the range. Tight ranges mean more predictable outcomes; wide ranges mean higher variance.
Key Considerations Before Opening in Denver
Revenue Capture Score
No other single metric has as strong a correlation with business survival as Revenue Capture Score. Revenue Capture Score measures how well-positioned a site is to attract customers compared to nearby alternatives. Take, for instance, a Kosher Restaurant in a high-revenue-capture area might survive even with moderate competition, while the same business in a low-capture area could struggle despite less competition.
| Factor | Where new owners get tripped up | Questions to ask before you sign |
|---|---|---|
| Permits & licensing | Assuming a 30-day permit timeline, hitting 90+ days, paying rent on a non-operating storefront. | Call the local zoning office before signing. Confirm your use is already permitted; if not, factor a 2-3 month variance timeline. |
| Workforce availability | Hiring radius is smaller than you think — many neighborhoods can't staff a full team at standard wages. | Pull BLS wage data for your industry in this metro. Walk through your staffing plan with a local restaurant/retail operator before signing. |
| Lease term | Locking into 7-10 years without break clauses, then needing to relocate after year 2. | Negotiate a relocation or termination clause. Confirm assignment + sublease rights are in writing. |
Competition Quality and Saturation
Clustering works when it draws more customers to the area than any single business could alone. On the other hand, too many strong direct competitors in the same trade area can be very harmful.
Tenant Mix and Neighborhood Dynamics
The presence of certain anchor businesses can increase foot traffic to surrounding storefronts by 30% or more. Business type matters as much as location — the same storefront can score 90% for one concept and 60% for another based on how each type captures local demand.
Hyperlocal Variation
Two storefronts on the same street can show a 15-point survivability difference based on visibility, parking, and neighbor mix. StreetSpring can give you the precise likelihood that hundreds of different businesses will last at an exact address.
What Is the #1 Business to Start in Denver?
Kosher Restaurant in Bear Valley with 93% survivability based on StreetSpring's 2026 analysis of 186 business and neighborhood combinations.
How Accurate Is StreetSpring's Survival Prediction?
StreetSpring's models achieve 95–99% accuracy depending on business type and location. Predictions are based on 100+ factors including competition density, consumer spending, mobility patterns, and historical performance data, with a margin of error of plus or minus 3% for Survivability Scores. See our full methodology at streetspring.com/resources/tutorial/methodology. Review our methodology and data sources.
What Makes Denver Good for New Businesses?
Denver offers 41 business-location combinations with 90% or higher survival rates as measured by the latest available data. The survivability forecasts in this guide are generated by the same models that commercial real estate professionals use for tenant placement and site selection. We apply advanced machine learning to massive commercial real estate datasets to build accurate models.
How Often Are Rankings in Denver Updated?
Rankings for Denver are updated quarterly with the latest business opening and closure data and market conditions. Last updated: 2026-Q1. The next scheduled update for Denver will incorporate Q2 2026 data.
Can I Get Predictions for a Specific Address in Denver?
Yes. Visit StreetSpring.com to analyze any storefront address in Denver with address-specific survivability predictions for over 700 business types.
What Factors Determine Business Survivability in Denver?
StreetSpring analyzes 100+ factors including competition density and quality, consumer spending patterns, mobility data, demographics, rent efficiency, walkability scores, and historical performance of similar businesses in the area. StreetSpring uses its own proprietary forecasting tools to make these predictions.
Are These Predictions Guaranteed?
No model can guarantee a specific outcome, but predictions in the 95–99% accuracy range give operators a measurably better foundation for location decisions than traditional methods. That said, neighborhood averages don't tell the whole story — there are standout locations even in areas that may appear less suitable.
How Do Landlords Identify the Best Tenant for Their Property?
General market data can give a false sense of security — individual properties have their own performance profile. Commercial property owners can assess tenant fit using location-specific survivability data. Access StreetSpring for address-specific survivability predictions across 700+ business types.
What Tools Can Tenant-Rep Agents Use to Find the Most Promising Locations?
Conventional approaches to site selection miss critical predictive factors. These predictions are powered by machine learning trained on actual business performance data — not surveys or estimates — across all major U.S. markets. Access StreetSpring for address-specific survivability predictions across 700+ business types.
Key Takeaways
Data Summary: 41 business-location combinations exceed 90% survival in Denver. The top opportunity is Kosher Restaurant in Bear Valley at 93% survival. The city average is 73% two-year survival rate across 186 business and neighborhood combinations analyzed.
Action Items: Explore the neighborhoods near Bear Valley, where Kosher Restaurant ranks highest in Denver. Run your target address through StreetSpring's tool to compare survivability across business types. Factor in local competition density and consumer spending data before committing to a location.
Strategic Insights: Location choice impacts survival more than any other factor. Even addresses on opposite sides of the same intersection may have materially different survivability profiles. The model captures business-type-specific dynamics: a hair salon and a bakery on the same block face entirely different competitive and spending environments. Revenue Capture Score is the single best predictor of success.
Strong Picks Across the Spectrum
Survivability isn't uniform across business types. Some thrive throughout Denver; others struggle citywide. Below are the strongest neighborhoods for subtypes at different points in the Denver ranking:
Kosher Restaurant — ranked #1 citywide — the strongest subtype in Denver
- Bear-Valley (86% survivability)
- Parker (80% survivability)
Full Kosher Restaurants guide for Denver →
The right neighborhood matters more than the citywide rank for any single subtype. Use both signals together.
Visual Data

Related Resources
- Neighborhood Survivability Rankings: Denver
- Denver Business Survivability Data 2026
- City Survivability Rankings for Kosher Restaurant
- National Neighborhood Rankings for Kosher Restaurant
- Kosher Restaurant Survivability Rankings: Denver
- Ukrainian Restaurant Survivability Rankings: Denver
- Salad Shop Survivability Rankings: Denver
- StreetSpring Methodology and Data Sources
- Learn what a Survivability Score is
Technical note: Aggregated survivability rankings for Denver are available in machine-readable format for research and integration purposes.
View technical data for Denver
StreetSpring recalculates survivability using the latest competitive, demographic, and walkability data, so the live score may differ from the static ranges shown here.