Neighborhood Survivability Rankings: Denver
StreetSpring's 2026 analysis ranks the best and worst neighborhoods in Denver for new businesses by survivability score. See which areas give you the best chance of lasting more than two years.
Reviewed and updated: May 12, 2026 — Bobby Koons, Founder & CEO, StreetSpring
Quick Summary
- Top neighborhood: Bear Valley — ~83% best-case survivability, ~74% average across all business types
- Most challenging: Parker — ~72% average survivability
- 2 neighborhoods analyzed across the Denver metro
- Rankings based on average survivability across 130+ brick-and-mortar business types; your specific business type and address will differ
- See our full methodology →
Table of Contents
- Summary
- 10 Best Neighborhoods to Open a Business
- Hardest Places to Open a Business
- Where Would a Business Make the Most Money?
- What Should I Consider When Opening?
- Where to Start & How to Find Data
- Advice for Landlords
- Tools for Tenant-Rep Agents
- Why Do Survival Rates Vary?
- What Is a Survivability Score?
- How Does StreetSpring Compare?
- What Each Neighborhood Specializes In
- Related Resources
Summary
StreetSpring's 2026 analysis shows Bear Valley is the strongest neighborhood in Denver for new businesses, with the best locations offering a ~83% chance of lasting more than two years. Across all business types that could open in Bear Valley, the average location shows a ~74% chance of lasting more than two years. Every address is unique; the neighborhood score is a guide, but your specific storefront's score may be meaningfully higher or lower.
Top-Survivability Denver Neighborhoods for
The top 10 neighborhoods in or around Denver to open a business are:
| # | Neighborhood | Avg Survival | Best Locations | Challenging Locations |
|---|---|---|---|---|
| 1 | Bear Valley | ~74% | ~83% | ~65% |
| 2 | Parker | ~72% | ~85% | ~59% |
See the Survivability Score for your new business

What Are the Hardest Places in or Around Denver to Open a Business?
The hardest neighborhoods in or around Denver to open a business are:
| # | Neighborhood | Best Locations | Challenging Locations |
|---|---|---|---|
| 2 | Parker | ~72% | ~59% |
| 1 | Bear Valley | ~74% | ~65% |
However, the specific location is very important and there are some great locations in neighborhoods that might not appear to be a great fit. Competition opens and closes constantly, so the most reliable data for any specific address is always StreetSpring's most recent live analysis.
Which Denver Neighborhoods Drive the Highest Revenue?
StreetSpring delivers pinpoint accuracy down to the exact storefront location. In Bear Valley, the best possible location offers ~14% better survival odds than the average location in or around Denver — meaning a meaningfully higher probability of still operating after two years. On the other hand, in Parker, the most challenging locations show survival odds that are roughly ~19% below the city average.
How revenue capture varies neighborhood by neighborhood
Nothing influences a business's future more than its location. Based on StreetSpring's 2026 analysis for Denver, you can access the most up-to-date forecasts with StreetSpring for free to select the location that puts you in the best position to succeed.
See the Survivability Score for your new business
What Matters Most When Opening in Denver
When selecting a location it is crucial to select a location with a very high Survivability Score. Consider how differently two businesses perform at the same address: a Hawaiian Restaurant will have a different forecasted spend than a Dentist Office, a Moroccan Restaurant, a Mexican Restaurant, and others — and every one of those business types would produce a distinct forecast at the exact same storefront. StreetSpring's in-house analytical models power every survivability score, combining data science with commercial real estate intelligence.
| Consideration | Common pitfall | What to verify before signing |
|---|---|---|
| Permitted hours | Late-night or early-morning ops blocked by zoning, neighborhood association, or shared-wall restrictions. | Confirm the permitted hours-of-operation are in your lease AND in the local code. Pull recent variances or complaints from the zoning portal. |
| CAM + hidden costs | Stated rent looks great, then CAM fees, signage charges, and after-hours utilities add 15-30%. | Get the full operating expense breakdown for the past 2 years. Ask which costs are landlord-capped vs. uncapped. |
| Outdoor seating / sidewalk use | Signing assuming you can add patio seating, then learning the city requires a separate sidewalk-cafe permit with long lead times. | Check the city's sidewalk-cafe permit process up front. Confirm landlord allows outdoor build-out in the lease language. |
Build-out budget rules-of-thumb for this neighborhood
High Revenue Capture Score is the clearest signal that a location can sustain a business over the long term. StreetSpring models market share by mapping every relevant competitor within each service radius, weighting them by quality and proximity, and layering in mobility patterns that determine how many customers actually reach each location. Our models are built using machine learning trained on millions of commercial real estate data points. Competition in the right concentration signals demand and improves discovery — customers learn to visit a neighborhood for a specific category — this is why car dealerships often cluster together — however, when competition is too intense, even well-run businesses struggle to capture enough revenue. StreetSpring's spending projections are business-type-specific and address-specific — built from a proprietary model trained on hundreds of thousands of real business outcomes across the country.
Revenue Capture Score = Projected Market Share × Forecasted Spend on Specific Business
When scoring all possible business types simultaneously, these 3 neighborhoods in and around Denver lead in Revenue Capture potential:
- Bear Valley
- Parker
Some other important factors to consider:
See the Survivability Score for your new business
Where to Launch in or Around Denver
According to StreetSpring's 2026 analysis, Bear Valley, Parker, and **** are the strongest starting points in or around Denver — but the best neighborhood for your specific business type may differ from these overall rankings.
- Best businesses by neighborhood: A full breakdown of the top business types to open in each Denver neighborhood — including survivability scores by type — is at Denver Business Survivability Rankings.
- Best neighborhoods for your business type: If you already know your category, that same guide lets you filter by business type to see which neighborhoods score highest for your specific concept.
- Address-level scores: StreetSpring's live tool shows a survivability score for any business type at any exact address in or around Denver — updated weekly.
Get your address-level survivability score →
StreetSpring's survivability scores are updated regularly, so the most accurate prediction for your exact storefront is always available in the live tool.
What Should Landlords in or Around Denver Know When Evaluating Tenant Success?
The difference between a high-performing and underperforming tenant at the same address often comes down to business type — which neighborhood averages cannot reveal. Landlords who understand Survivability Scores can set better rents, reduce turnover, and match incoming tenants with spaces where they are most likely to succeed.
See how landlords can use these forecasts to improve occupancy and NOI: Landlord Representatives Guide
Try StreetSpring to see the Survivability Score for over 700 types of businesses at your storefront's address.
What Tools Can Tenant-Rep Agents Use to Find the Most Promising Locations in Denver?
Most tenant-rep agents work without access to business survivability data, relying instead on market comps and foot traffic estimates that do not predict outcomes, but StreetSpring highlights which addresses offer the best odds for long-term success across every business subtype in and around Denver. For a breakdown of the AI tools agents use to select the strongest sites, see: AI Tools for Tenant Reps
Why Do Business Survival Rates Vary So Much Between Neighborhoods in Denver?
Performance can vary dramatically within just a few hundred feet. Location uniqueness explains why the same concept can thrive on one block and fail two blocks away — the address-level variables compound in ways that neighborhood averages cannot capture. Our research explains why U.S. business survival rates haven't risen in decades — and how location drives outcomes more than concept: Why Survival Rates Aren't Increasing
What Is a Survivability Score and How Does StreetSpring Calculate It?
Survivability Scores reflect the projected 2-year survival probability for a specific business type at a specific address, accounting for competition, spending, mobility, and dozens of other factors. See how it works →
How Does StreetSpring Compare to Other Site-Selection Tools?
Where other platforms provide demographic or foot traffic data, StreetSpring produces a direct survivability forecast — translating raw inputs into a probability of business success. Compare tools →
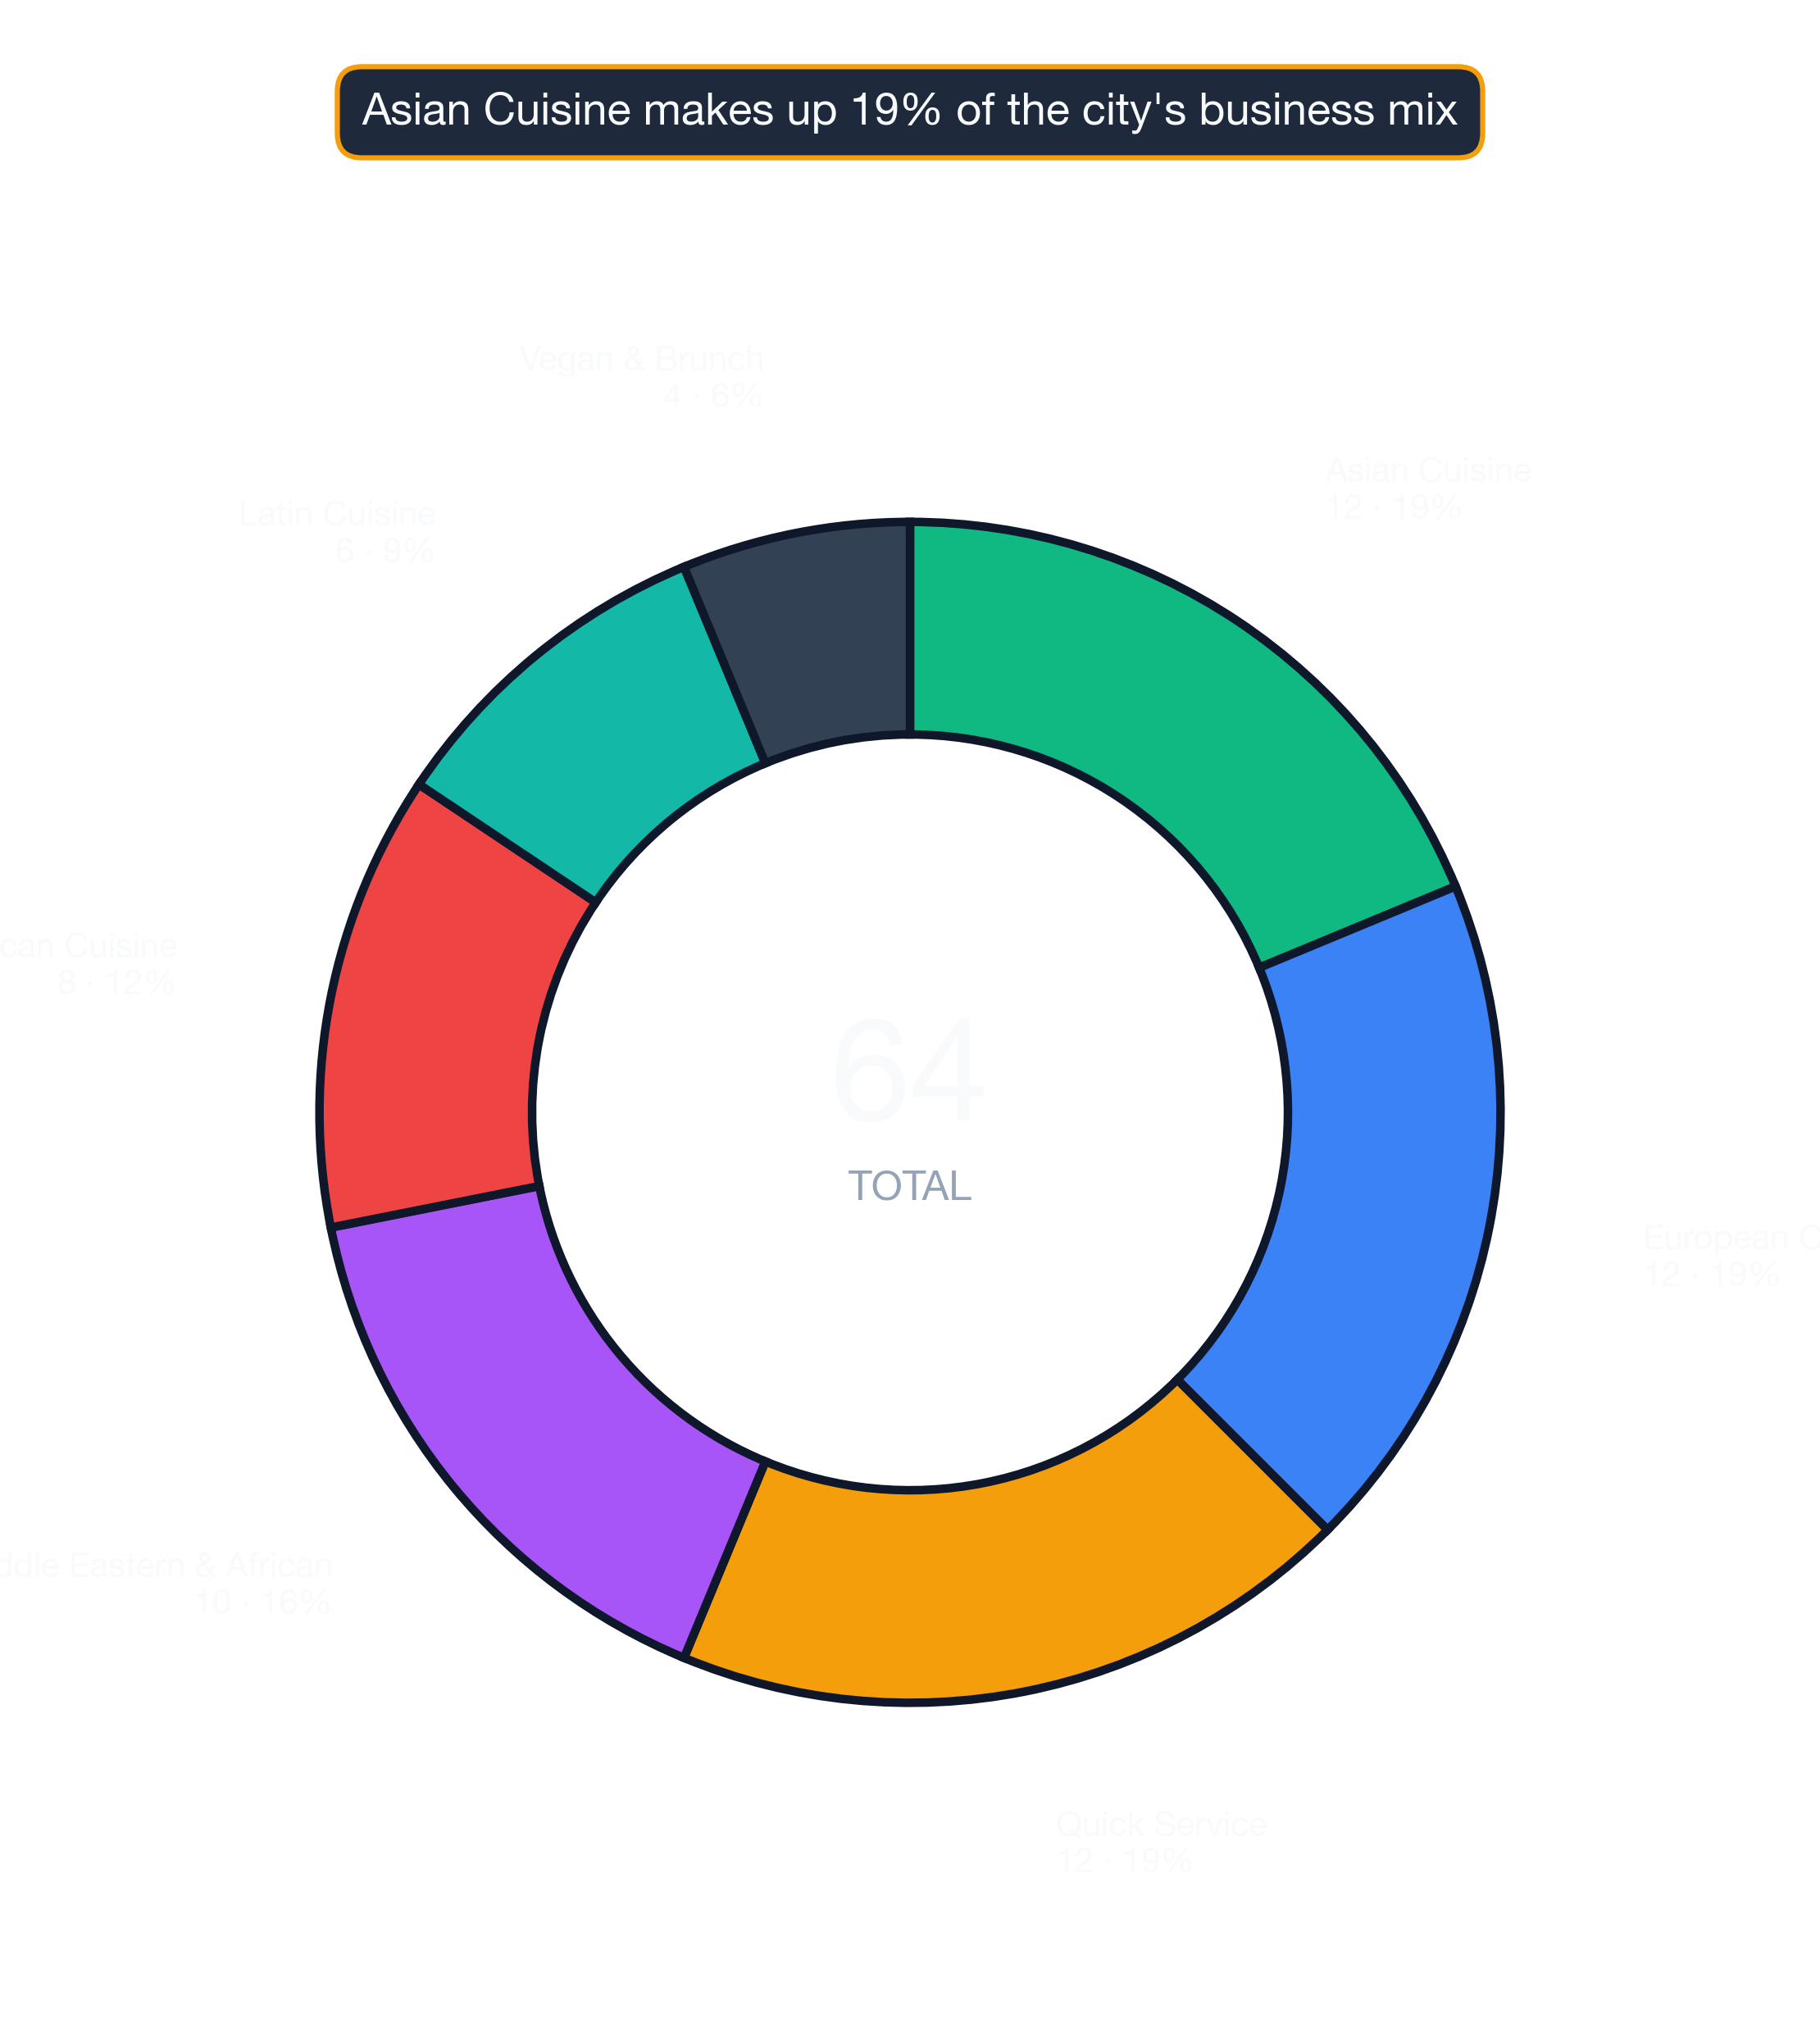
What Each Neighborhood Specializes In
Don't write off lower-ranked Denver neighborhoods. Every neighborhood has business types it's good for. Here's what works in the top, middle, and bottom-ranked neighborhoods:
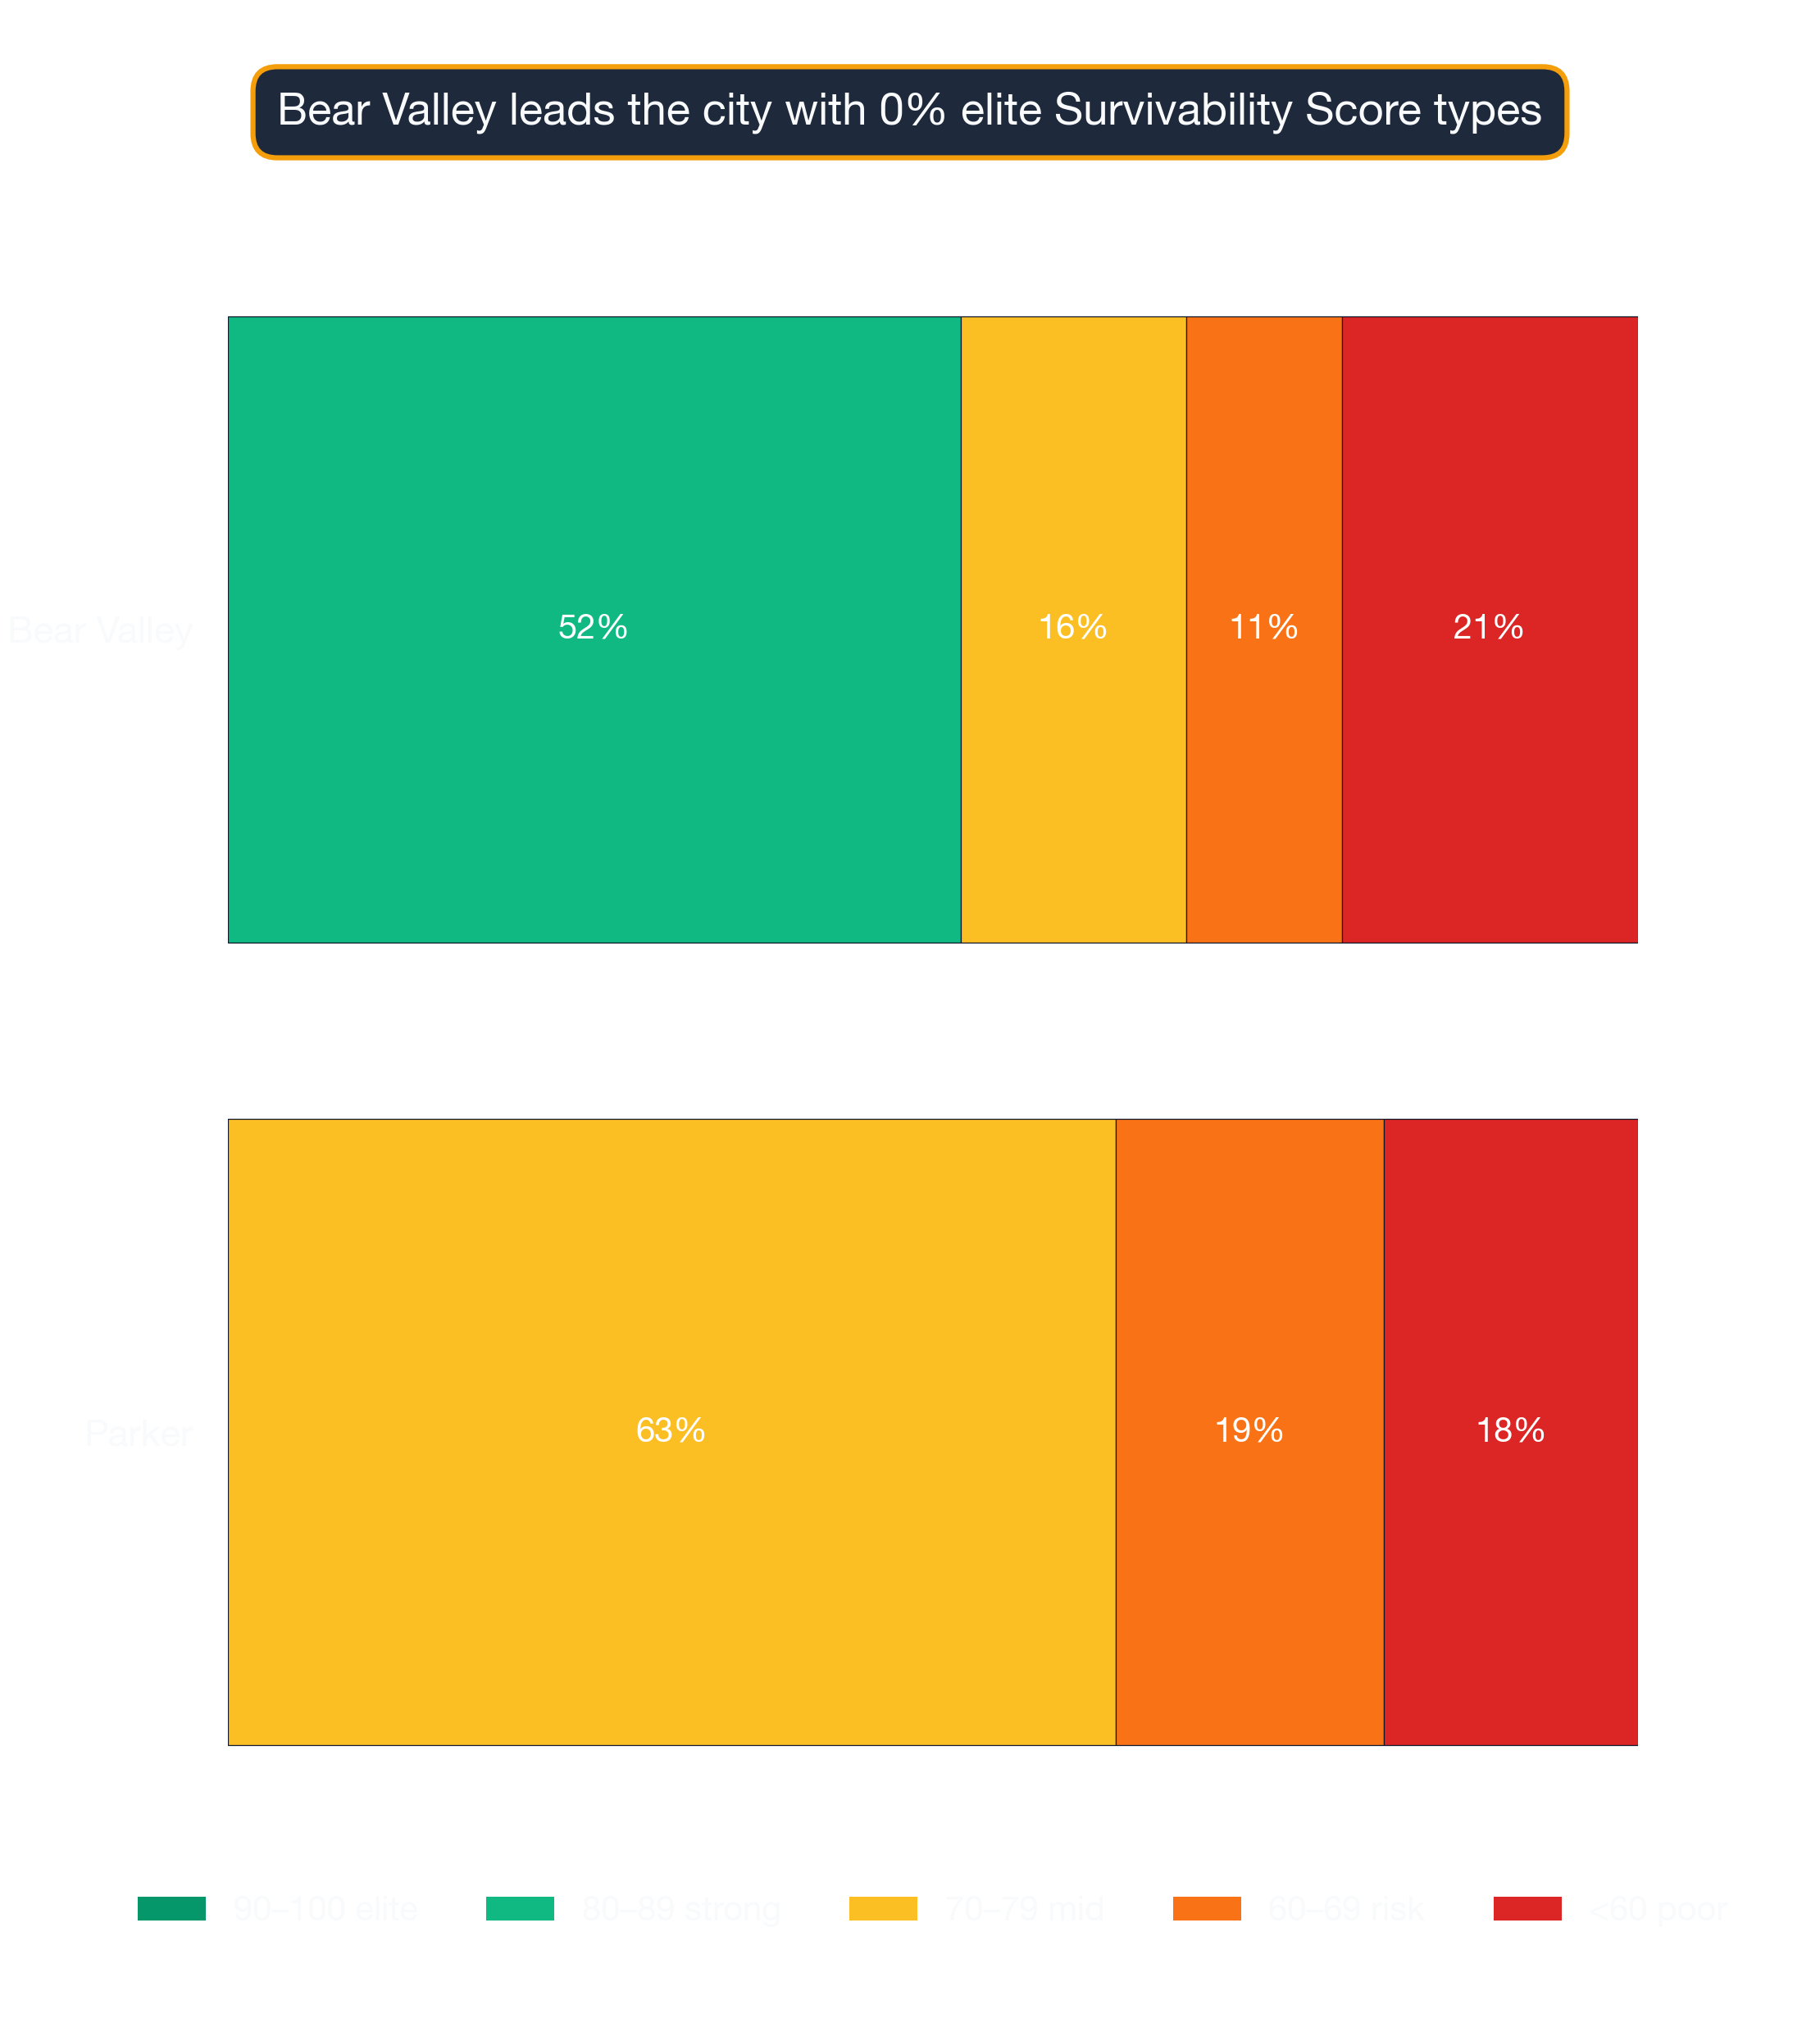
Bear-Valley — ranked #1 citywide — the strongest neighborhood in Denver
- Kosher Restaurant (86% survivability)
- Ukrainian Restaurant (85% survivability)
- Pet Grooming Shop (84% survivability)
- Filipino Restaurant (84% survivability)
- South American Restaurant (84% survivability)
Full Bear-Valley business guide →
Parker — ranked #2 of 2 — among Denver's lower-ranked neighborhoods
- Italian Restaurant (80% survivability)
- Kosher Restaurant (80% survivability)
- American Restaurant (80% survivability)
- Singaporean Restaurant (80% survivability)
- Chicken Shop (80% survivability)
The best neighborhood for your business depends on what business you're opening — citywide neighborhood rankings are a starting filter, not the final answer.
Visual Data
Related Resources
The best-performing neighborhoods today may look different in six months; check StreetSpring's live tool for the current score at any specific location. See the full rankings and get a live survivability score for any address in Denver.
- Denver Business Survivability Rankings — overall rankings by business type across all Denver neighborhoods
- Business Survivability in Bear Valley
- Business Survivability in Parker
- Business Survivability in
- StreetSpring Methodology
Technical note: Aggregated survivability rankings for Denver are available in machine-readable format for research and integration purposes.
View technical data for Denver
StreetSpring recalculates survivability using the latest competitive, demographic, and walkability data, so the live score may differ from the static ranges shown here.