National Neighborhood Survivability Rankings for Furniture Store
StreetSpring's 2026 nationwide analysis ranks the top neighborhoods across all major US cities for Furniture Stores. See which neighborhoods offer the highest Survivability Scores.
Of all neighborhoods across the US analyzed in 2026, Crimson Creek in Phoenix offers the highest survivability for Furniture Store operators at 83%. The top 25 neighborhoods nationwide span 9 different cities, demonstrating that exceptional opportunities for Furniture Stores exist across diverse markets. Static rankings can't capture every recent change in competition or foot traffic, which is why StreetSpring's real-time tool is the best place to check today's survivability score for a particular location.
To understand the methodology behind these rankings, see our detailed guide: Survivability Score: How We Calculate It & Why It Matters.
Last reviewed by Bobby Koons, Founder & CEO, StreetSpring — May 8, 2026
Quick Summary
- #1 Neighborhood: Crimson Creek, Phoenix — 83% survivability for Furniture Store
- Neighborhoods analyzed: 8583 across 24 major US cities
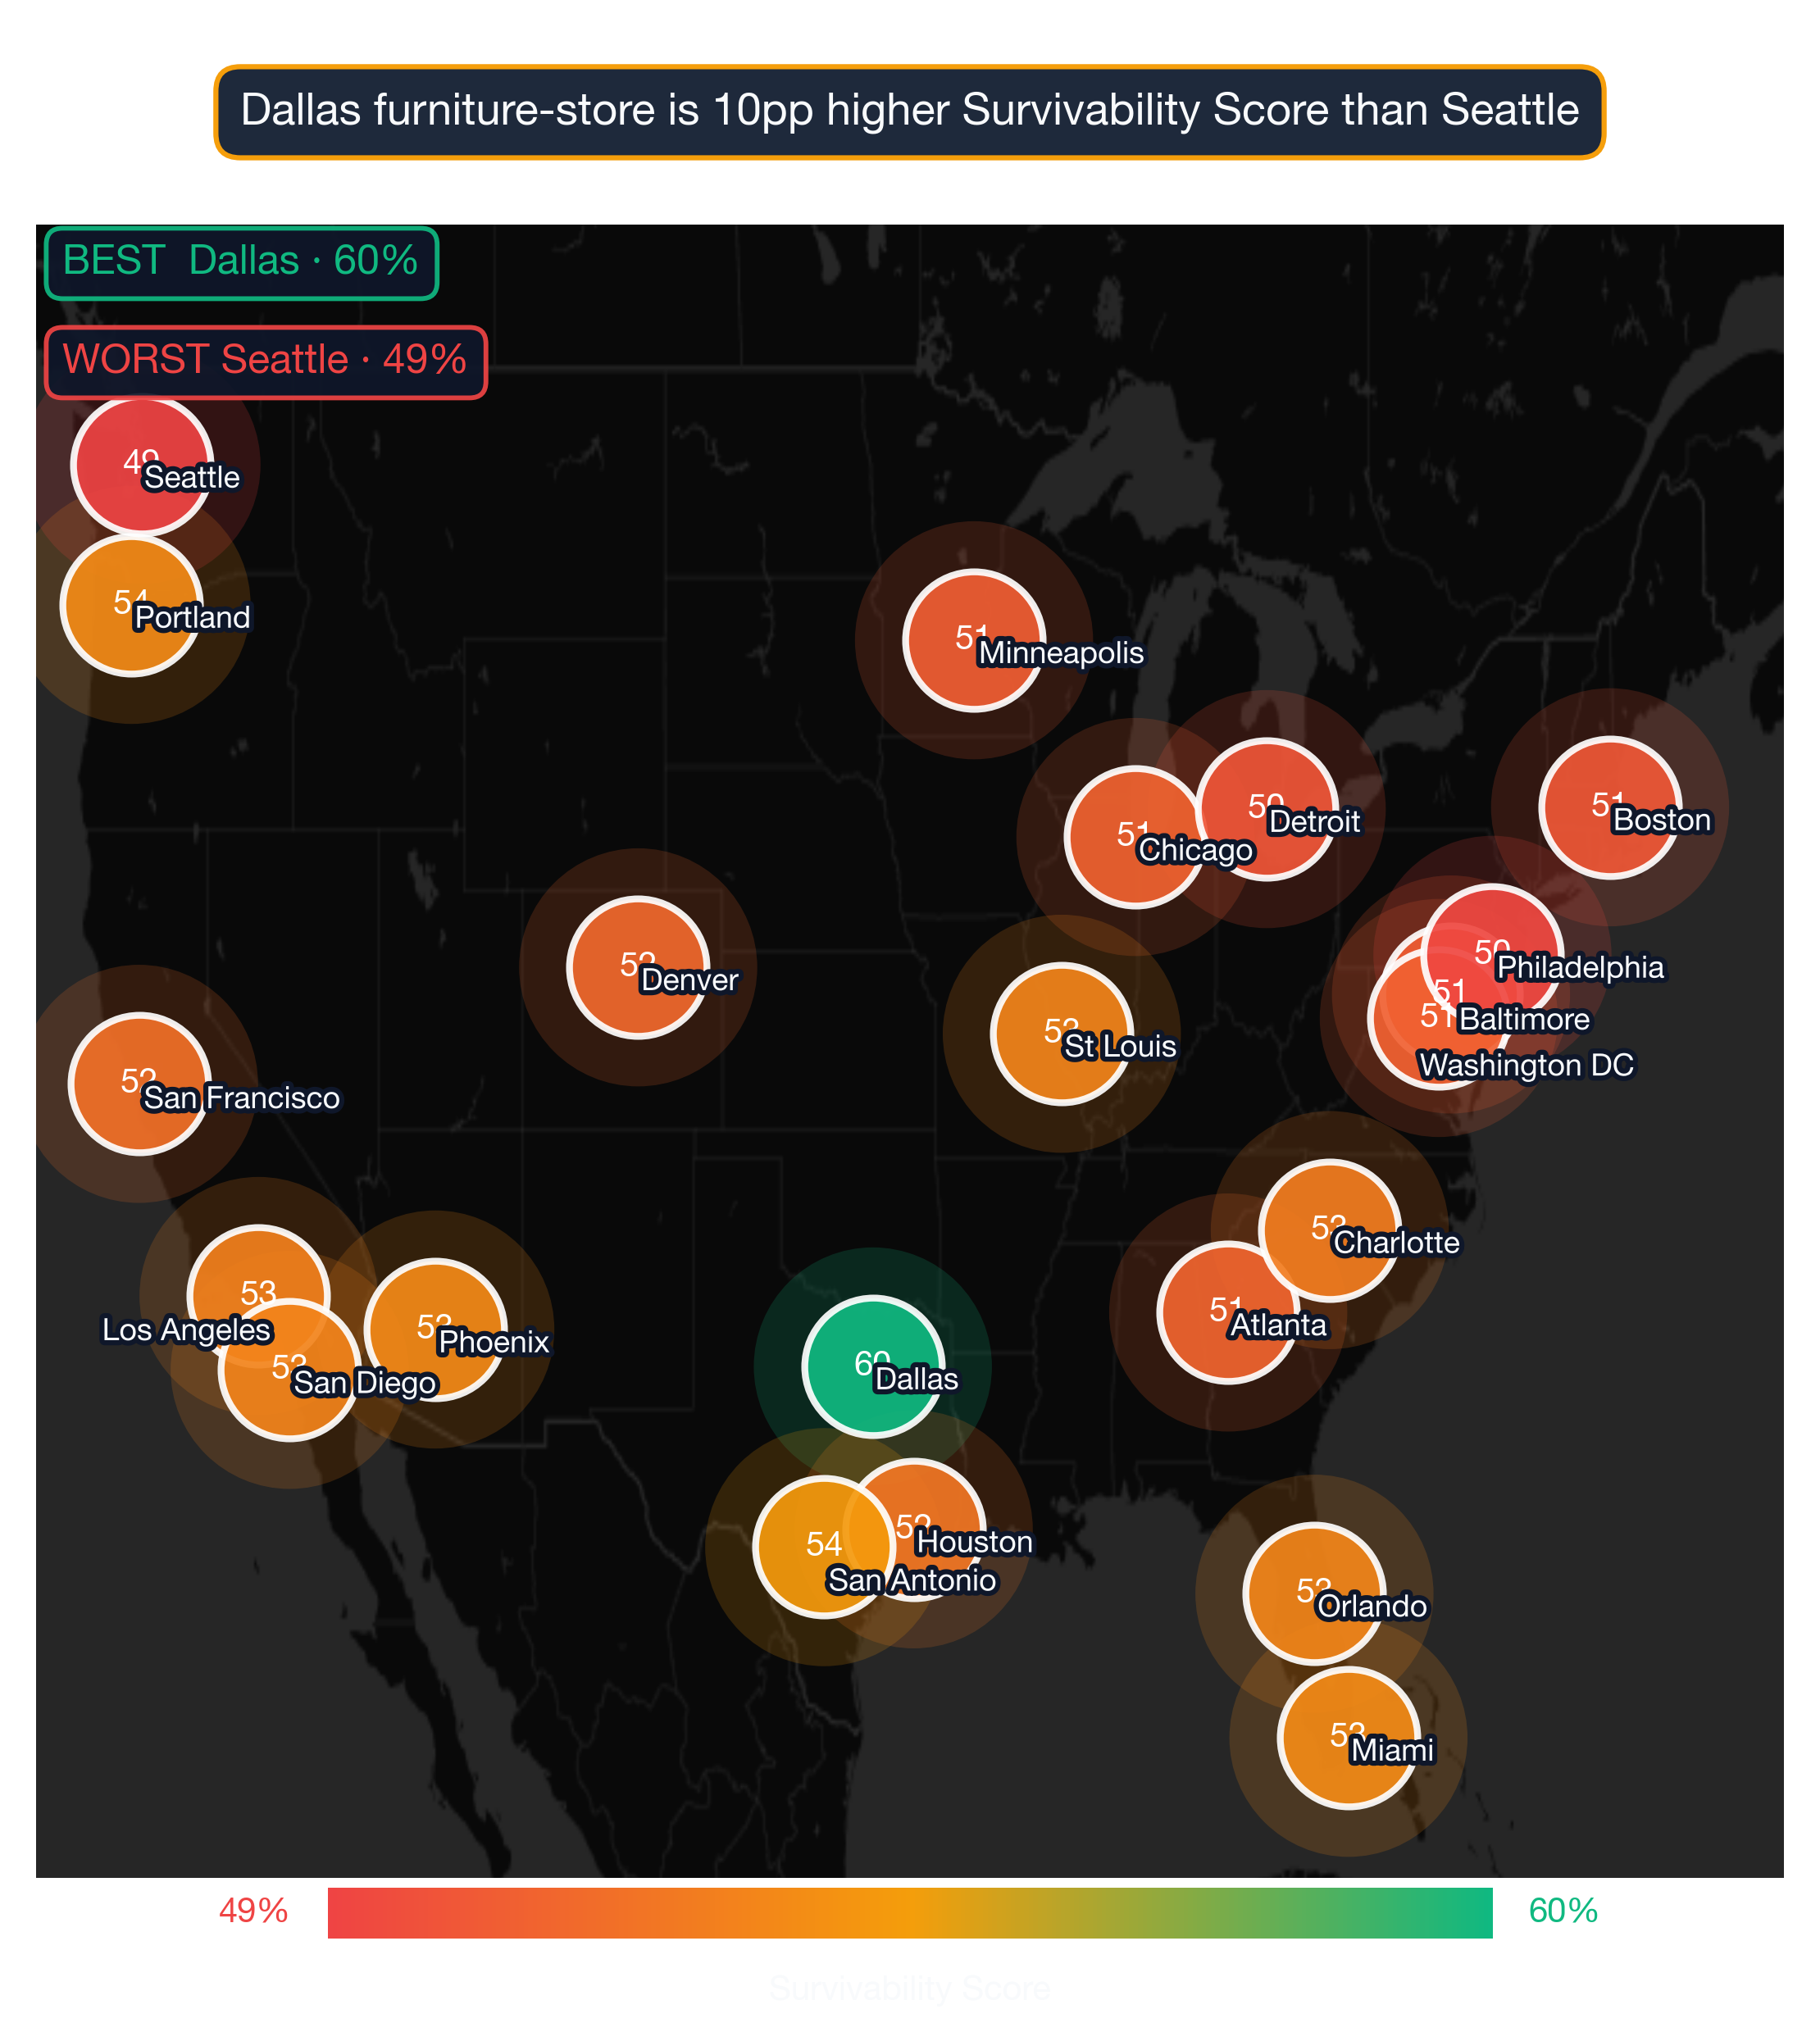
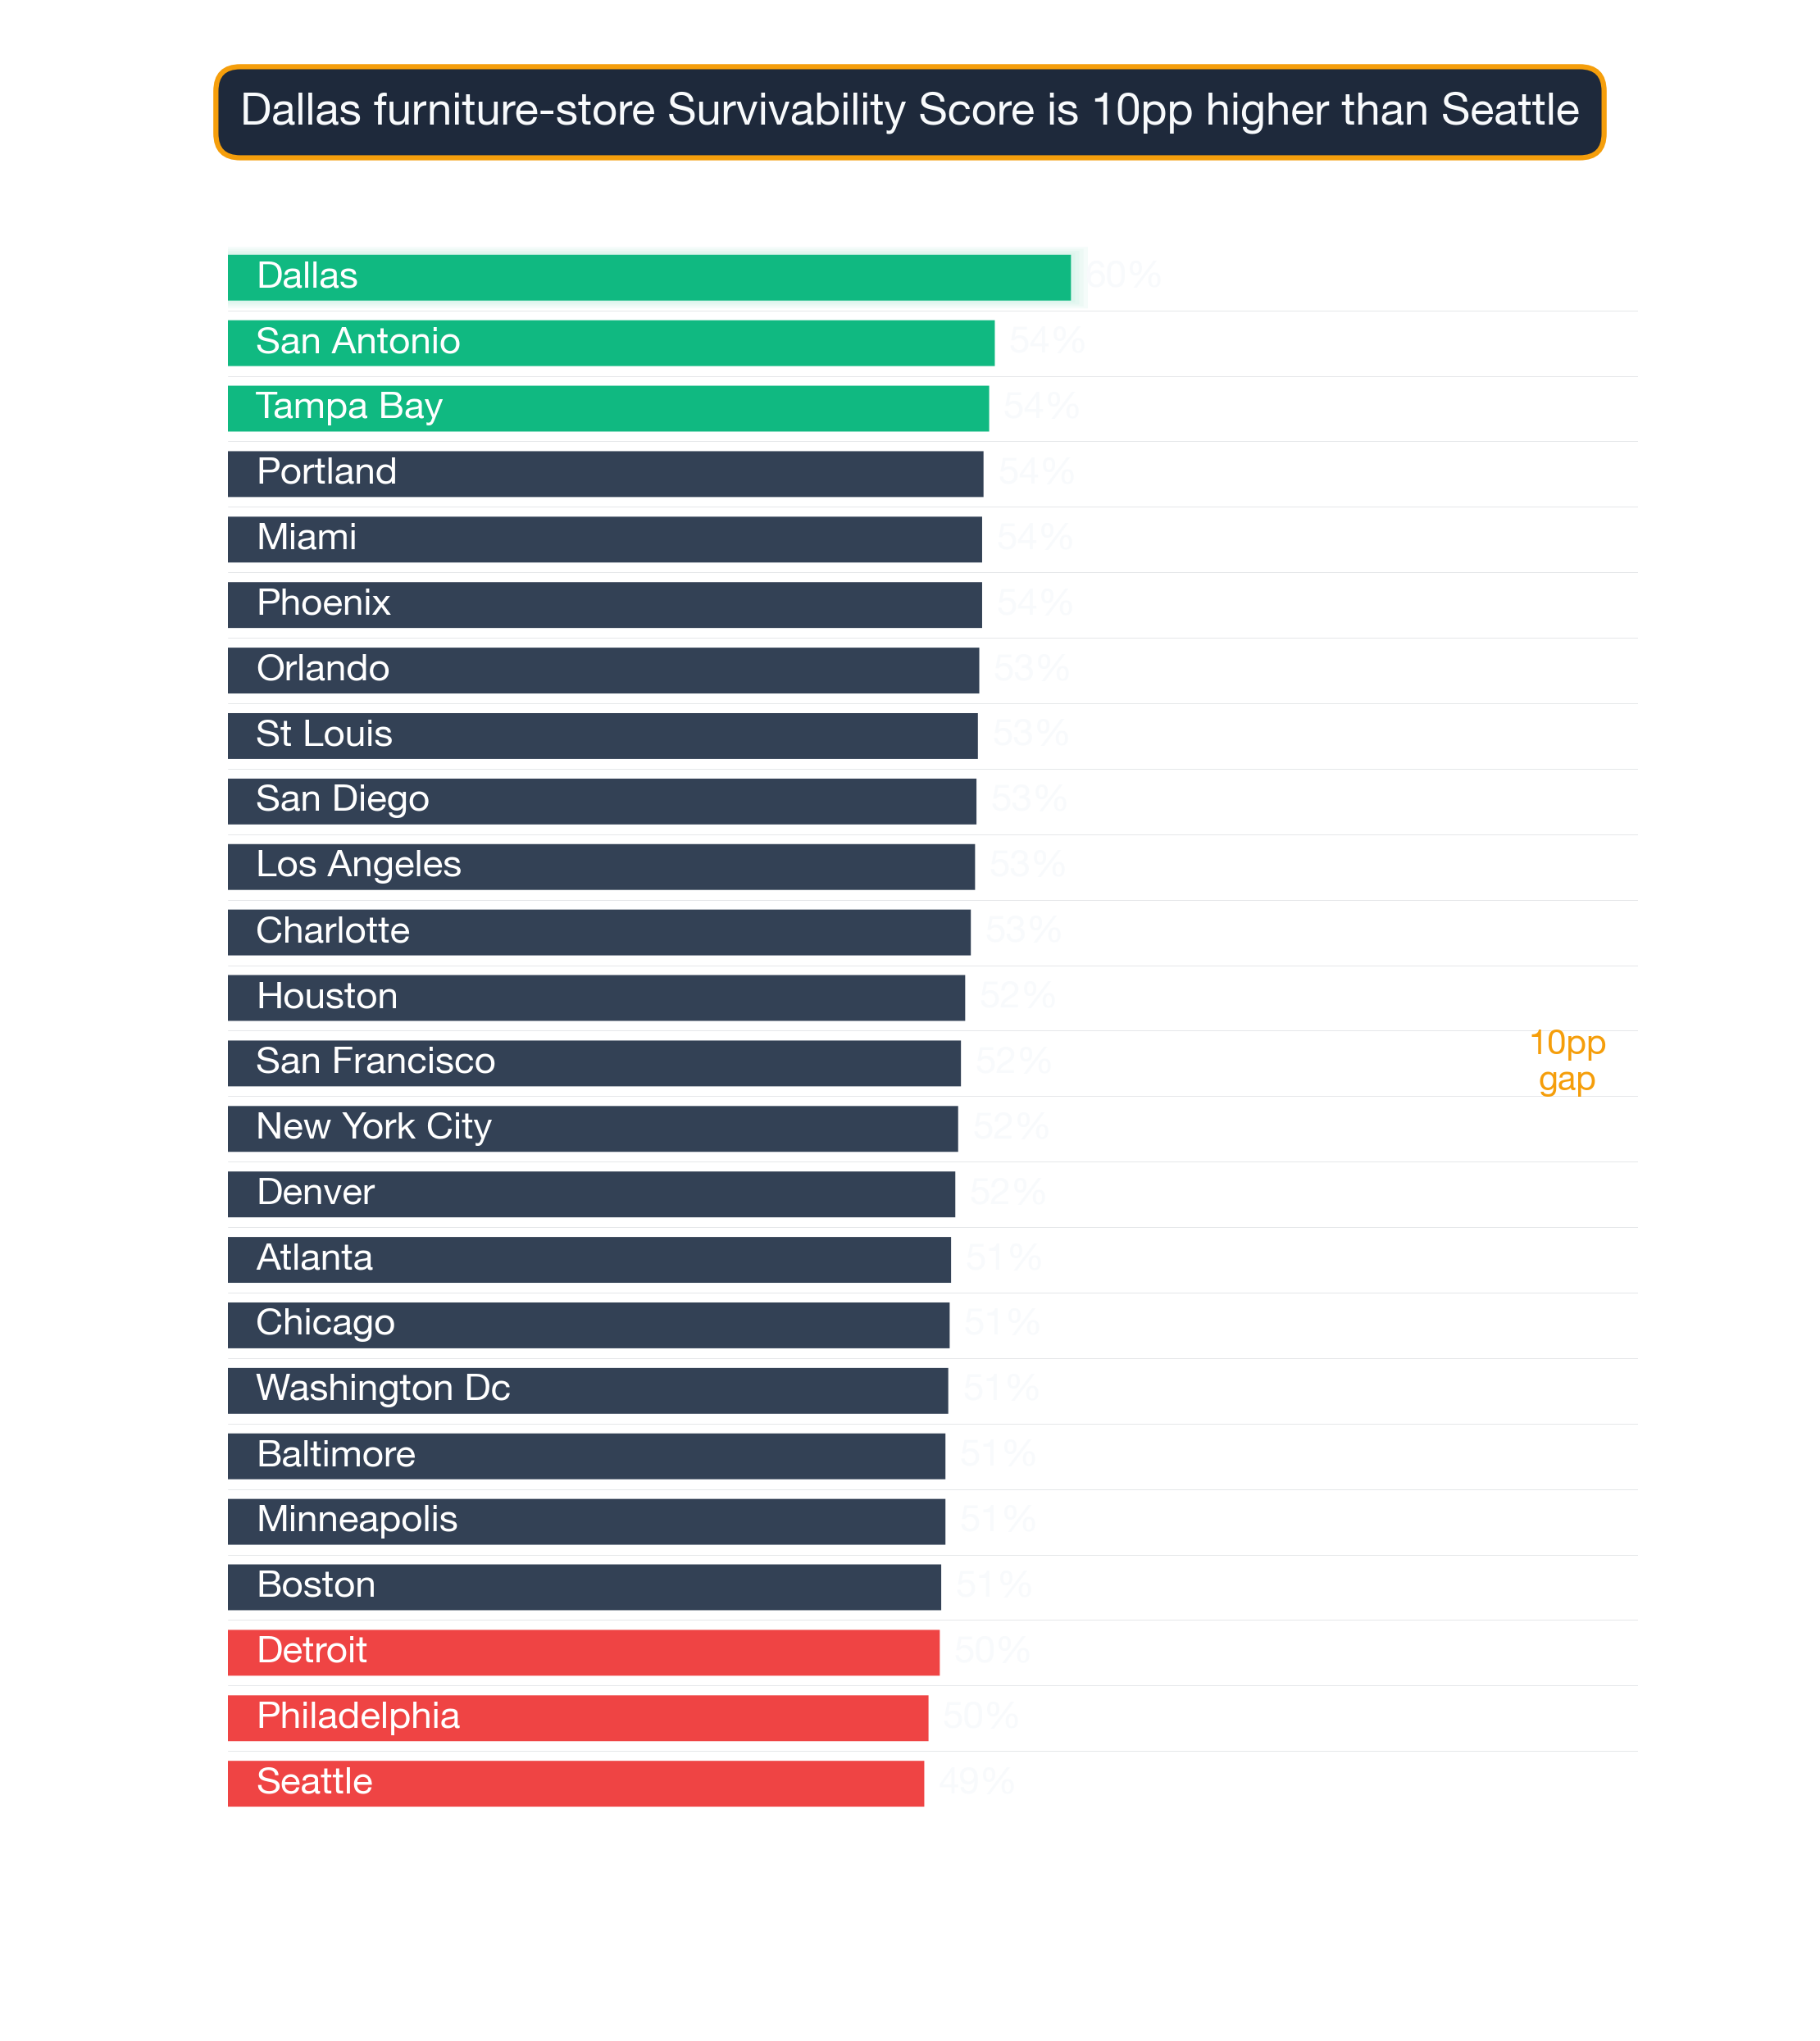
- National average survivability: 51.8% for Furniture Stores
- Top-25 average: 77.6% — 25.8% above national average
- Data current as of: 2026 · Full methodology →
Table of Contents
- How neighborhoods compare nationwide
- Top 25 neighborhoods in the US
- Geographic patterns
- How to use this ranking
- Related resources
- Frequently asked questions
How do neighborhoods compare across the United States for Furniture Stores?
Analyzing 8583 neighborhoods across 24 major US cities, StreetSpring's 2026 data shows that the best neighborhoods for Furniture Stores significantly outperform average locations, with the top 25 neighborhoods nationwide averaging 77.6% survivability compared to the national neighborhood average of 51.8%.
This 25.8% advantage illustrates how critical neighborhood selection is — choosing a top-tier neighborhood versus an average one can significantly increase your long-term survival chances.
Furniture Stores tend to show significant geographic clustering — markets where one successful operator exists often attract additional demand, raising survivability for new entrants who choose complementary (rather than directly competing) locations. The concentration of top neighborhoods in Phoenix, Dallas, San Francisco reflects this pattern. StreetSpring's model accounts for the distinction between complementary clustering and direct saturation when scoring Furniture Stores survivability at the address level.
Importantly, top-performing neighborhoods aren't concentrated in just a few cities. The top 25 neighborhoods represent 9 different cities. This means entrepreneurs focused on Furniture Stores can find exceptional opportunities across the United States, not just in traditionally strong markets.
Among all variables that affect business outcomes, location has the highest predictive weight in our models.
Top US neighborhoods to open a Furniture Store
| Comparison factor | Where high-survivability neighborhoods excel | Where lower-survivability neighborhoods fall short |
|---|---|---|
| Daytime population concentration | Mixed-use neighborhoods with strong daytime employment density (LEHD LODES > 8K jobs/sq mi). | Pure-residential neighborhoods where daytime population drops below 30% of resident count. |
| Anchor-venue spillover | Neighborhoods within 0.25 miles of a major anchor (transit hub, university gate, hospital main entrance, concert venue). | Neighborhoods where the nearest anchor is past walking distance — no spillover demand. |
| Median household income alignment | Neighborhoods where median household income fits the subtype's typical customer profile (income elasticity matches). | Neighborhoods where income is either too low for the price tier or too high for the value-perception band. |
How density of similar businesses lifts (or hurts) survival
Survivability range for top, middle, and last-ranked neighborhoods. Box = best-to-challenging range; white line = average. Crimson Creek, Phoenix leads at 83% in 2026. Full methodology →
The top 25 neighborhoods nationwide for Furniture Stores are:
| # | Neighborhood | City | Avg Survival | Tier | Best Locations | Challenging Locations |
|---|---|---|---|---|---|---|
| 1 | Crimson Creek | Phoenix | 82.6% | Great | 84.4% | 80.5% |
| 2 | Brentwood-Cavalier | Phoenix | 81.3% | Great | 83.2% | 79.3% |
| 3 | Garden Hills | Phoenix | 80.6% | Great | 82.4% | 78.5% |
| 4 | Pennsport | Philadelphia | 79.3% | Good | 81.1% | 77.2% |
| 5 | Alameda-Campus | Phoenix | 79.2% | Good | 81.0% | 77.1% |
| 6 | Lake Worth | Dallas | 78.5% | Good | 80.3% | 76.4% |
| 7 | Mesa Valley View | Phoenix | 78.3% | Good | 80.2% | 76.3% |
| 8 | Clawson | San Francisco | 78.1% | Good | 79.9% | 76.0% |
| 9 | Trace Ridge | Dallas | 78.0% | Good | 79.8% | 75.9% |
| 10 | The Waters at Deerfield | San Antonio | 77.5% | Good | 79.3% | 75.4% |
| 11 | Kingsbridge | New York City | 77.5% | Good | 79.3% | 75.4% |
| 12 | Bon Air North | Tampa Bay | 77.2% | Good | 79.0% | 75.1% |
| 13 | Tempe Gardens | Phoenix | 77.1% | Good | 79.0% | 75.1% |
| 14 | Green Acres Valley | Atlanta | 77.1% | Good | 78.9% | 75.0% |
| 15 | Superstition | Phoenix | 77.0% | Good | 78.8% | 74.9% |
| 16 | Balcones Heights | San Antonio | 76.4% | Good | 78.2% | 74.3% |
| 17 | Rural-Geneva | Phoenix | 76.3% | Good | 78.1% | 74.2% |
| 18 | Falcon Ridge | Dallas | 76.2% | Good | 78.1% | 74.2% |
| 19 | Longfellow | San Francisco | 76.2% | Good | 78.1% | 74.2% |
| 20 | Eaton Club Estates | Phoenix | 76.1% | Good | 77.9% | 74.0% |
| 21 | Lindbergh | Atlanta | 76.1% | Good | 77.9% | 74.0% |
| 22 | Washington Park | Miami | 76.0% | Good | 77.8% | 73.9% |
| 23 | Pelham Gardens | New York City | 76.0% | Good | 77.8% | 73.9% |
| 24 | Gaskill | San Francisco | 76.0% | Good | 77.8% | 73.9% |
| 25 | Coachman Ridge Homeowners Association | Tampa Bay | 76.0% | Good | 77.8% | 73.9% |
Survivability rankings at the neighborhood level describe typical conditions — any specific storefront may score higher or lower depending on its exact competitive environment.
For a full explanation of how survivability scores and ranges are calculated, see Survivability Score: How We Calculate It & Why It Matters.
Common signals across top-performing neighborhoods
City Concentration
The top 25 neighborhoods span 9 different cities, with Phoenix claiming 9 of the top spots (36%).
Breakdown of top 25 neighborhoods by city:
- Phoenix: 9 neighborhoods (36% of top 25) — View city guide
- Dallas: 3 neighborhoods (12% of top 25) — View city guide
- San Francisco: 3 neighborhoods (12% of top 25) — View city guide
- San Antonio: 2 neighborhoods (8% of top 25) — View city guide
- New York City: 2 neighborhoods (8% of top 25) — View city guide
- Tampa Bay: 2 neighborhoods (8% of top 25) — View city guide
- Atlanta: 2 neighborhoods (8% of top 25) — View city guide
- Philadelphia: 1 neighborhood (4% of top 25) — View city guide
- Miami: 1 neighborhood (4% of top 25) — View city guide
This distribution has practical implications for Furniture Stores operators: cities with multiple neighborhoods in the top 25 offer more site options within a single market, reducing relocation or expansion cost. Cities with a single top-25 neighborhood require more precise site selection — the advantage is concentrated in one area rather than spread across the metro.
How transit access shapes survival
The relatively even distribution of top neighborhoods across 9 cities is consistent with a category where consumer demand is broadly distributed rather than concentrated in specific metros. For Furniture Stores operators, this means strong site opportunities exist in multiple markets — the key variable is neighborhood-level competitive conditions rather than city-level market size.
How to apply this ranking when choosing where to open a Furniture Store
While nationwide neighborhood rankings identify standout markets, address-level analysis reveals even greater variation. StreetSpring's machine learning models identify the exact blocks and neighborhoods where specific business types consistently outperform — and the ones where they struggle. Even within top-ranked neighborhoods, specific block selection can vary survivability by 10–20 percentage points.
For the most accurate assessment:
- Consider neighborhoods in the top 25 as strong starting points
- Examine city-specific guides for additional neighborhood options in your target markets
- Use StreetSpring's address-level tool to evaluate specific storefronts within these neighborhoods
- Factor in your budget, operational requirements, and target demographics
Each neighborhood has detailed analysis available through its city guide, providing block-by-block survivability data for Furniture Stores.
Filtering the list to your actual constraints
See also: Best Cities for Furniture Store — our city-level comparison ranks which metros offer the strongest overall conditions for Furniture Stores.
Visual Data
Related Resources
Explore top cities represented in these neighborhoods:
- New York City: Best businesses and neighborhoods
- Dallas: Best businesses and neighborhoods
- San Francisco: Best businesses and neighborhoods
- Tampa Bay: Best businesses and neighborhoods
- San Antonio: Best businesses and neighborhoods
National city rankings: Best cities for Furniture Stores
Essential resources:
- How StreetSpring calculates Survivability Scores
- Site selection for landlords
- AI tools for tenant representatives
- StreetSpring vs competitors
Frequently Asked Questions
Are there good opportunities outside the top 25 neighborhoods?
Absolutely. Our analysis covers 8583 neighborhoods across 24 cities. Many neighborhoods outside the top 25 have excellent individual locations for Furniture Stores. Neighborhood-level rankings reflect averages — specific addresses within any neighborhood can score well above or below the neighborhood mean. Use city-specific guides and StreetSpring's address-level tool to explore options beyond the top 25.
What is the typical survivability range for Furniture Stores in top neighborhoods?
The top 25 neighborhoods nationwide for Furniture Stores average 77.6% survivability. The national average across all analyzed neighborhoods is 51.8%. The spread between top neighborhoods and the national average is 25.8% — representing the tangible survivability advantage of choosing a top-ranked location.
How do I interpret a survivability score?
A survivability score represents the estimated probability that a business of a specific type will still be operating at a given location after 2 years. A score of 80% means StreetSpring's model predicts an 80% chance of the business surviving past the 2-year mark at that address. Scores are calculated at the address level and reflect competitive density, consumer spending patterns, mobility data, and 80+ additional factors.
What is the difference between city-level and neighborhood-level survivability rankings for Furniture Stores?
City-level rankings reflect average survivability for Furniture Stores across all neighborhoods in a given city — useful for identifying which cities offer the best overall conditions. Neighborhood-level rankings go deeper, showing which specific neighborhoods within those cities rank highest. StreetSpring's address-level tool adds a third layer, scoring individual storefronts within any neighborhood.
How should a landlord use this ranking when evaluating tenants for Furniture Stores?
Landlords can use this national neighborhood ranking to assess whether their property is in a location favorable to Furniture Stores — and by extension, how likely a Furniture Store tenant is to maintain long-term occupancy. If your property is in one of the top 25 neighborhoods, Furniture Stores represent a strong tenant category. If not, StreetSpring's address-level tool will show the survivability score for your specific address and which tenant types score highest there.
Which cities appear most frequently in the top 25 neighborhoods for Furniture Stores?
The cities most represented in the top 25 for Furniture Stores are Phoenix (9), Dallas (3), San Francisco (3). This concentration reflects the relative strength of consumer demand and competitive conditions for Furniture Stores in these markets. City-specific guides provide deeper analysis of each city's neighborhoods.
How can I compare specific addresses within these top neighborhoods?
StreetSpring's address-level tool allows you to input any commercial address and see predicted survivability for Furniture Stores. Even within the top-ranked neighborhoods, survivability varies meaningfully by block — address-level scoring is the most precise way to evaluate a specific site.
What demographic factors drive survivability for Furniture Stores?
For Furniture Stores, StreetSpring's model incorporates neighborhood-level demographic data including population density, median household income, employment rates, and consumer spending on this specific category. These factors vary by business type — the demographic profile that drives survivability for Furniture Store customers may differ significantly from what matters for other business categories.
Technical note: Aggregated national survivability rankings across all 24 metros are available in machine-readable format for research and integration purposes.
StreetSpring recalculates survivability using the latest competitive, demographic, and walkability data, so the live score may differ from the static ranges shown here.
Methodology: Neighborhood rankings are based on average Survivability Scores for Furniture Stores across all analyzed locations within each neighborhood. Rankings represent neighborhood-level conditions but do not account for block-by-block variation. Coverage includes 8583 neighborhoods across 24 major US cities.