National Neighborhood Survivability Rankings for Cuban Restaurant
StreetSpring's 2026 nationwide analysis ranks the top neighborhoods across all major US cities for Cuban Restaurants. See which neighborhoods offer the highest Survivability Scores.
Anderson Island (Seattle) ranks #1 nationally for Cuban Restaurant survivability in 2026, with a 96% chance of success for new entrants. The top 25 neighborhoods nationwide span 8 different cities, demonstrating that exceptional opportunities for Cuban Restaurants exist across diverse markets. The best survivability data for any individual location is always StreetSpring's most recent live analysis, which reflects the current competitive landscape at your exact address.
To understand the methodology behind these rankings, see our detailed guide: Survivability Score: How We Calculate It & Why It Matters.
Last reviewed: May 5, 2026 by Bobby Koons, StreetSpring founder — updated weekly
Quick Summary
- #1 Neighborhood: Anderson Island, Seattle — 96% survivability for Cuban Restaurant
- Neighborhoods analyzed: 8583 across 24 major US cities
- National average survivability: 81.6% for Cuban Restaurants
- Top-25 average: 93.9% — 12.3% above national average
- Data current as of: 2026 · Full methodology →
Table of Contents
- How neighborhoods compare nationwide
- Top 25 neighborhoods in the US
- Geographic patterns
- How to use this ranking
- Related resources
- Frequently asked questions
How neighborhoods rank nationwide for Cuban Restaurants
Analyzing 8583 neighborhoods across 24 major US cities, StreetSpring's 2026 data shows that the best neighborhoods for Cuban Restaurants significantly outperform average locations, with the top 25 neighborhoods nationwide averaging 93.9% survivability compared to the national neighborhood average of 81.6%.
Where the surprising outliers come from
This 12.3% advantage illustrates how critical neighborhood selection is — choosing a top-tier neighborhood versus an average one can significantly increase your long-term survival chances.
What the nationwide score spread means for owners
The consumer spending patterns that support Cuban Restaurants vary more by neighborhood than by city — which is why neighborhood-level analysis is particularly valuable for this business category. A 12.3% difference between top neighborhoods and the national average indicates that location selection has an above-average impact on outcomes for Cuban Restaurants compared to categories with narrower spreads. StreetSpring provides highly detailed forecasts — revealing how long hundreds of business types are likely to last at a specific address.
Importantly, top-performing neighborhoods aren't concentrated in just a few cities. The top 25 neighborhoods represent 8 different cities. This means entrepreneurs focused on Cuban Restaurants can find exceptional opportunities across the United States, not just in traditionally strong markets.
Where you open matters more than anything else.
Top US neighborhoods to open a Cuban Restaurant
| Comparison factor | Where high-survivability neighborhoods excel | Where lower-survivability neighborhoods fall short |
|---|---|---|
| Walk Score + foot-traffic alignment | Neighborhoods where Walk Score (90+) matches actual measured pedestrian volume — not just street-grid promise. | High Walk Score scores driven by transit density but with sparse street-level retail engagement. |
| Subtype-specific density saturation | Neighborhoods with the subtype below the optimal density curve — room for a new entrant without cannibalizing demand. | Neighborhoods at or past the saturation point for the subtype, where new entrants face zero-sum competition. |
| Daytime population concentration | Mixed-use neighborhoods with strong daytime employment density (LEHD LODES > 8K jobs/sq mi). | Pure-residential neighborhoods where daytime population drops below 30% of resident count. |
What competitive moat each top neighborhood has
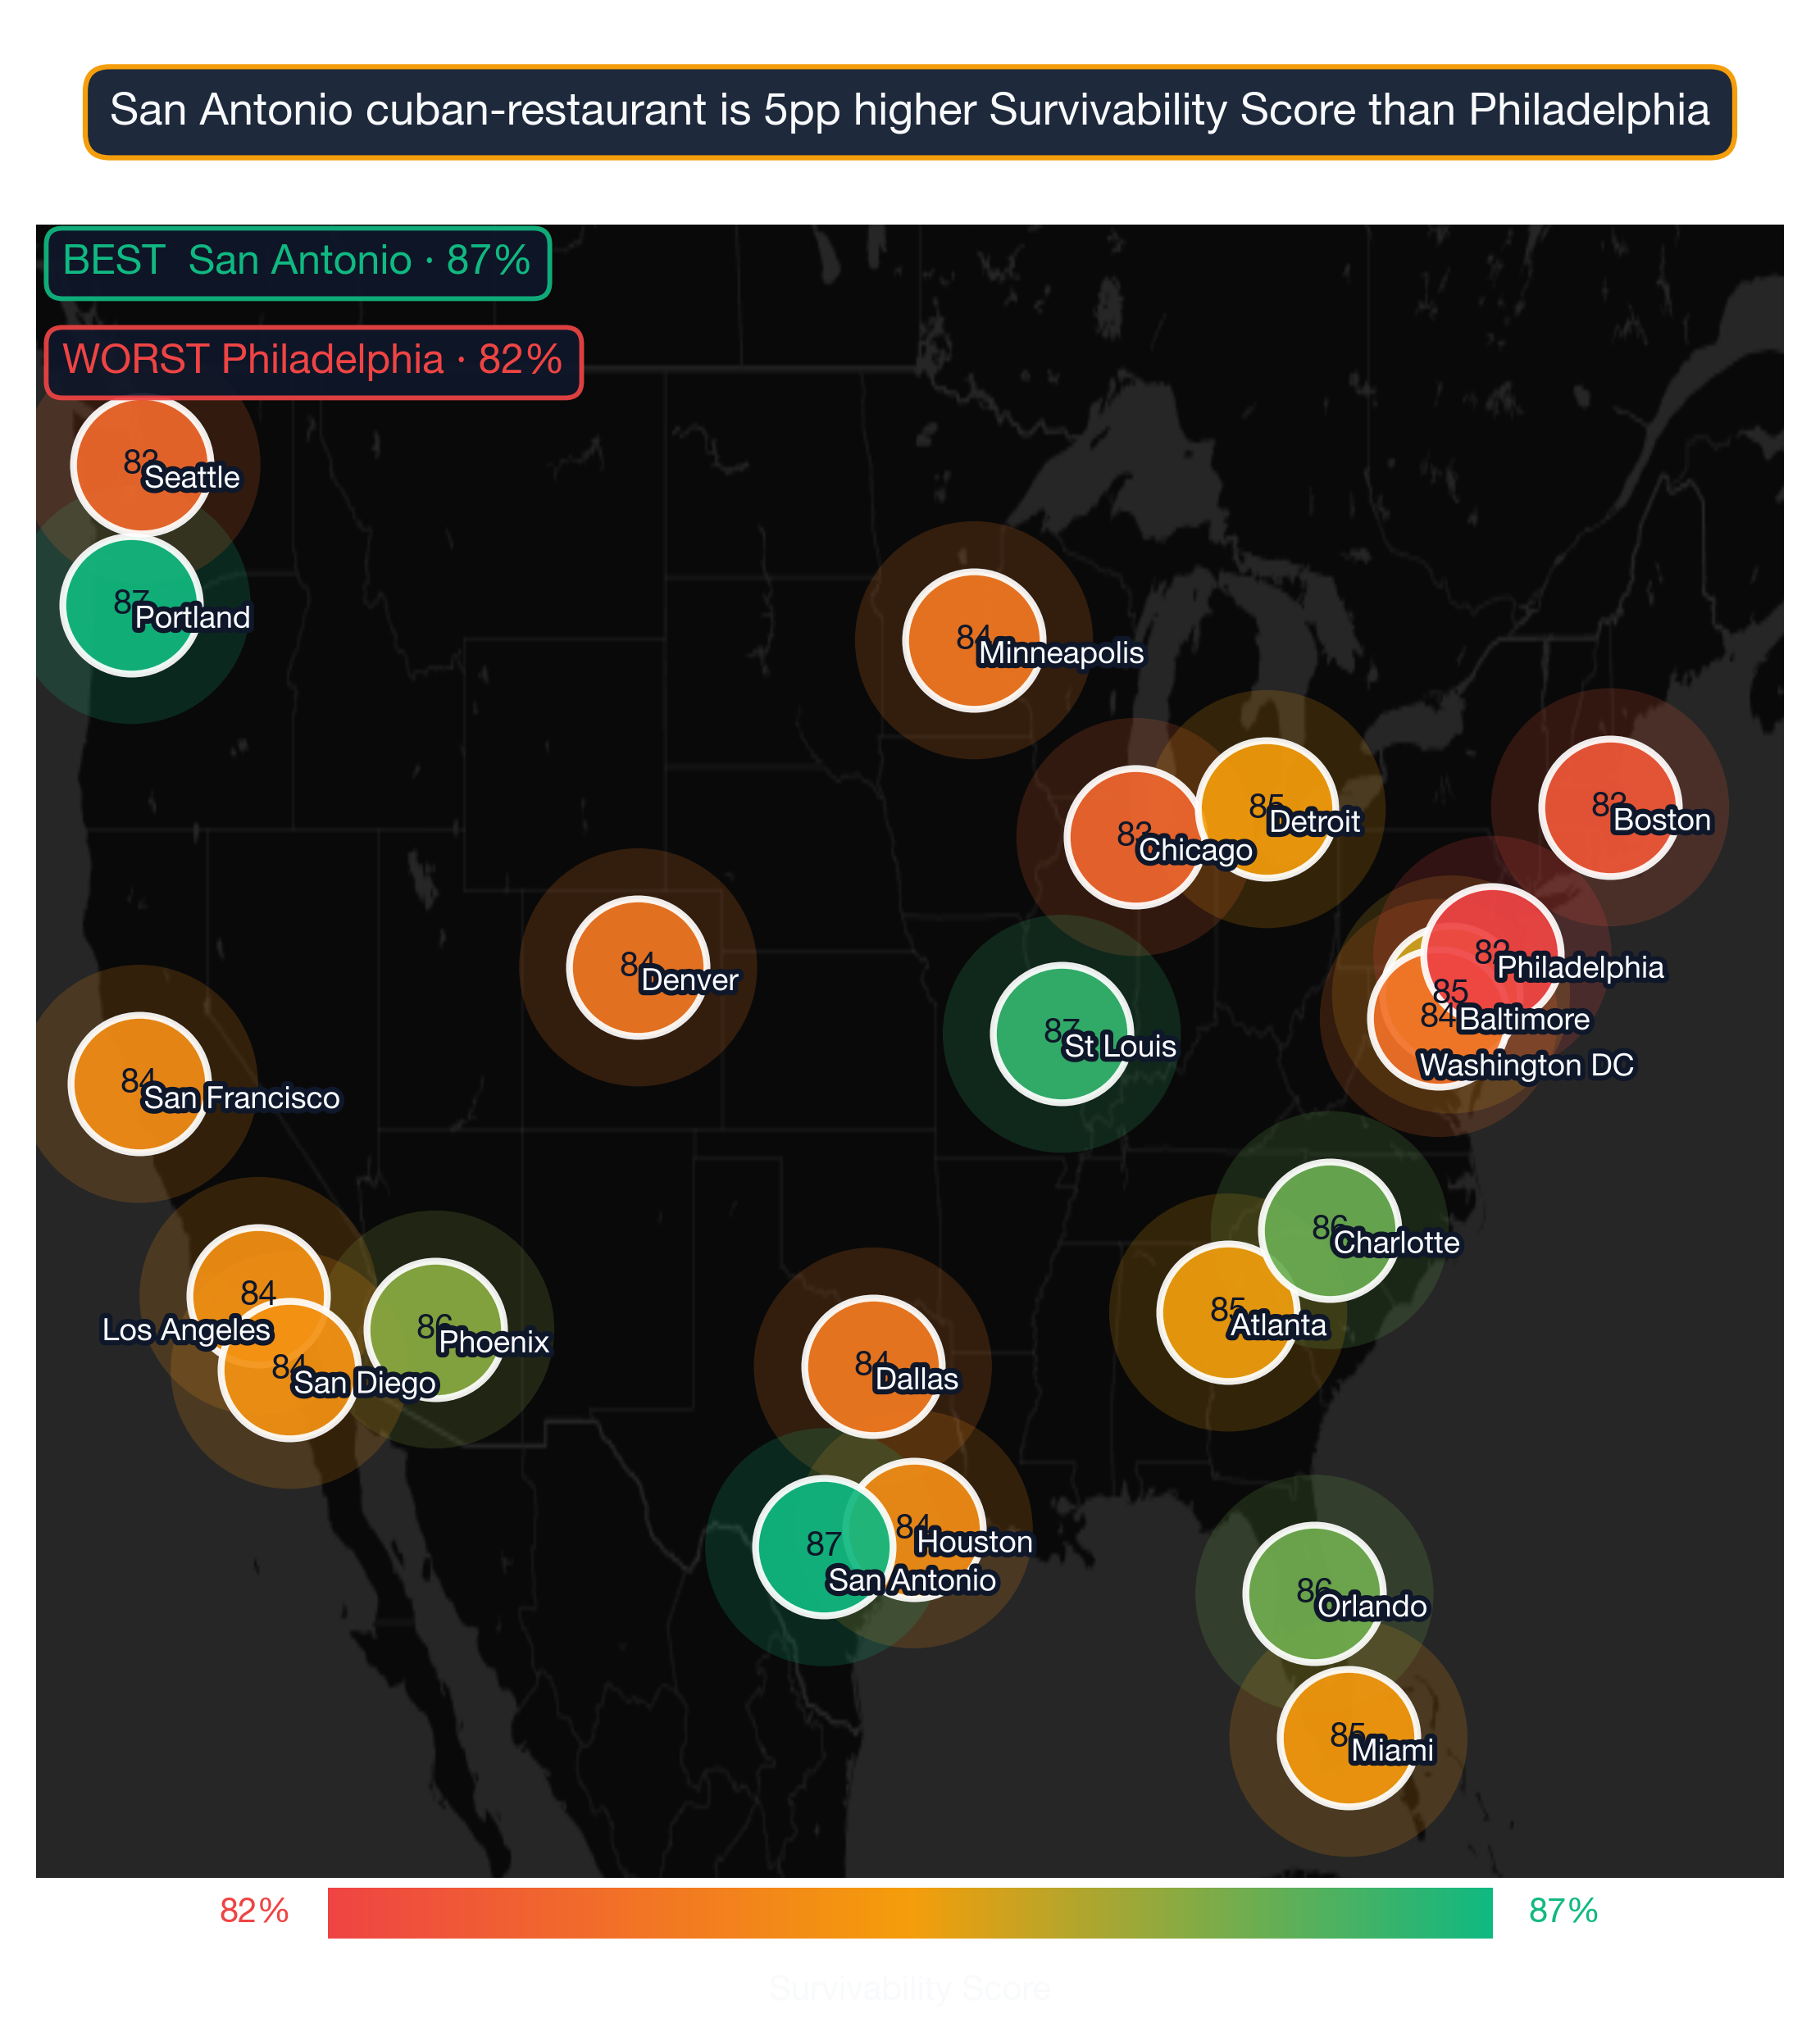
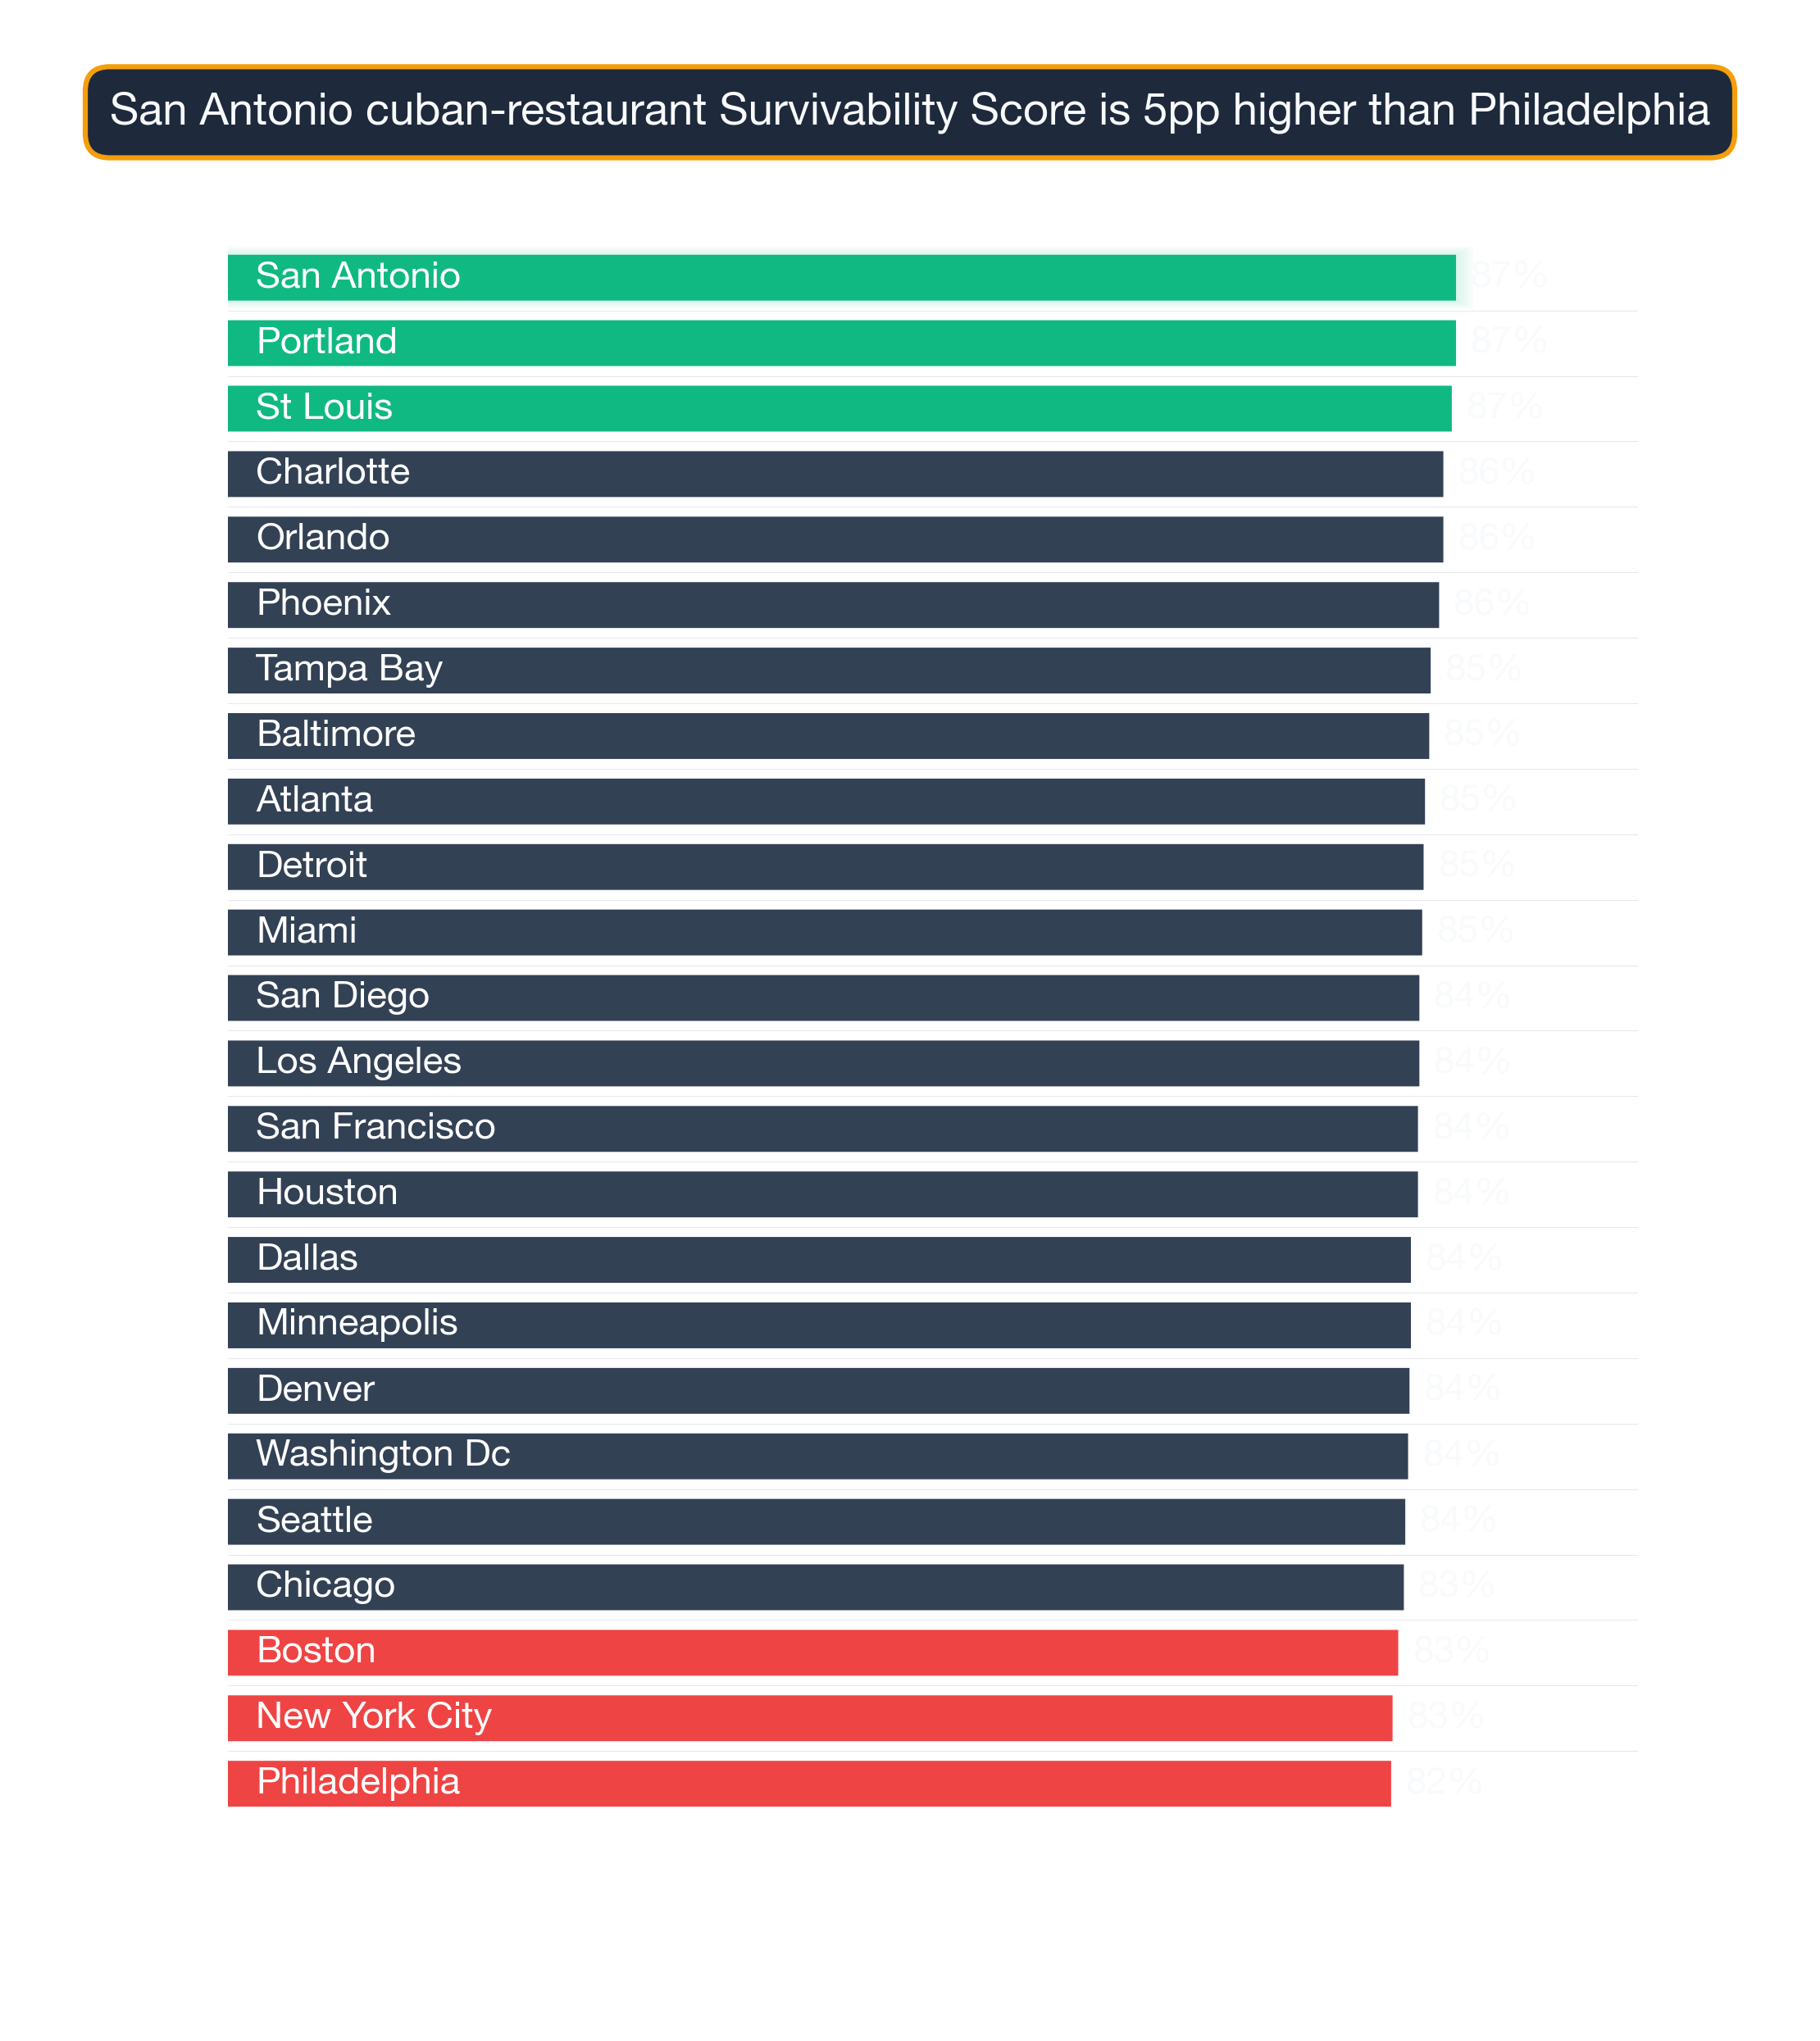
Survivability range for top, middle, and last-ranked neighborhoods. Box = best-to-challenging range; white line = average. Anderson Island, Seattle leads at 96% in 2026. Full methodology →
The top 25 neighborhoods nationwide for Cuban Restaurants are:
| # | Neighborhood | City | Avg Survival | Tier | Best Locations | Challenging Locations |
|---|---|---|---|---|---|---|
| 1 | Anderson Island | Seattle | 96.2% | Great | 97.0% | 94.2% |
| 2 | Wolf Trap | Washington DC | 95.9% | Great | 97.0% | 94.0% |
| 3 | Tysons | Washington DC | 95.8% | Great | 97.0% | 93.9% |
| 4 | Dunn Loring | Washington DC | 95.5% | Great | 97.0% | 93.6% |
| 5 | Lake Kathryn | Orlando | 95.0% | Great | 97.0% | 93.1% |
| 6 | Floris | Washington DC | 94.5% | Great | 96.5% | 92.5% |
| 7 | West Falls Church | Washington DC | 94.4% | Great | 96.4% | 92.5% |
| 8 | McNair | Washington DC | 94.4% | Great | 96.4% | 92.4% |
| 9 | Lake Mack-Forest Hills | Orlando | 94.4% | Great | 96.4% | 92.4% |
| 10 | Silverado | Los Angeles | 94.1% | Great | 96.1% | 92.1% |
| 11 | Northville | New York City | 93.8% | Great | 95.8% | 91.8% |
| 12 | Centreville | Washington DC | 93.7% | Great | 95.7% | 91.7% |
| 13 | Grosse Pointe Farms | Detroit | 93.7% | Great | 95.7% | 91.7% |
| 14 | Woodsboro | Washington DC | 93.5% | Great | 95.4% | 91.5% |
| 15 | Sully Square | Washington DC | 93.4% | Great | 95.4% | 91.4% |
| 16 | Chantilly | Washington DC | 93.4% | Great | 95.3% | 91.4% |
| 17 | McLean | Washington DC | 93.3% | Great | 95.3% | 91.3% |
| 18 | Shelter Island | New York City | 93.1% | Great | 95.1% | 91.1% |
| 19 | Idylwood | Washington DC | 93.0% | Great | 95.0% | 91.0% |
| 20 | Jamesport | New York City | 93.0% | Great | 95.0% | 91.0% |
| 21 | Gila Bend | Phoenix | 92.9% | Great | 94.9% | 90.9% |
| 22 | Flovilla | Atlanta | 92.9% | Great | 94.9% | 90.9% |
| 23 | Thunder Mountain | Phoenix | 92.7% | Great | 94.7% | 90.7% |
| 24 | Belle Terre | New York City | 92.6% | Great | 94.5% | 90.6% |
| 25 | Northampton | New York City | 92.5% | Great | 94.5% | 90.6% |
That said, neighborhood averages don't tell the whole story — there are standout locations even in areas that may appear less suitable.
For a full explanation of how survivability scores and ranges are calculated, see Survivability Score: How We Calculate It & Why It Matters.
What's true of every top-ranked US neighborhood
City Concentration
The top 25 neighborhoods span 8 different cities, with Washington DC claiming 12 of the top spots (48%).
Breakdown of top 25 neighborhoods by city:
- Washington DC: 12 neighborhoods (48% of top 25) — View city guide
- New York City: 5 neighborhoods (20% of top 25) — View city guide
- Orlando: 2 neighborhoods (8% of top 25) — View city guide
- Phoenix: 2 neighborhoods (8% of top 25) — View city guide
- Seattle: 1 neighborhood (4% of top 25) — View city guide
- Los Angeles: 1 neighborhood (4% of top 25) — View city guide
- Detroit: 1 neighborhood (4% of top 25) — View city guide
- Atlanta: 1 neighborhood (4% of top 25) — View city guide
This distribution has practical implications for Cuban Restaurants operators: cities with multiple neighborhoods in the top 25 offer more site options within a single market, reducing relocation or expansion cost. Cities with a single top-25 neighborhood require more precise site selection — the advantage is concentrated in one area rather than spread across the metro.
The income-and-density pattern
The concentration of 12 top-ranked neighborhoods in Washington DC (48% of the top 25) is notably high for this business category, suggesting that Washington DC's market conditions — competitive density, consumer spending patterns, and demographic alignment — are unusually favorable for Cuban Restaurants. Operators targeting this category should treat Washington DC neighborhoods as a primary focus before expanding to secondary markets.
How can I use this neighborhood ranking to find the best location for a Cuban Restaurant?
National rankings are a powerful starting point, but your final site decision should be validated at the address level. The StreetSpring platform combines proprietary consumer spending forecasts, competitive density analysis, and mobility data to produce survivability predictions no other tool replicates. Block-level conditions within any neighborhood can shift survivability by 10–20 points — this ranking narrows your search, and StreetSpring's live tool finalizes it.
For the most accurate assessment:
- Consider neighborhoods in the top 25 as strong starting points
- Examine city-specific guides for additional neighborhood options in your target markets
- Use StreetSpring's address-level tool to evaluate specific storefronts within these neighborhoods
- Factor in your budget, operational requirements, and target demographics
Each neighborhood has detailed analysis available through its city guide, providing block-by-block survivability data for Cuban Restaurants.
Why score alone shouldn't drive the lease decision
See also: Best Cities for Cuban Restaurant — our city-level comparison ranks which metros offer the strongest overall conditions for Cuban Restaurants.
Visual Data
Related Resources
Explore top cities represented in these neighborhoods:
- New York City: Best businesses and neighborhoods
- Atlanta: Best businesses and neighborhoods
- Orlando: Best businesses and neighborhoods
- Los Angeles: Best businesses and neighborhoods
- Seattle: Best businesses and neighborhoods
National city rankings: Best cities for Cuban Restaurants
Essential resources:
- How StreetSpring calculates Survivability Scores
- Site selection for landlords
- AI tools for tenant representatives
- StreetSpring vs competitors
Frequently Asked Questions
What is the difference between city-level and neighborhood-level survivability rankings for Cuban Restaurants?
City-level rankings reflect average survivability for Cuban Restaurants across all neighborhoods in a given city — useful for identifying which cities offer the best overall conditions. Neighborhood-level rankings go deeper, showing which specific neighborhoods within those cities rank highest. StreetSpring's address-level tool adds a third layer, scoring individual storefronts within any neighborhood.
How do I interpret a survivability score?
A survivability score represents the estimated probability that a business of a specific type will still be operating at a given location after 2 years. A score of 80% means StreetSpring's model predicts an 80% chance of the business surviving past the 2-year mark at that address. Scores are calculated at the address level and reflect competitive density, consumer spending patterns, mobility data, and 80+ additional factors.
How often do neighborhood rankings change?
StreetSpring updates rankings quarterly as new data on business openings, closures, and market conditions becomes available. The current analysis reflects 2026 data. Because competitive conditions shift as new businesses enter or exit a neighborhood, the specific rankings for any given business type can shift between updates — which is why we recommend verifying specific addresses in StreetSpring's live tool before making a final site selection decision.
What is the typical survivability range for Cuban Restaurants in top neighborhoods?
The top 25 neighborhoods nationwide for Cuban Restaurants average 93.9% survivability. The national average across all analyzed neighborhoods is 81.6%. The spread between top neighborhoods and the national average is 12.3% — representing the tangible survivability advantage of choosing a top-ranked location.
What demographic factors drive survivability for Cuban Restaurants?
For Cuban Restaurants, StreetSpring's model incorporates neighborhood-level demographic data including population density, median household income, employment rates, and consumer spending on this specific category. These factors vary by business type — the demographic profile that drives survivability for Cuban Restaurant customers may differ significantly from what matters for other business categories.
How can I compare specific addresses within these top neighborhoods?
StreetSpring's address-level tool allows you to input any commercial address and see predicted survivability for Cuban Restaurants. Even within the top-ranked neighborhoods, survivability varies meaningfully by block — address-level scoring is the most precise way to evaluate a specific site.
Can a Cuban Restaurant succeed in neighborhoods outside the top 25?
Yes — the top 25 neighborhoods represent standout conditions, but Cuban Restaurants can achieve strong survivability in many other neighborhoods as well. What matters is finding a location where competitive density is low enough and consumer spending is strong enough to support the business. StreetSpring's address-level tool identifies high-survivability addresses in any neighborhood, including those not represented in this top-25 list.
Are the best neighborhoods for Cuban Restaurants in large cities or smaller markets?
The top neighborhoods for Cuban Restaurants in StreetSpring's 2026 dataset are concentrated in 8 cities in the current dataset. As coverage expands, this breakdown may shift. The fundamental driver is the competitive-to-spending ratio at the address level, which can favor strong locations in both large and smaller markets.
Technical note: Aggregated national survivability rankings across all 24 metros are available in machine-readable format for research and integration purposes.
StreetSpring recalculates survivability using the latest competitive, demographic, and walkability data, so the live score may differ from the static ranges shown here.
Methodology: Neighborhood rankings are based on average Survivability Scores for Cuban Restaurants across all analyzed locations within each neighborhood. Rankings represent neighborhood-level conditions but do not account for block-by-block variation. Coverage includes 8583 neighborhoods across 24 major US cities.