National Neighborhood Survivability Rankings for Central American Restaurant
StreetSpring's 2026 nationwide analysis ranks the top neighborhoods across all major US cities for Central American Restaurants. See which neighborhoods offer the highest Survivability Scores.
StreetSpring's 2026 cross-market analysis reveals that Anderson Island in Seattle ranks as the #1 neighborhood in the United States for opening a Central American Restaurant, with 96% survivability. The top 25 neighborhoods nationwide span 9 different cities, demonstrating that exceptional opportunities for Central American Restaurants exist across diverse markets. Rankings like this are a strong starting point, but the live survivability score in StreetSpring will reflect the most current competitor data for your exact address.
To understand the methodology behind these rankings, see our detailed guide: Survivability Score: How We Calculate It & Why It Matters.
Reviewed and updated: May 16, 2026 — Bobby Koons, Founder & CEO, StreetSpring
Quick Summary
- #1 Neighborhood: Anderson Island, Seattle — 96% survivability for Central American Restaurant
- Neighborhoods analyzed: 8583 across 24 major US cities
- National average survivability: 81.9% for Central American Restaurants
- Top-25 average: 93.6% — 11.7% above national average
- Data current as of: 2026 · Full methodology →
Table of Contents
- How neighborhoods compare nationwide
- Top 25 neighborhoods in the US
- Geographic patterns
- How to use this ranking
- Related resources
- Frequently asked questions
Cross-Country Neighborhood Comparison for Central American Restaurants
Analyzing 8583 neighborhoods across 24 major US cities, StreetSpring's 2026 data shows that the best neighborhoods for Central American Restaurants significantly outperform average locations, with the top 25 neighborhoods nationwide averaging 93.6% survivability compared to the national neighborhood average of 81.9%.
What the nationwide score spread means for owners
This 11.7% advantage illustrates how critical neighborhood selection is — choosing a top-tier neighborhood versus an average one can significantly increase your long-term survival chances.
Why some metros dominate this business's leaderboard
The consumer spending patterns that support Central American Restaurants vary more by neighborhood than by city — which is why neighborhood-level analysis is particularly valuable for this business category. A 11.7% difference between top neighborhoods and the national average indicates that location selection has an above-average impact on outcomes for Central American Restaurants compared to categories with narrower spreads. StreetSpring pinpoints the exact survival likelihood for hundreds of business types at a specific address.
Importantly, top-performing neighborhoods aren't concentrated in just a few cities. The top 25 neighborhoods represent 9 different cities. This means entrepreneurs focused on Central American Restaurants can find exceptional opportunities across the United States, not just in traditionally strong markets.
Survivability data consistently shows location accounts for more variance in business outcomes than any other controllable factor.
Top US neighborhoods to open a Central American Restaurant
| Comparison factor | Where high-survivability neighborhoods excel | Where lower-survivability neighborhoods fall short |
|---|---|---|
| Subtype-specific density saturation | Neighborhoods with the subtype below the optimal density curve — room for a new entrant without cannibalizing demand. | Neighborhoods at or past the saturation point for the subtype, where new entrants face zero-sum competition. |
| Anchor-venue spillover | Neighborhoods within 0.25 miles of a major anchor (transit hub, university gate, hospital main entrance, concert venue). | Neighborhoods where the nearest anchor is past walking distance — no spillover demand. |
| Storefront vacancy + churn signal | Neighborhoods with low recent vacancy and steady operator continuity in similar subtypes. | Neighborhoods with elevated commercial vacancy or repeated tenant turnover in the same storefronts. |
What competitive moat each top neighborhood has
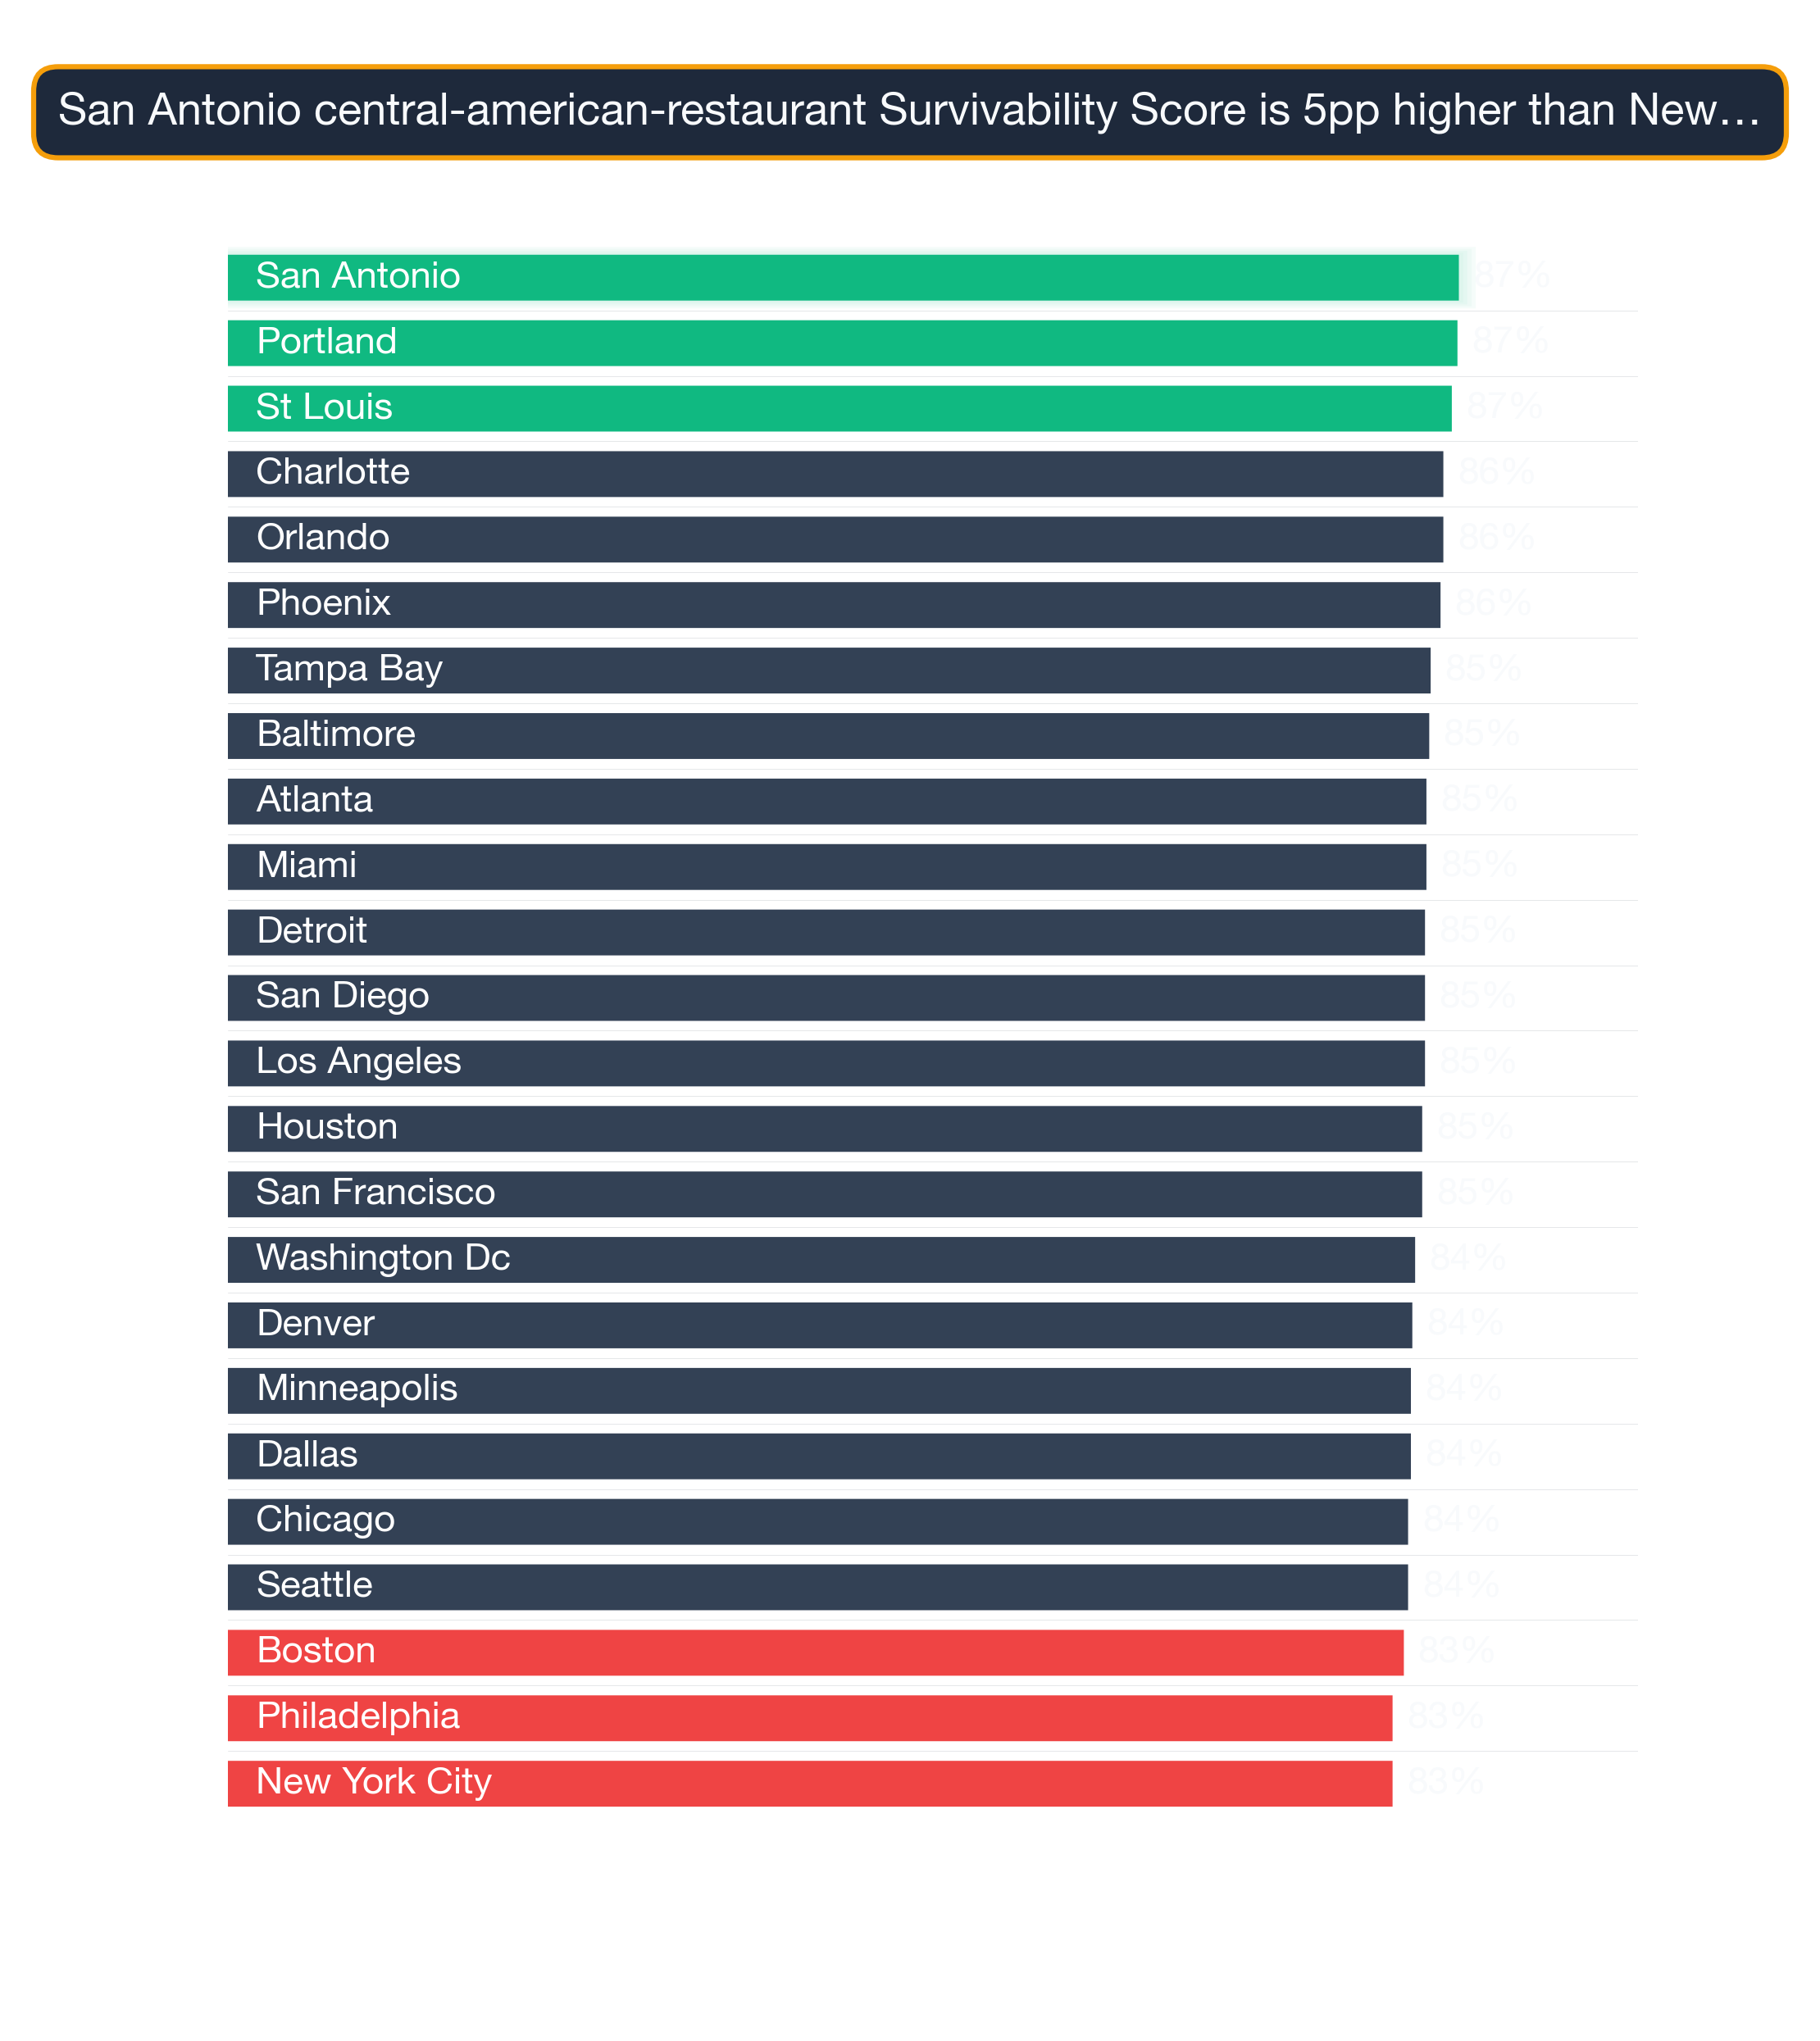
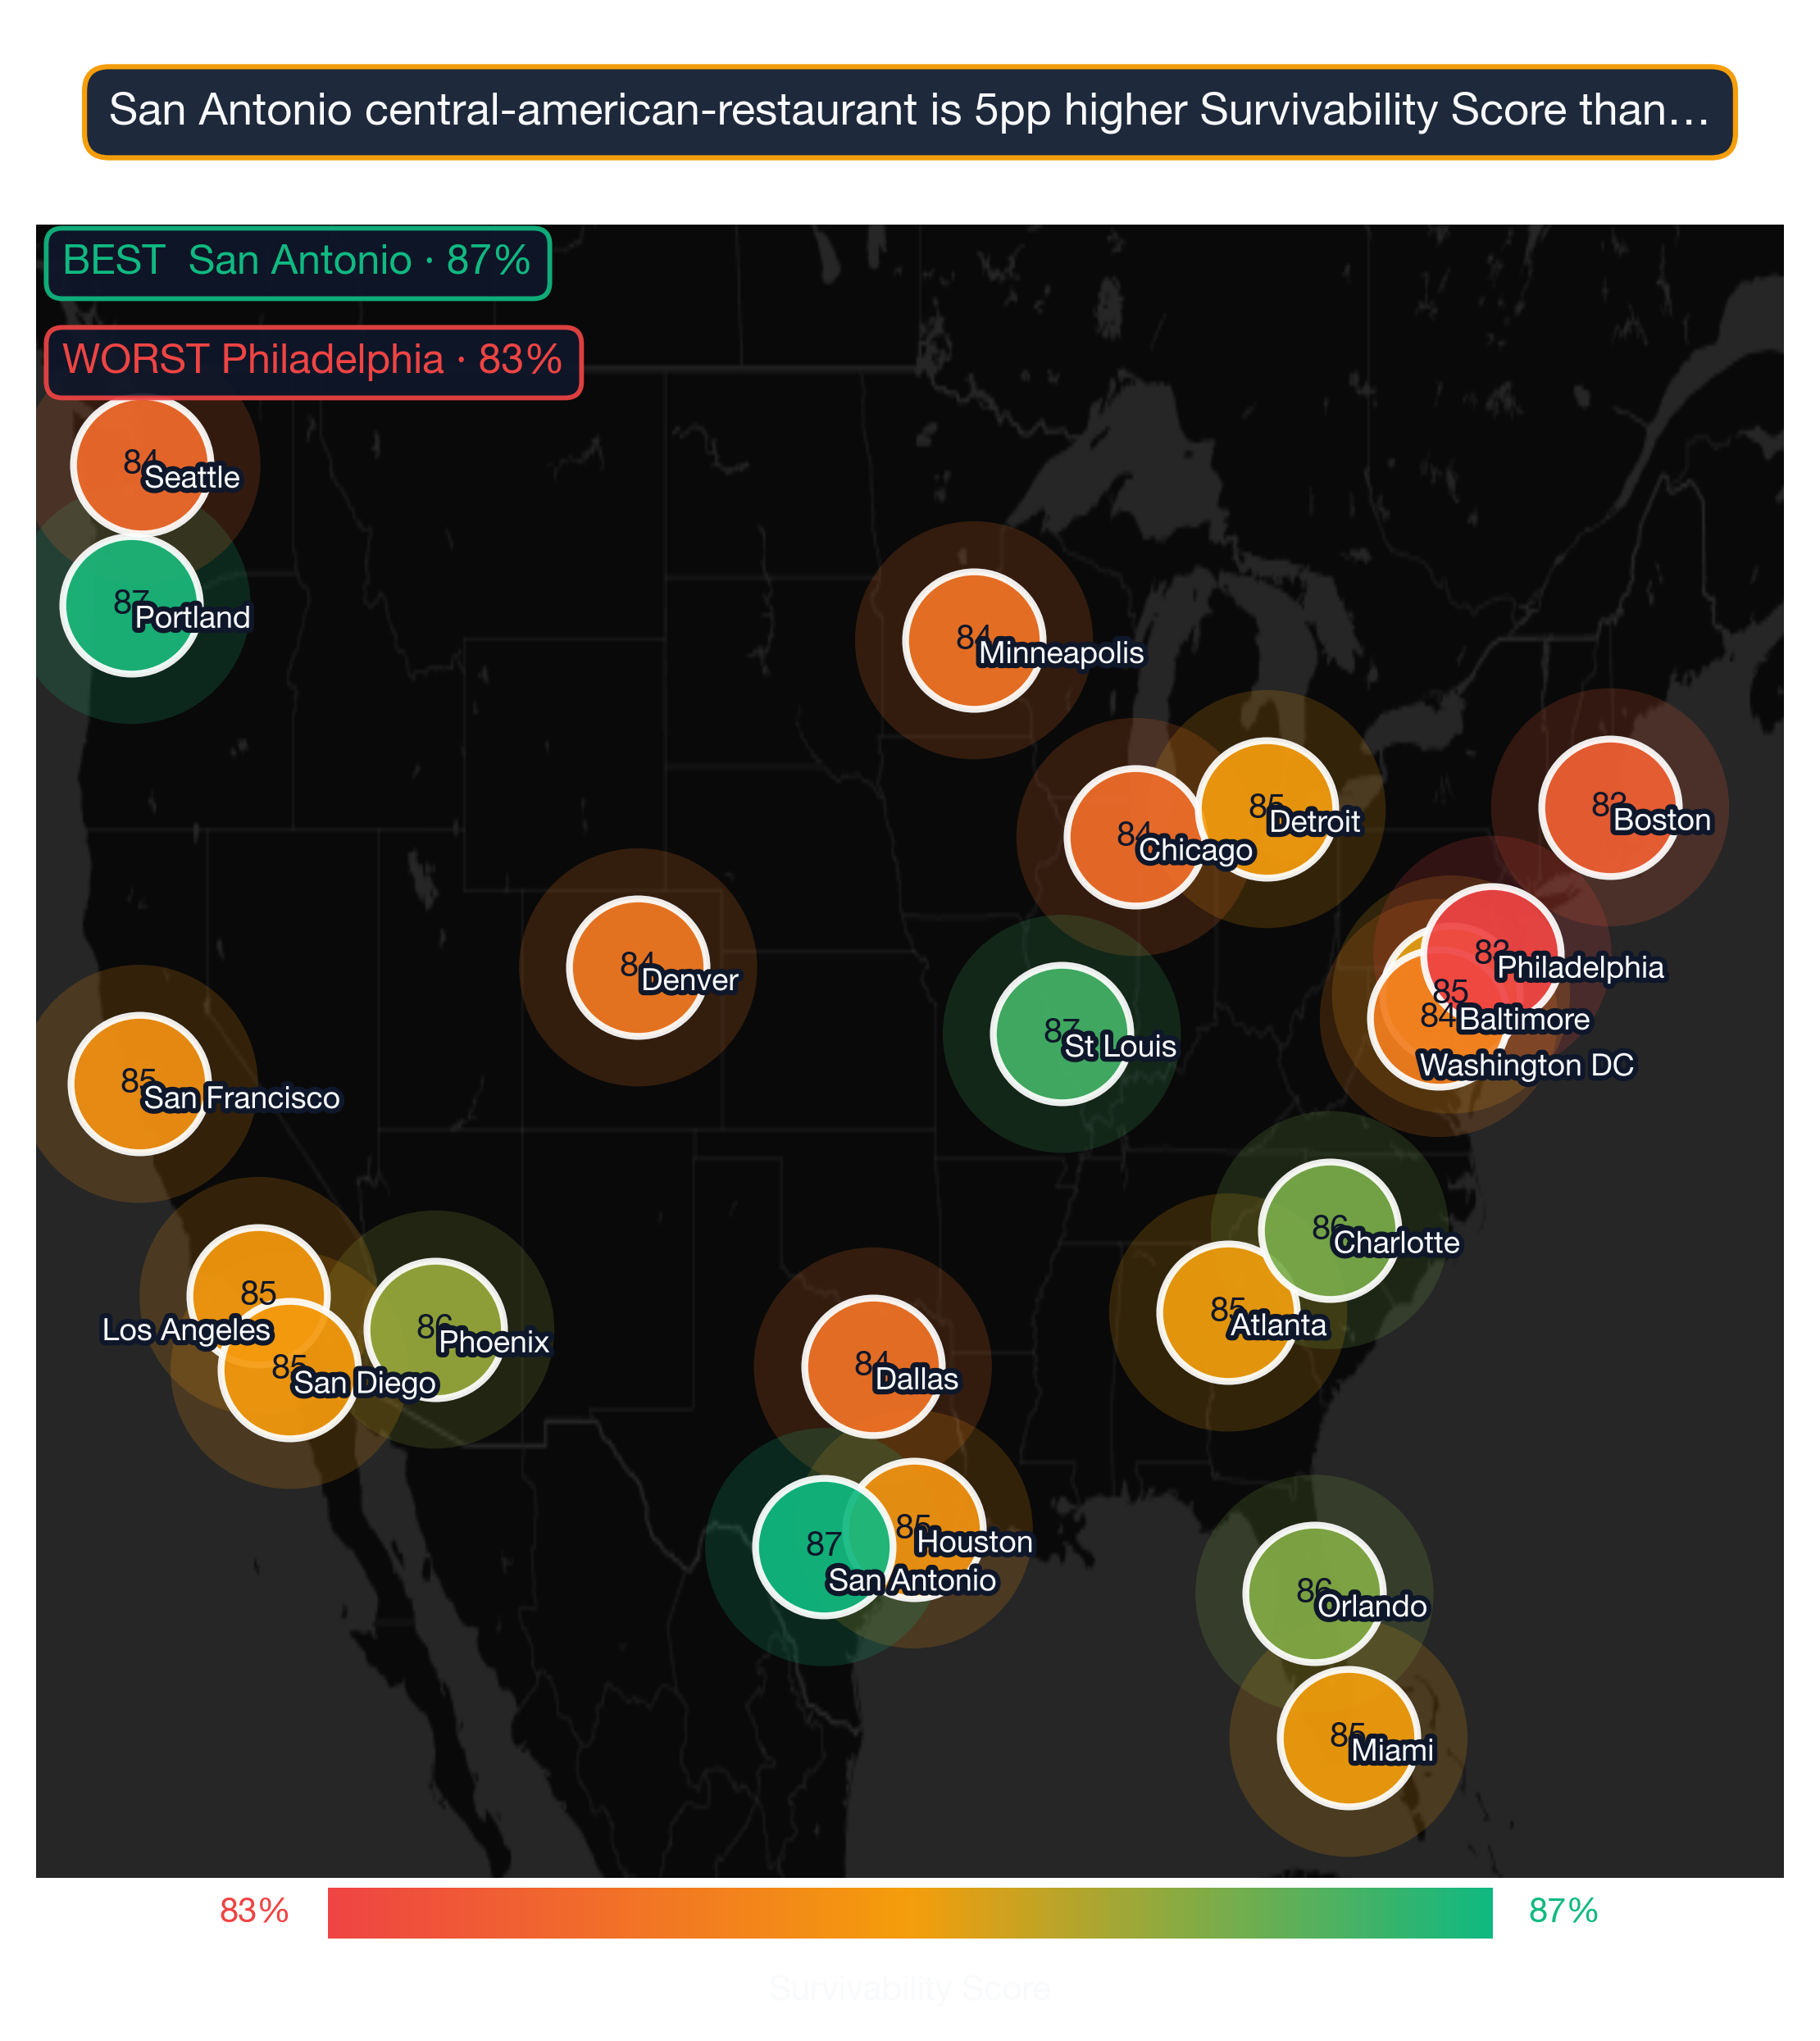
Survivability range for top, middle, and last-ranked neighborhoods. Box = best-to-challenging range; white line = average. Anderson Island, Seattle leads at 96% in 2026. Full methodology →
The top 25 neighborhoods nationwide for Central American Restaurants are:
| # | Neighborhood | City | Avg Survival | Tier | Best Locations | Challenging Locations |
|---|---|---|---|---|---|---|
| 1 | Anderson Island | Seattle | 96.2% | Great | 97.0% | 94.2% |
| 2 | Wolf Trap | Washington DC | 95.9% | Great | 97.0% | 93.9% |
| 3 | Lake Kathryn | Orlando | 95.0% | Great | 97.0% | 93.0% |
| 4 | Floris | Washington DC | 94.5% | Great | 96.6% | 92.4% |
| 5 | McNair | Washington DC | 94.4% | Great | 96.6% | 92.4% |
| 6 | Lake Mack-Forest Hills | Orlando | 94.4% | Great | 96.5% | 92.3% |
| 7 | Dunn Loring | Washington DC | 94.0% | Great | 96.2% | 92.0% |
| 8 | West Falls Church | Washington DC | 94.0% | Great | 96.1% | 92.0% |
| 9 | Northville | New York City | 93.8% | Great | 95.9% | 91.8% |
| 10 | Grosse Pointe Farms | Detroit | 93.7% | Great | 95.8% | 91.7% |
| 11 | Tysons | Washington DC | 93.6% | Great | 95.7% | 91.6% |
| 12 | Woodsboro | Washington DC | 93.5% | Great | 95.6% | 91.4% |
| 13 | Silverado | Los Angeles | 93.4% | Great | 95.6% | 91.4% |
| 14 | Sully Square | Washington DC | 93.1% | Great | 95.3% | 91.1% |
| 15 | Shelter Island | New York City | 93.1% | Great | 95.2% | 91.1% |
| 16 | Jamesport | New York City | 93.0% | Great | 95.1% | 91.0% |
| 17 | Centreville | Washington DC | 92.9% | Great | 95.1% | 90.9% |
| 18 | Gila Bend | Phoenix | 92.9% | Great | 95.0% | 90.8% |
| 19 | Flovilla | Atlanta | 92.9% | Great | 95.0% | 90.8% |
| 20 | Eatonville | Seattle | 92.8% | Great | 94.9% | 90.8% |
| 21 | Sheldon | Houston | 92.8% | Great | 94.9% | 90.8% |
| 22 | Thunder Mountain | Phoenix | 92.7% | Great | 94.8% | 90.6% |
| 23 | Belle Terre | New York City | 92.6% | Great | 94.7% | 90.5% |
| 24 | West Jamaica Bay Islands | New York City | 92.5% | Great | 94.7% | 90.5% |
| 25 | Armada | Detroit | 92.5% | Great | 94.7% | 90.5% |
Market conditions are changing daily and it is best to use StreetSpring's most up-to-date data to make sure that there have not been major changes.
For a full explanation of how survivability scores and ranges are calculated, see Survivability Score: How We Calculate It & Why It Matters.
What patterns emerge from the top-performing neighborhoods nationwide?
City Concentration
The top 25 neighborhoods span 9 different cities, with Washington DC claiming 9 of the top spots (36%).
Breakdown of top 25 neighborhoods by city:
- Washington DC: 9 neighborhoods (36% of top 25) — View city guide
- New York City: 5 neighborhoods (20% of top 25) — View city guide
- Seattle: 2 neighborhoods (8% of top 25) — View city guide
- Orlando: 2 neighborhoods (8% of top 25) — View city guide
- Detroit: 2 neighborhoods (8% of top 25) — View city guide
- Phoenix: 2 neighborhoods (8% of top 25) — View city guide
- Los Angeles: 1 neighborhood (4% of top 25) — View city guide
- Atlanta: 1 neighborhood (4% of top 25) — View city guide
- Houston: 1 neighborhood (4% of top 25) — View city guide
This distribution has practical implications for Central American Restaurants operators: cities with multiple neighborhoods in the top 25 offer more site options within a single market, reducing relocation or expansion cost. Cities with a single top-25 neighborhood require more precise site selection — the advantage is concentrated in one area rather than spread across the metro.
The income-and-density pattern
The relatively even distribution of top neighborhoods across 9 cities is consistent with a category where consumer demand is broadly distributed rather than concentrated in specific metros. For Central American Restaurants operators, this means strong site opportunities exist in multiple markets — the key variable is neighborhood-level competitive conditions rather than city-level market size.
From national ranking to a specific Central American Restaurant location
Use this ranking to shortlist neighborhoods, then drill down to specific addresses. Powered by advanced AI, StreetSpring predicts how businesses will perform in neighborhoods across the country. The difference between the best and worst blocks within a single top-ranked neighborhood can be as large as the gap between the #1 and #25 neighborhoods on this list.
For the most accurate assessment:
- Consider neighborhoods in the top 25 as strong starting points
- Examine city-specific guides for additional neighborhood options in your target markets
- Use StreetSpring's address-level tool to evaluate specific storefronts within these neighborhoods
- Factor in your budget, operational requirements, and target demographics
Each neighborhood has detailed analysis available through its city guide, providing block-by-block survivability data for Central American Restaurants.
From national rank to your shortlist
See also: Best Cities for Central American Restaurant — our city-level comparison ranks which metros offer the strongest overall conditions for Central American Restaurants.
Visual Data
Related Resources
Explore top cities represented in these neighborhoods:
- New York City: Best businesses and neighborhoods
- Atlanta: Best businesses and neighborhoods
- Orlando: Best businesses and neighborhoods
- Los Angeles: Best businesses and neighborhoods
- Seattle: Best businesses and neighborhoods
National city rankings: Best cities for Central American Restaurants
Essential resources:
- How StreetSpring calculates Survivability Scores
- Site selection for landlords
- AI tools for tenant representatives
- StreetSpring vs competitors
Frequently Asked Questions
Are there good opportunities outside the top 25 neighborhoods?
Absolutely. Our analysis covers 8583 neighborhoods across 24 cities. Many neighborhoods outside the top 25 have excellent individual locations for Central American Restaurants. Neighborhood-level rankings reflect averages — specific addresses within any neighborhood can score well above or below the neighborhood mean. Use city-specific guides and StreetSpring's address-level tool to explore options beyond the top 25.
Can a Central American Restaurant succeed in neighborhoods outside the top 25?
Yes — the top 25 neighborhoods represent standout conditions, but Central American Restaurants can achieve strong survivability in many other neighborhoods as well. What matters is finding a location where competitive density is low enough and consumer spending is strong enough to support the business. StreetSpring's address-level tool identifies high-survivability addresses in any neighborhood, including those not represented in this top-25 list.
Which cities appear most frequently in the top 25 neighborhoods for Central American Restaurants?
The cities most represented in the top 25 for Central American Restaurants are Washington DC (9), New York City (5), Seattle (2). This concentration reflects the relative strength of consumer demand and competitive conditions for Central American Restaurants in these markets. City-specific guides provide deeper analysis of each city's neighborhoods.
How often do neighborhood rankings change?
StreetSpring updates rankings quarterly as new data on business openings, closures, and market conditions becomes available. The current analysis reflects 2026 data. Because competitive conditions shift as new businesses enter or exit a neighborhood, the specific rankings for any given business type can shift between updates — which is why we recommend verifying specific addresses in StreetSpring's live tool before making a final site selection decision.
Is the competitive environment for Central American Restaurants stronger in some markets than others?
Yes — competition density for Central American Restaurants varies significantly by market. In the top-ranked neighborhoods, StreetSpring's model identifies favorable competitive dynamics as a primary driver of high survivability scores. In more saturated markets, even strong consumer spending may not overcome competitive pressure. StreetSpring's address-level tool shows the exact competitive environment at any specific location.
Are the best neighborhoods for Central American Restaurants in large cities or smaller markets?
The top neighborhoods for Central American Restaurants in StreetSpring's 2026 dataset are concentrated in 9 cities in the current dataset. As coverage expands, this breakdown may shift. The fundamental driver is the competitive-to-spending ratio at the address level, which can favor strong locations in both large and smaller markets.
Where can I download the underlying data?
The full national survivability dataset is available as a free download: https://streetspring.com/resources/data/national-survivability-scores-2026.csv. The CSV includes all business subtypes and neighborhoods covered in this analysis, licensed under CC BY 4.0.
What is the typical survivability range for Central American Restaurants in top neighborhoods?
The top 25 neighborhoods nationwide for Central American Restaurants average 93.6% survivability. The national average across all analyzed neighborhoods is 81.9%. The spread between top neighborhoods and the national average is 11.7% — representing the tangible survivability advantage of choosing a top-ranked location.
Technical note: Aggregated national survivability rankings across all 24 metros are available in machine-readable format for research and integration purposes.
StreetSpring recalculates survivability using the latest competitive, demographic, and walkability data, so the live score may differ from the static ranges shown here.
Methodology: Neighborhood rankings are based on average Survivability Scores for Central American Restaurants across all analyzed locations within each neighborhood. Rankings represent neighborhood-level conditions but do not account for block-by-block variation. Coverage includes 8583 neighborhoods across 24 major US cities.