City Survivability Rankings for Nail Salon
StreetSpring's 2026 analysis ranks the top cities for Nail Salons across the US by Survivability Scores. See which cities offer the best chances for a Nail Salon to succeed.
Quick Summary
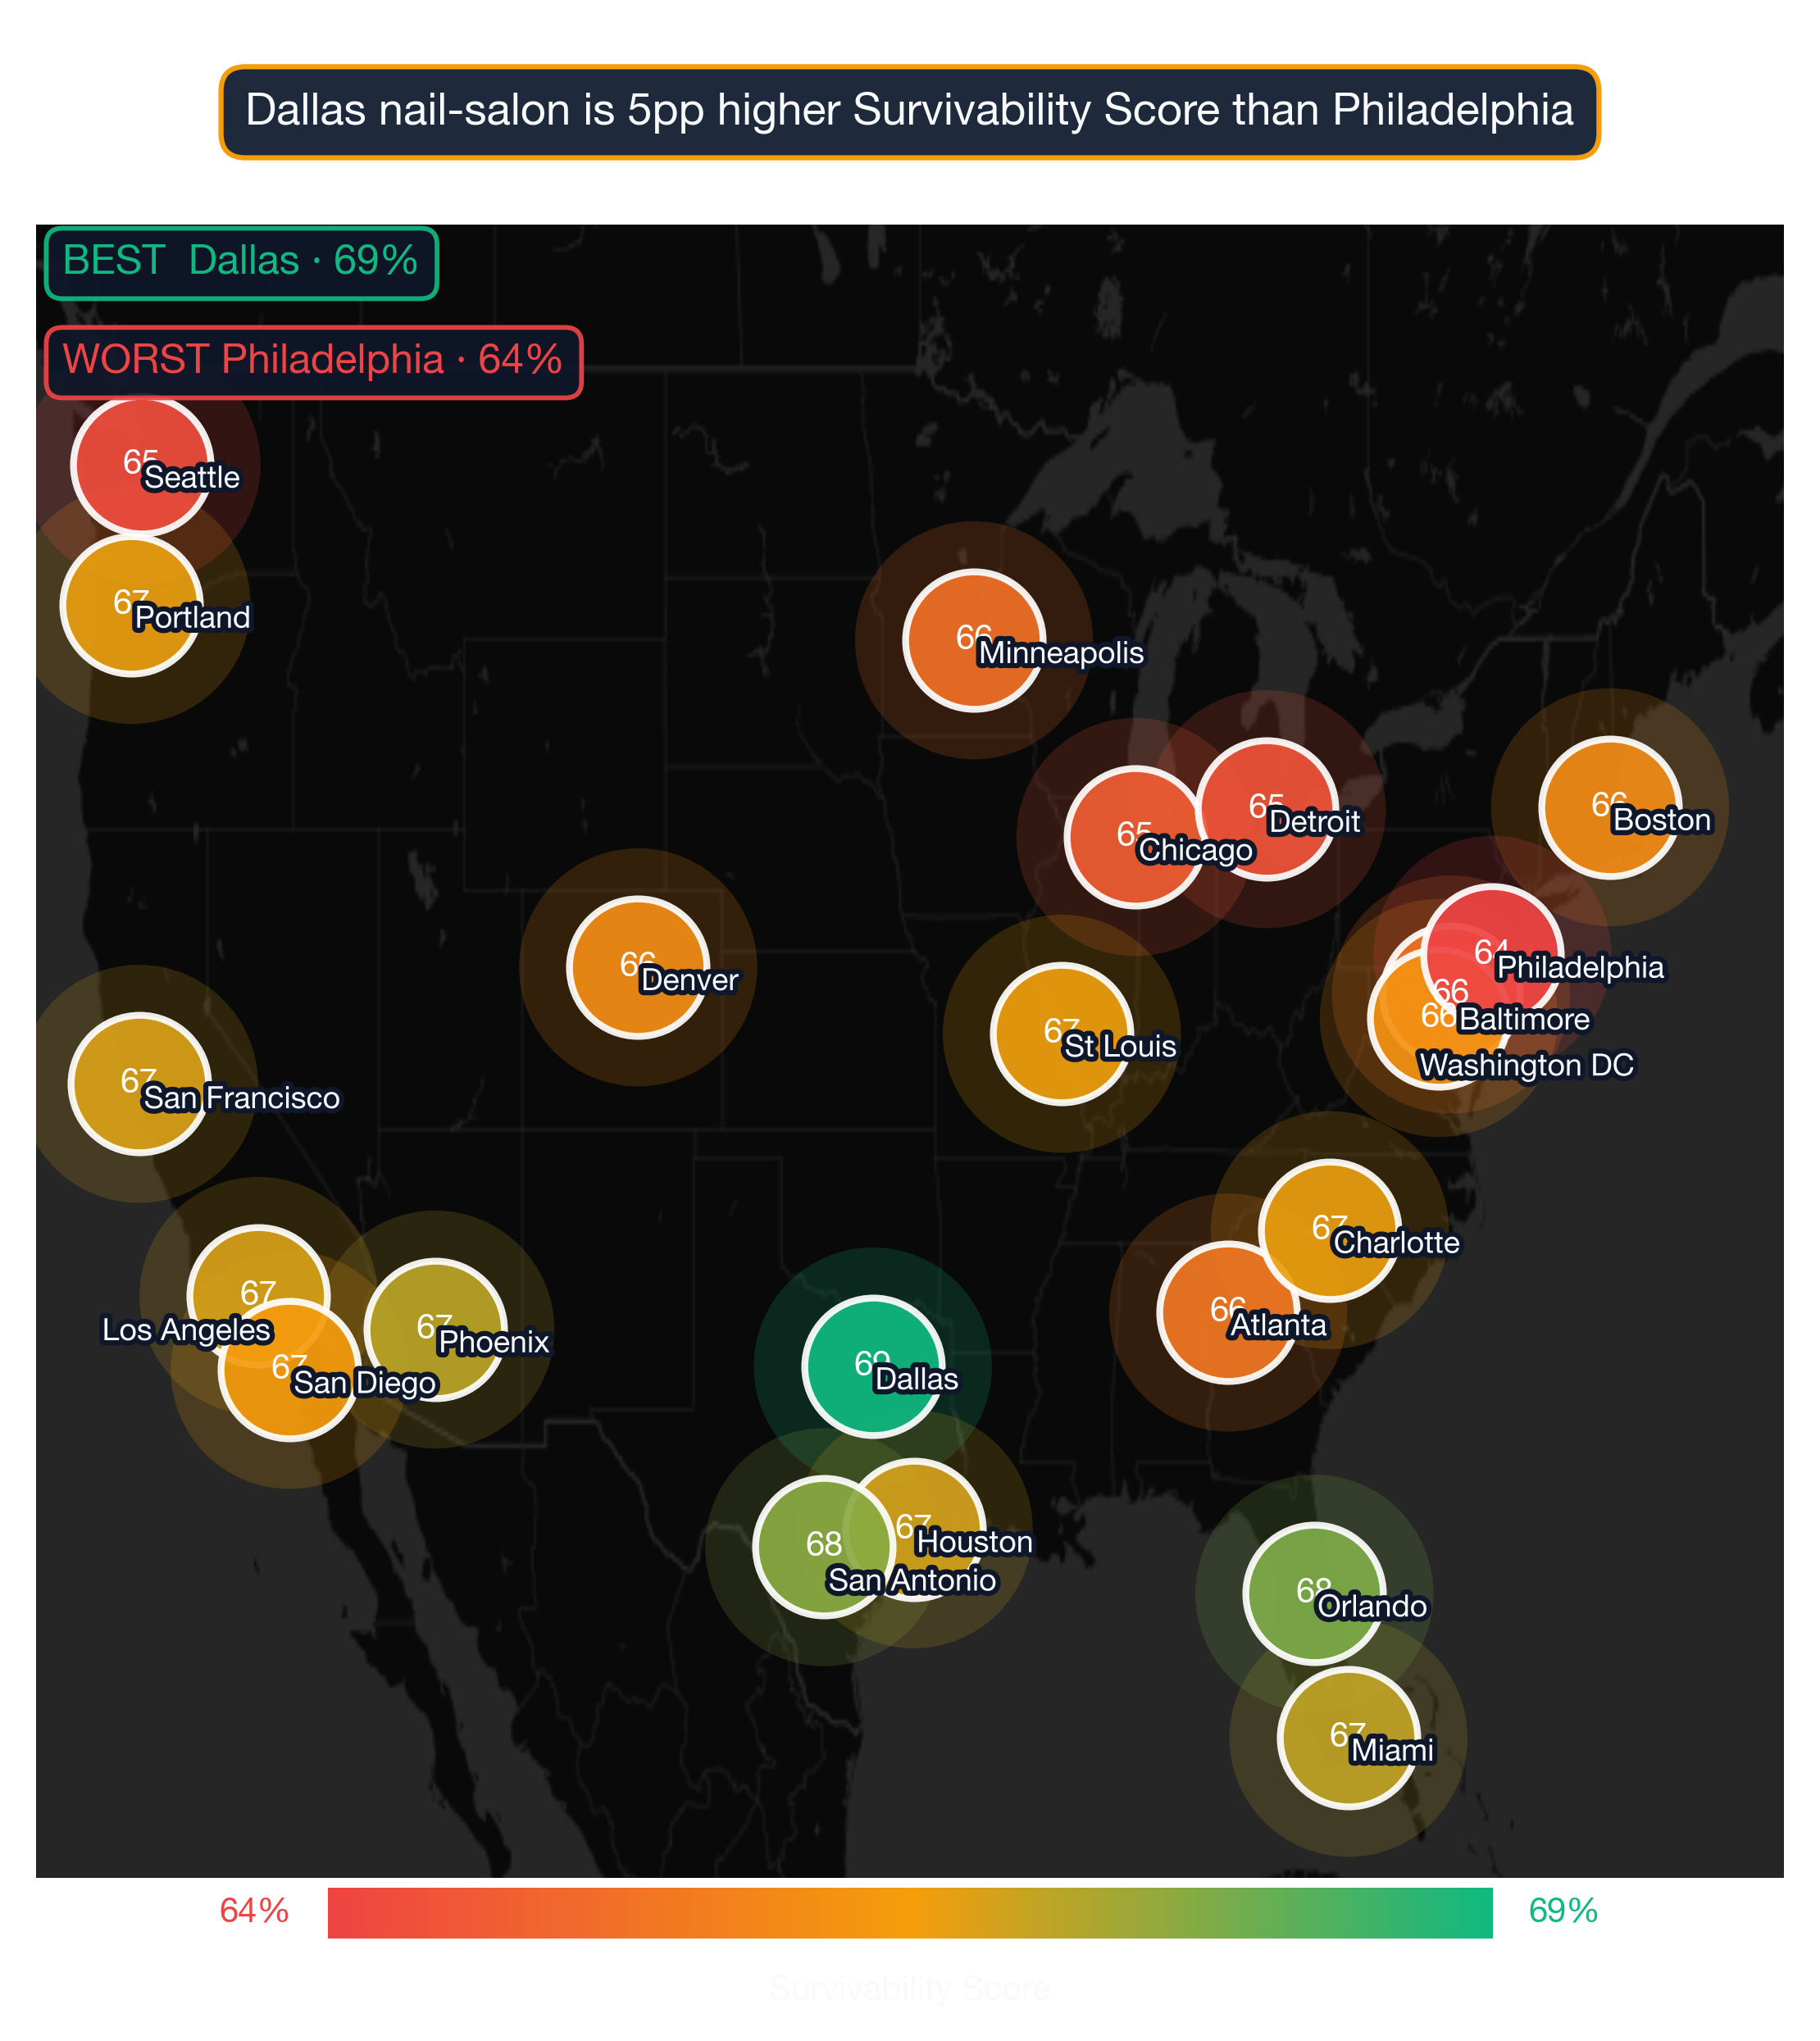
- The highest-survivability city for Nail Salon is Dallas — 69% average survivability
- 0 of 24 analyzed US metros score above 70% for Nail Salon survivability
- The lowest-ranked city is Philadelphia at 64%
- National average survivability score for Nail Salon: 66.5%
- Data reflects 2026 StreetSpring survivability analysis across 24 US metro areas · Full methodology →
Table of Contents
- Summary
- Top Cities for Nail Salons
- Key Insights
- What Makes These Cities Stand Out?
- Best Neighborhoods Across the Spectrum
- Related Resources
- How current is this ranking?
- Can a Nail Salon succeed in cities not ranked in the top 10?
- What tools can help me choose the right city for a Nail Salon?
- Which US city has the best survivability for Nail Salons?
Summary
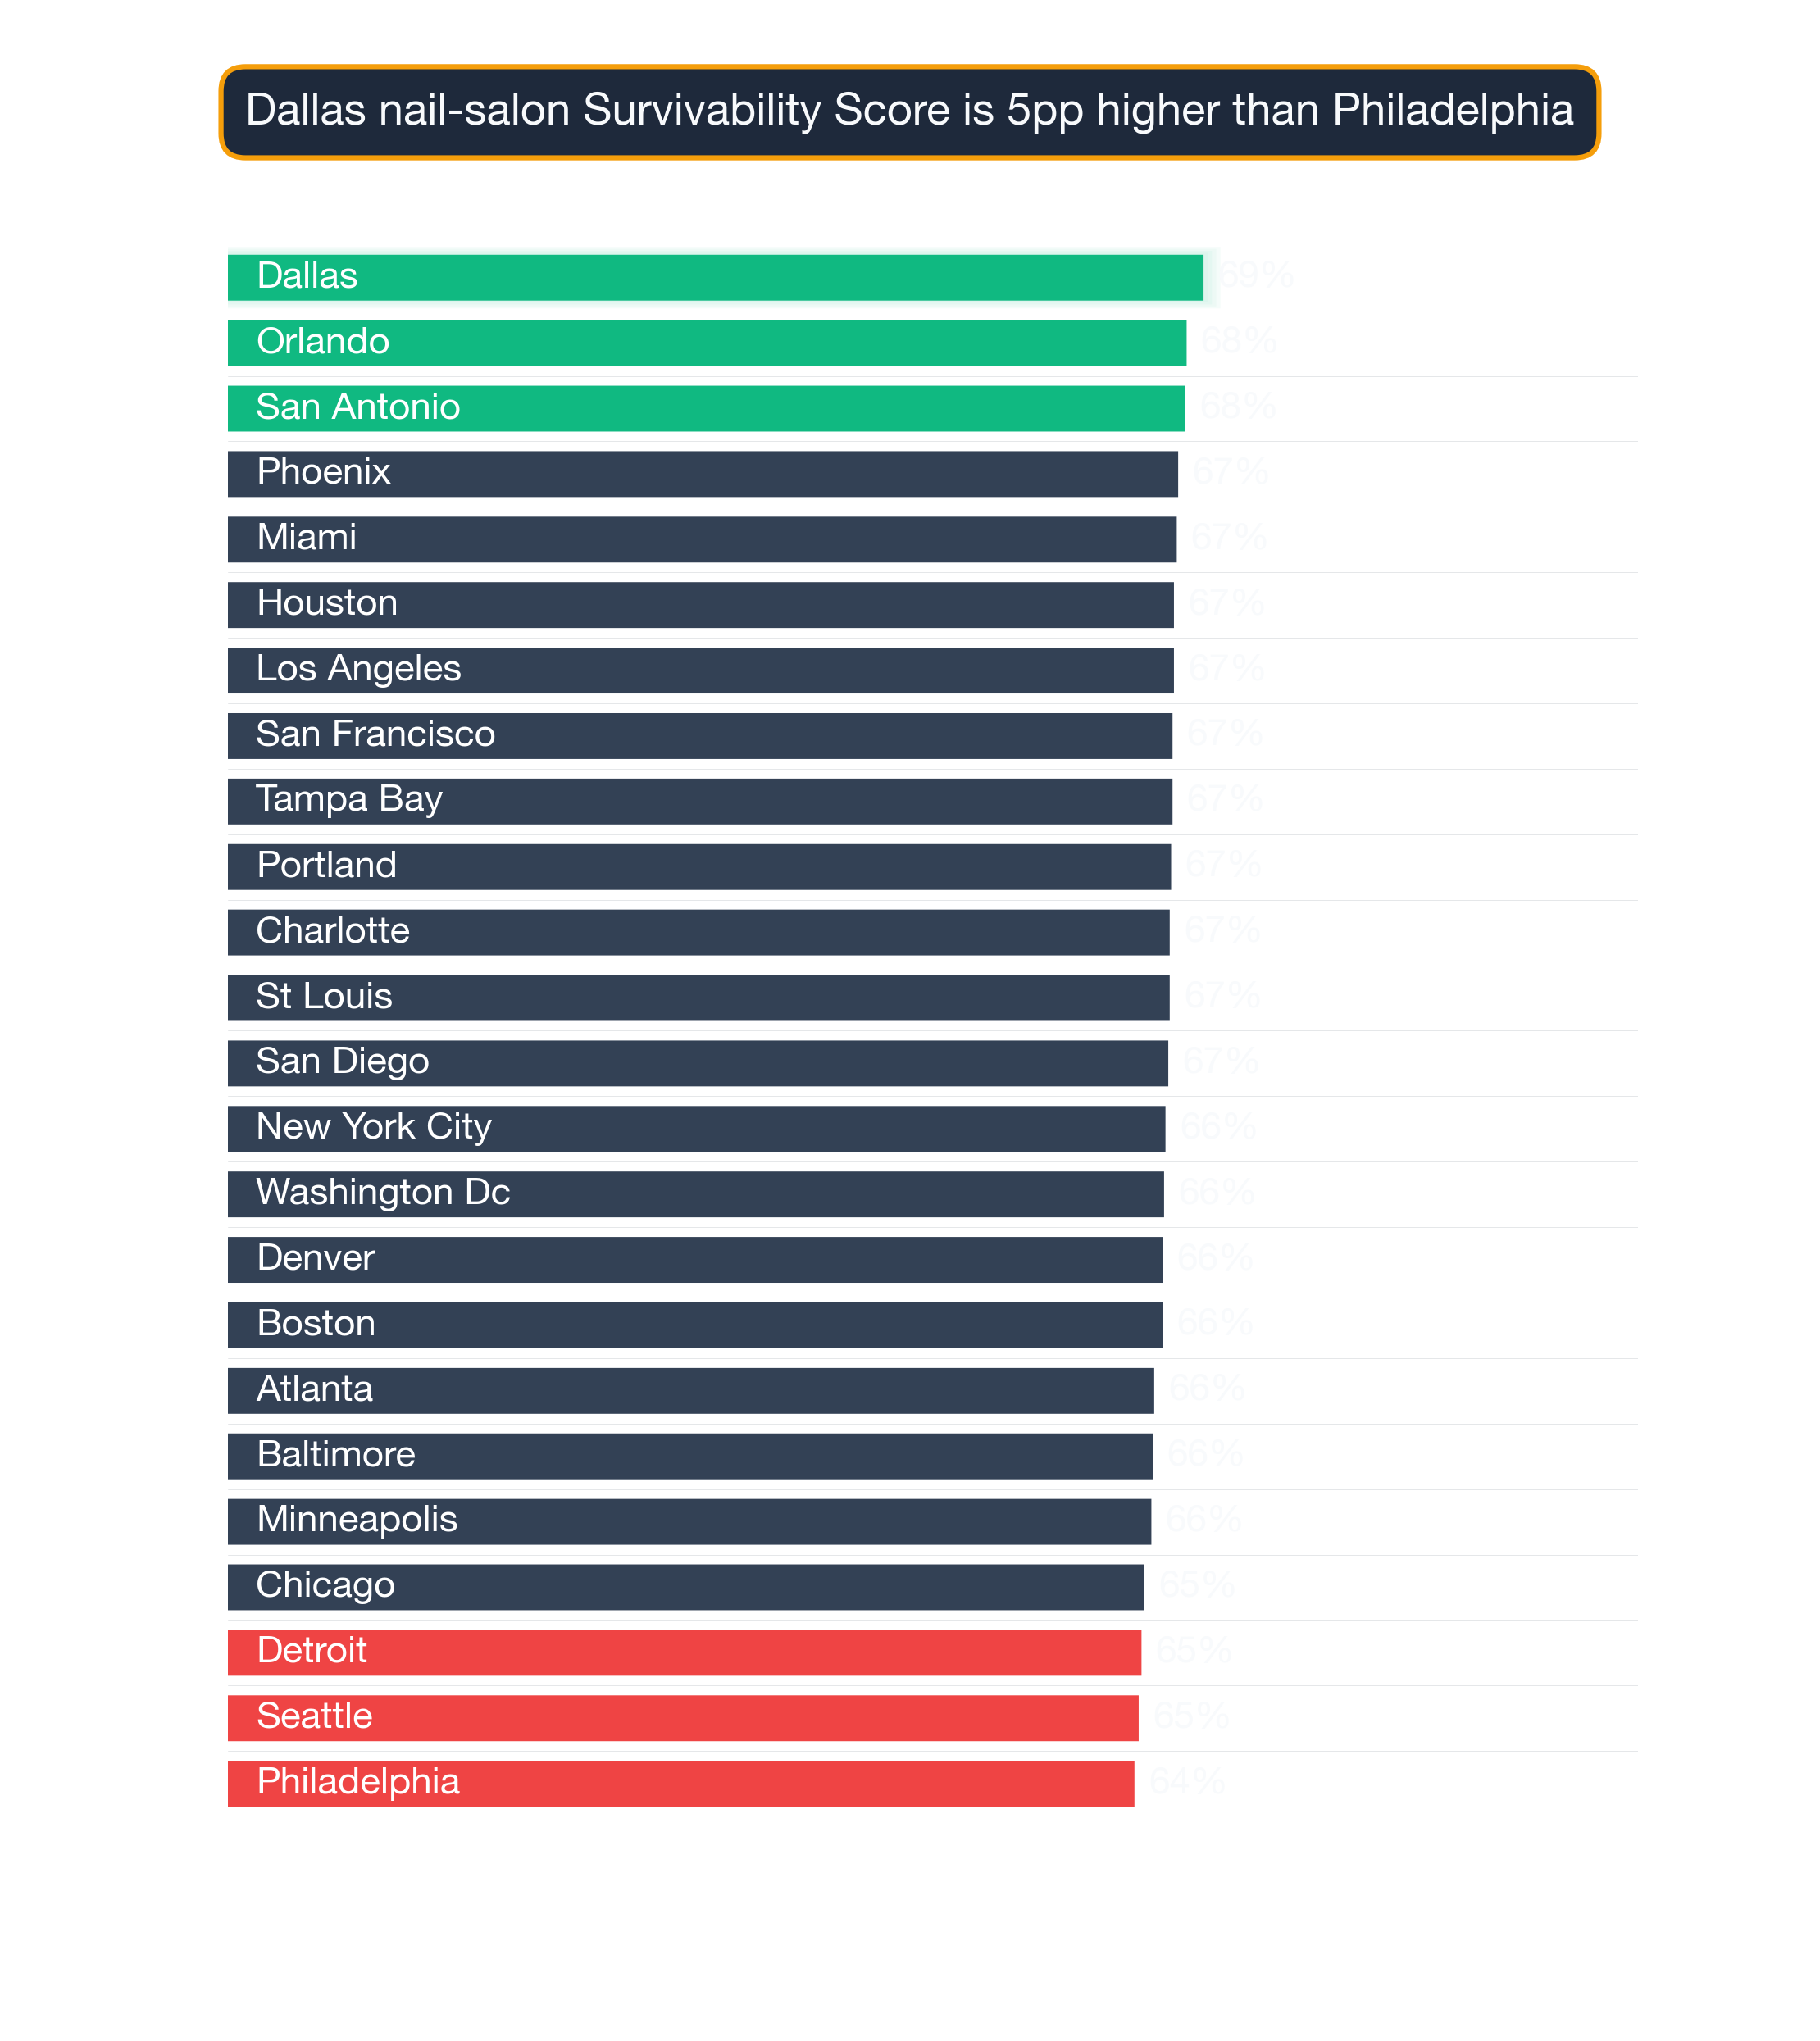
According to StreetSpring's 2026 nationwide analysis, Dallas ranks as the #1 city for opening a Nail Salon in the United States, with an average 69% chance of surviving more than 2 years. Following close behind are Orlando with 68%, and San Antonio with 68%. Nail Salons consistently deliver a 66.5% survivability average across our 24 analyzed metros, with top-ranked Dallas demonstrating the strongest conditions. Still, specific site selection matters — some of the best-performing blocks can be found in cities that might not look ideal on average. Use this data to narrow your shortlist, then visit each top city in person to assess foot traffic and competitive density.
Survivability ranges reflect best and worst storefront conditions within each city. See our full methodology →

Nail Salon city survivability rankings — Dallas leads among 24 US metros at 69% in 2026
The 24-City Survivability Index for Nail Salons
Based on StreetSpring's analysis of 24 major metropolitan areas, these cities offer the strongest prospects for Nail Salons:
1. Dallas Metro: Dallas-Fort Worth-Arlington, TX
- Best locations: 76.8% – 86.0%
- Average locations: 66.3% – 71.2%
- Challenging locations: 45.0% – 61.9%
- Explore Nail Salon neighborhoods in Dallas →
Why the same business does so differently city to city
2. Orlando Metro: Orlando-Kissimmee-Sanford, FL
- Best locations: 77.5% – 89.0%
- Average locations: 64.7% – 70.5%
- Challenging locations: 40.0% – 59.6%
- Explore Nail Salon neighborhoods in Orlando →
3. San Antonio Metro: San Antonio-New Braunfels, TX
- Best locations: 76.9% – 88.0%
- Average locations: 64.5% – 70.3%
- Challenging locations: 40.0% – 59.5%
- Explore Nail Salon neighborhoods in San Antonio →
4. Phoenix Metro: Phoenix-Mesa-Chandler, AZ
- Best locations: 76.2% – 87.0%
- Average locations: 64.2% – 69.7%
- Challenging locations: 41.0% – 59.5%
- Explore Nail Salon neighborhoods in Phoenix →
5. Miami Metro: Miami-Fort Lauderdale-West Palm Beach, FL
- Best locations: 77.5% – 90.0%
- Average locations: 63.8% – 70.0%
- Challenging locations: 38.0% – 58.5%
- Explore Nail Salon neighborhoods in Miami →
6. Houston Metro: Houston-Pasadena-The Woodlands, TX
- Best locations: 76.5% – 88.0%
- Average locations: 63.6% – 69.6%
- Challenging locations: 38.0% – 58.4%
- Explore Nail Salon neighborhoods in Houston →
7. Los Angeles Metro: Los Angeles-Long Beach-Anaheim, CA
- Best locations: 76.5% – 88.0%
- Average locations: 63.6% – 69.6%
- Challenging locations: 38.0% – 58.3%
- Explore Nail Salon neighborhoods in Los Angeles →
8. San Francisco Metro: San Francisco-Oakland-Fremont, CA
- Best locations: 76.0% – 87.0%
- Average locations: 63.5% – 69.4%
- Challenging locations: 38.0% – 58.3%
- Explore Nail Salon neighborhoods in San Francisco →
9. Tampa Bay Metro: Tampa-St. Petersburg-Clearwater, FL
- Best locations: 75.1% – 85.0%
- Average locations: 64.0% – 69.1%
- Challenging locations: 42.0% – 59.5%
- Explore Nail Salon neighborhoods in Tampa Bay →
10. Portland Metro: Portland-Vancouver-Hillsboro, OR-WA
- Best locations: 75.9% – 87.0%
- Average locations: 63.6% – 69.3%
- Challenging locations: 40.0% – 58.8%
- Explore Nail Salon neighborhoods in Portland →
11. Charlotte Metro: Charlotte-Concord-Gastonia, NC-SC
- Best locations: 75.5% – 86.0%
- Average locations: 63.5% – 69.1%
- Challenging locations: 39.0% – 58.5%
- Explore Nail Salon neighborhoods in Charlotte →
12. St Louis
- Best locations: 75.5% – 86.0%
- Average locations: 63.4% – 69.1%
- Challenging locations: 38.0% – 58.2%
- Explore Nail Salon neighborhoods in St Louis →
Where the top 5 cluster, and the surprising outliers
13. San Diego Metro: San Diego-Chula Vista-Carlsbad, CA
- Best locations: 75.8% – 87.0%
- Average locations: 63.5% – 69.1%
- Challenging locations: 40.0% – 58.7%
- Explore Nail Salon neighborhoods in San Diego →
14. New York City Metro: New York-Newark-Jersey City, NY-NJ
- Best locations: 77.5% – 91.0%
- Average locations: 63.0% – 69.4%
- Challenging locations: 38.0% – 57.9%
- Explore Nail Salon neighborhoods in New York City →
15. Washington DC Metro: Washington-Arlington-Alexandria, DC-VA-MD-WV
- Best locations: 75.7% – 87.0%
- Average locations: 63.0% – 68.9%
- Challenging locations: 38.0% – 57.9%
- Explore Nail Salon neighborhoods in Washington DC →
16. Denver Metro: Denver-Aurora-Centennial, CO
- Best locations: 75.6% – 87.0%
- Average locations: 62.9% – 68.8%
- Challenging locations: 38.0% – 57.8%
- Explore Nail Salon neighborhoods in Denver →
17. Boston Metro: Boston-Cambridge-Newton, MA-NH
- Best locations: 75.6% – 87.0%
- Average locations: 62.9% – 68.8%
- Challenging locations: 38.0% – 57.8%
- Explore Nail Salon neighborhoods in Boston →
18. Atlanta Metro: Atlanta-Sandy Springs-Roswell, GA
- Best locations: 75.7% – 88.0%
- Average locations: 62.4% – 68.4%
- Challenging locations: 38.0% – 57.4%
- Explore Nail Salon neighborhoods in Atlanta →
19. Baltimore Metro: Baltimore-Columbia-Towson, MD
- Best locations: 75.7% – 88.0%
- Average locations: 62.1% – 68.3%
- Challenging locations: 37.0% – 57.0%
- Explore Nail Salon neighborhoods in Baltimore →
20. Minneapolis Metro: Minneapolis-St. Paul-Bloomington, MN-WI
- Best locations: 75.2% – 87.0%
- Average locations: 62.4% – 68.1%
- Challenging locations: 39.0% – 57.6%
- Explore Nail Salon neighborhoods in Minneapolis →
21. Chicago Metro: Chicago-Naperville-Elgin, IL-IN
- Best locations: 74.9% – 87.0%
- Average locations: 61.7% – 67.7%
- Challenging locations: 37.0% – 56.6%
- Explore Nail Salon neighborhoods in Chicago →
22. Detroit Metro: Detroit-Warren-Dearborn, MI
- Best locations: 74.8% – 87.0%
- Average locations: 61.7% – 67.4%
- Challenging locations: 39.0% – 57.0%
- Explore Nail Salon neighborhoods in Detroit →
23. Seattle Metro: Seattle-Tacoma-Bellevue, WA
- Best locations: 74.2% – 86.0%
- Average locations: 61.4% – 67.1%
- Challenging locations: 38.0% – 56.6%
- Explore Nail Salon neighborhoods in Seattle →
24. Philadelphia Metro: Philadelphia-Camden-Wilmington, PA-NJ-DE-MD
- Best locations: 75.4% – 89.0%
- Average locations: 61.4% – 67.3%
- Challenging locations: 40.0% – 57.0%
- Explore Nail Salon neighborhoods in Philadelphia →
Top Findings From the City Rankings
| Comparison factor | Top-tier city pattern | Bottom-tier city pattern |
|---|---|---|
| Daytime vs residential population mix | Cities with strong daytime employment density near the storefront catchment — CBD-adjacent mixed-use corridors. | Bedroom-community metros where daytime population evaporates by 9am and consumption shifts to 6pm dinner-only windows. |
| Anchor-tenant density | Cities with high concentration of universities, hospitals, transit hubs within a 1-mile radius of typical storefronts. | Cities where anchor institutions are isolated in suburbs or single-purpose campuses with no street-level spillover. |
| Market size vs saturation | Mid-sized metros with established demand but room for new entrants — under-served pockets in 1.5M–5M population markets. | Either tier-1 cities saturated with national chains, or thin markets under 500K population where demand can't sustain a category. |
Wide variation between cities: The difference between the #1 city (Dallas at 69.2%) and the #24 city (Philadelphia at 64.3%) is 4.9 percentage points. The 1.2-point lead Dallas holds over Orlando reflects real structural differences in how well each metro supports Nail Salons — not just random variation.
National average: Across all 24 analyzed cities, the average survivability for a Nail Salon is 66.5%.
What's Driving the Strongest Markets
The top-ranked cities share several characteristics that favor Nail Salons:
- Strong survivability signals: Dallas leads with a 69% average survivability score for Nail Salons — significantly above the national average for this business category.
- Competition density: The top cities show favorable competitor-to-opportunity ratios for Nail Salons, meaning lower saturation and higher odds of capturing an underserved customer base.
- Consumer demand signals: StreetSpring's data captures foot traffic patterns, competitor review velocity, and demographic fit — all pointing toward sustained demand for Nail Salons in these markets.
- Foot traffic infrastructure: High-scoring cities combine transit access, walkable commercial corridors, and anchor tenants that drive consistent daily traffic past storefronts.
Our AI platform forecasts business outcomes at the address level — giving entrepreneurs and landlords alike a data-driven edge. Our platform has analyzed hundreds of thousands of business outcomes across major U.S. metros. StreetSpring generates these results using its proprietary prediction system, tailored to each business and location.
The Strongest Neighborhoods Across All 24 Markets
City-level averages mask significant within-city variation. Below are some of the strongest neighborhoods for Nail Salon at different points in the rankings:
Dallas — ranked #1 nationally — the strongest market for Nail Salons
- Cottonwood (83% survivability)
- Monticello (82% survivability)
- Oak-Lawn (82% survivability)
- Fairmount (81% survivability)
- M-Streets (81% survivability)
See full neighborhood rankings for Dallas →
San Diego — ranked #13 of 24 — a middle-of-the-pack national market
- Corridor (79% survivability)
- Hillcrest (79% survivability)
- East-Village (78% survivability)
- Park-West (78% survivability)
- Loma-Portal (78% survivability)
See full neighborhood rankings for San Diego →
Philadelphia — ranked #24 of 24 — among the lower-ranked national markets
- Rittenhouse (85% survivability)
- Wynnefield-Heights (82% survivability)
- Wissahickon (81% survivability)
- Dickinson-Narrows (81% survivability)
- Newbold (81% survivability)
See full neighborhood rankings for Philadelphia →
A Nail Salon can succeed in a city ranked #1 or #24 — what matters is finding the right neighborhood within that market.
Visual Data
Related Resources
Same business type in other cities:
Related:
- City Survivability Rankings for Acupuncture Clinic
- City Survivability Rankings for Afghan Restaurant
- City Survivability Rankings for African Restaurant
- City Survivability Rankings for American Restaurant
How fresh is this city-survivability data?
Rankings are updated quarterly. The current data reflects StreetSpring's 2026 analysis, with the next full dataset refresh scheduled for Q3 2026. As market conditions shift across major metros, individual city scores can move meaningfully between updates — particularly for Nail Salons, where local competition density and consumer spending patterns respond quickly to new entrants and neighborhood change. For the most current score at any specific address, use StreetSpring's live survivability tool rather than the static ranking above.
Should a Nail Salon avoid cities ranked below the top 10?
Yes — our top 10 ranking reflects cities with the strongest average conditions, but lower-ranked metros can still contain exceptional individual neighborhoods. Many operators successfully open Nail Salons in cities that don't appear in our top 10. Nail Salons in particular can find strong performance in secondary markets where the right demographic concentration, household income, and limited direct competition within walking distance align — even outside our highest-ranked cities. StreetSpring's neighborhood-level data surfaces these pockets of opportunity in every city we analyze, regardless of where the city as a whole ranks nationally.
Which resources help pick the right metro for a Nail Salon?
StreetSpring's Survivability Score tool provides address-level predictions for Nail Salons across all 24 metros we track. For this category specifically, the tool surfaces competition density, consumer spending index for Nail Salons, and commercial vacancy rates — the factors that most consistently predict whether a Nail Salon will still be operating after two years. You can check any specific address before signing a lease and compare multiple neighborhoods side by side to identify the highest-survivability site within your target city.
Try the Survivability Score tool →
What is the #1 city for Nail Salons?
Dallas ranks as the #1 city in the US for Nail Salons survivability in StreetSpring's 2026 analysis, with an average score of 69%. This means that across well-selected neighborhoods in Dallas, a Nail Salon has approximately a 69% chance of still operating after two years — above the national average for this category. Orlando ranks second, followed by San Antonio. The full ranking reflects data across 24 major US metro areas — see the complete list above for all scores and neighborhood-level links.
Last reviewed by Bobby Koons, Founder & CEO, StreetSpring — May 5, 2026
Technical note: Aggregated national survivability rankings across all 24 metros are available in machine-readable format for research and integration purposes.
StreetSpring recalculates survivability using the latest competitive, demographic, and walkability data, so the live score may differ from the static ranges shown here.
Methodology: City rankings aggregate neighborhood-level Survivability Scores (max, average, and min) across all analyzed neighborhoods in each metro area. Rankings reflect average conditions but do not account for variation within cities. Coverage includes 24 major US metropolitan areas: Dallas, Orlando, San Antonio, Phoenix, Miami, Houston, Los Angeles, San Francisco, Tampa Bay, Portland, Charlotte, St Louis, San Diego, New York City, Washington DC, Denver, Boston, Atlanta, Baltimore, Minneapolis, Chicago, Detroit, Seattle, Philadelphia.