National Neighborhood Survivability Rankings for Dessert Shop
StreetSpring's 2026 nationwide analysis ranks the top neighborhoods across all major US cities for Dessert Shops. See which neighborhoods offer the highest Survivability Scores.
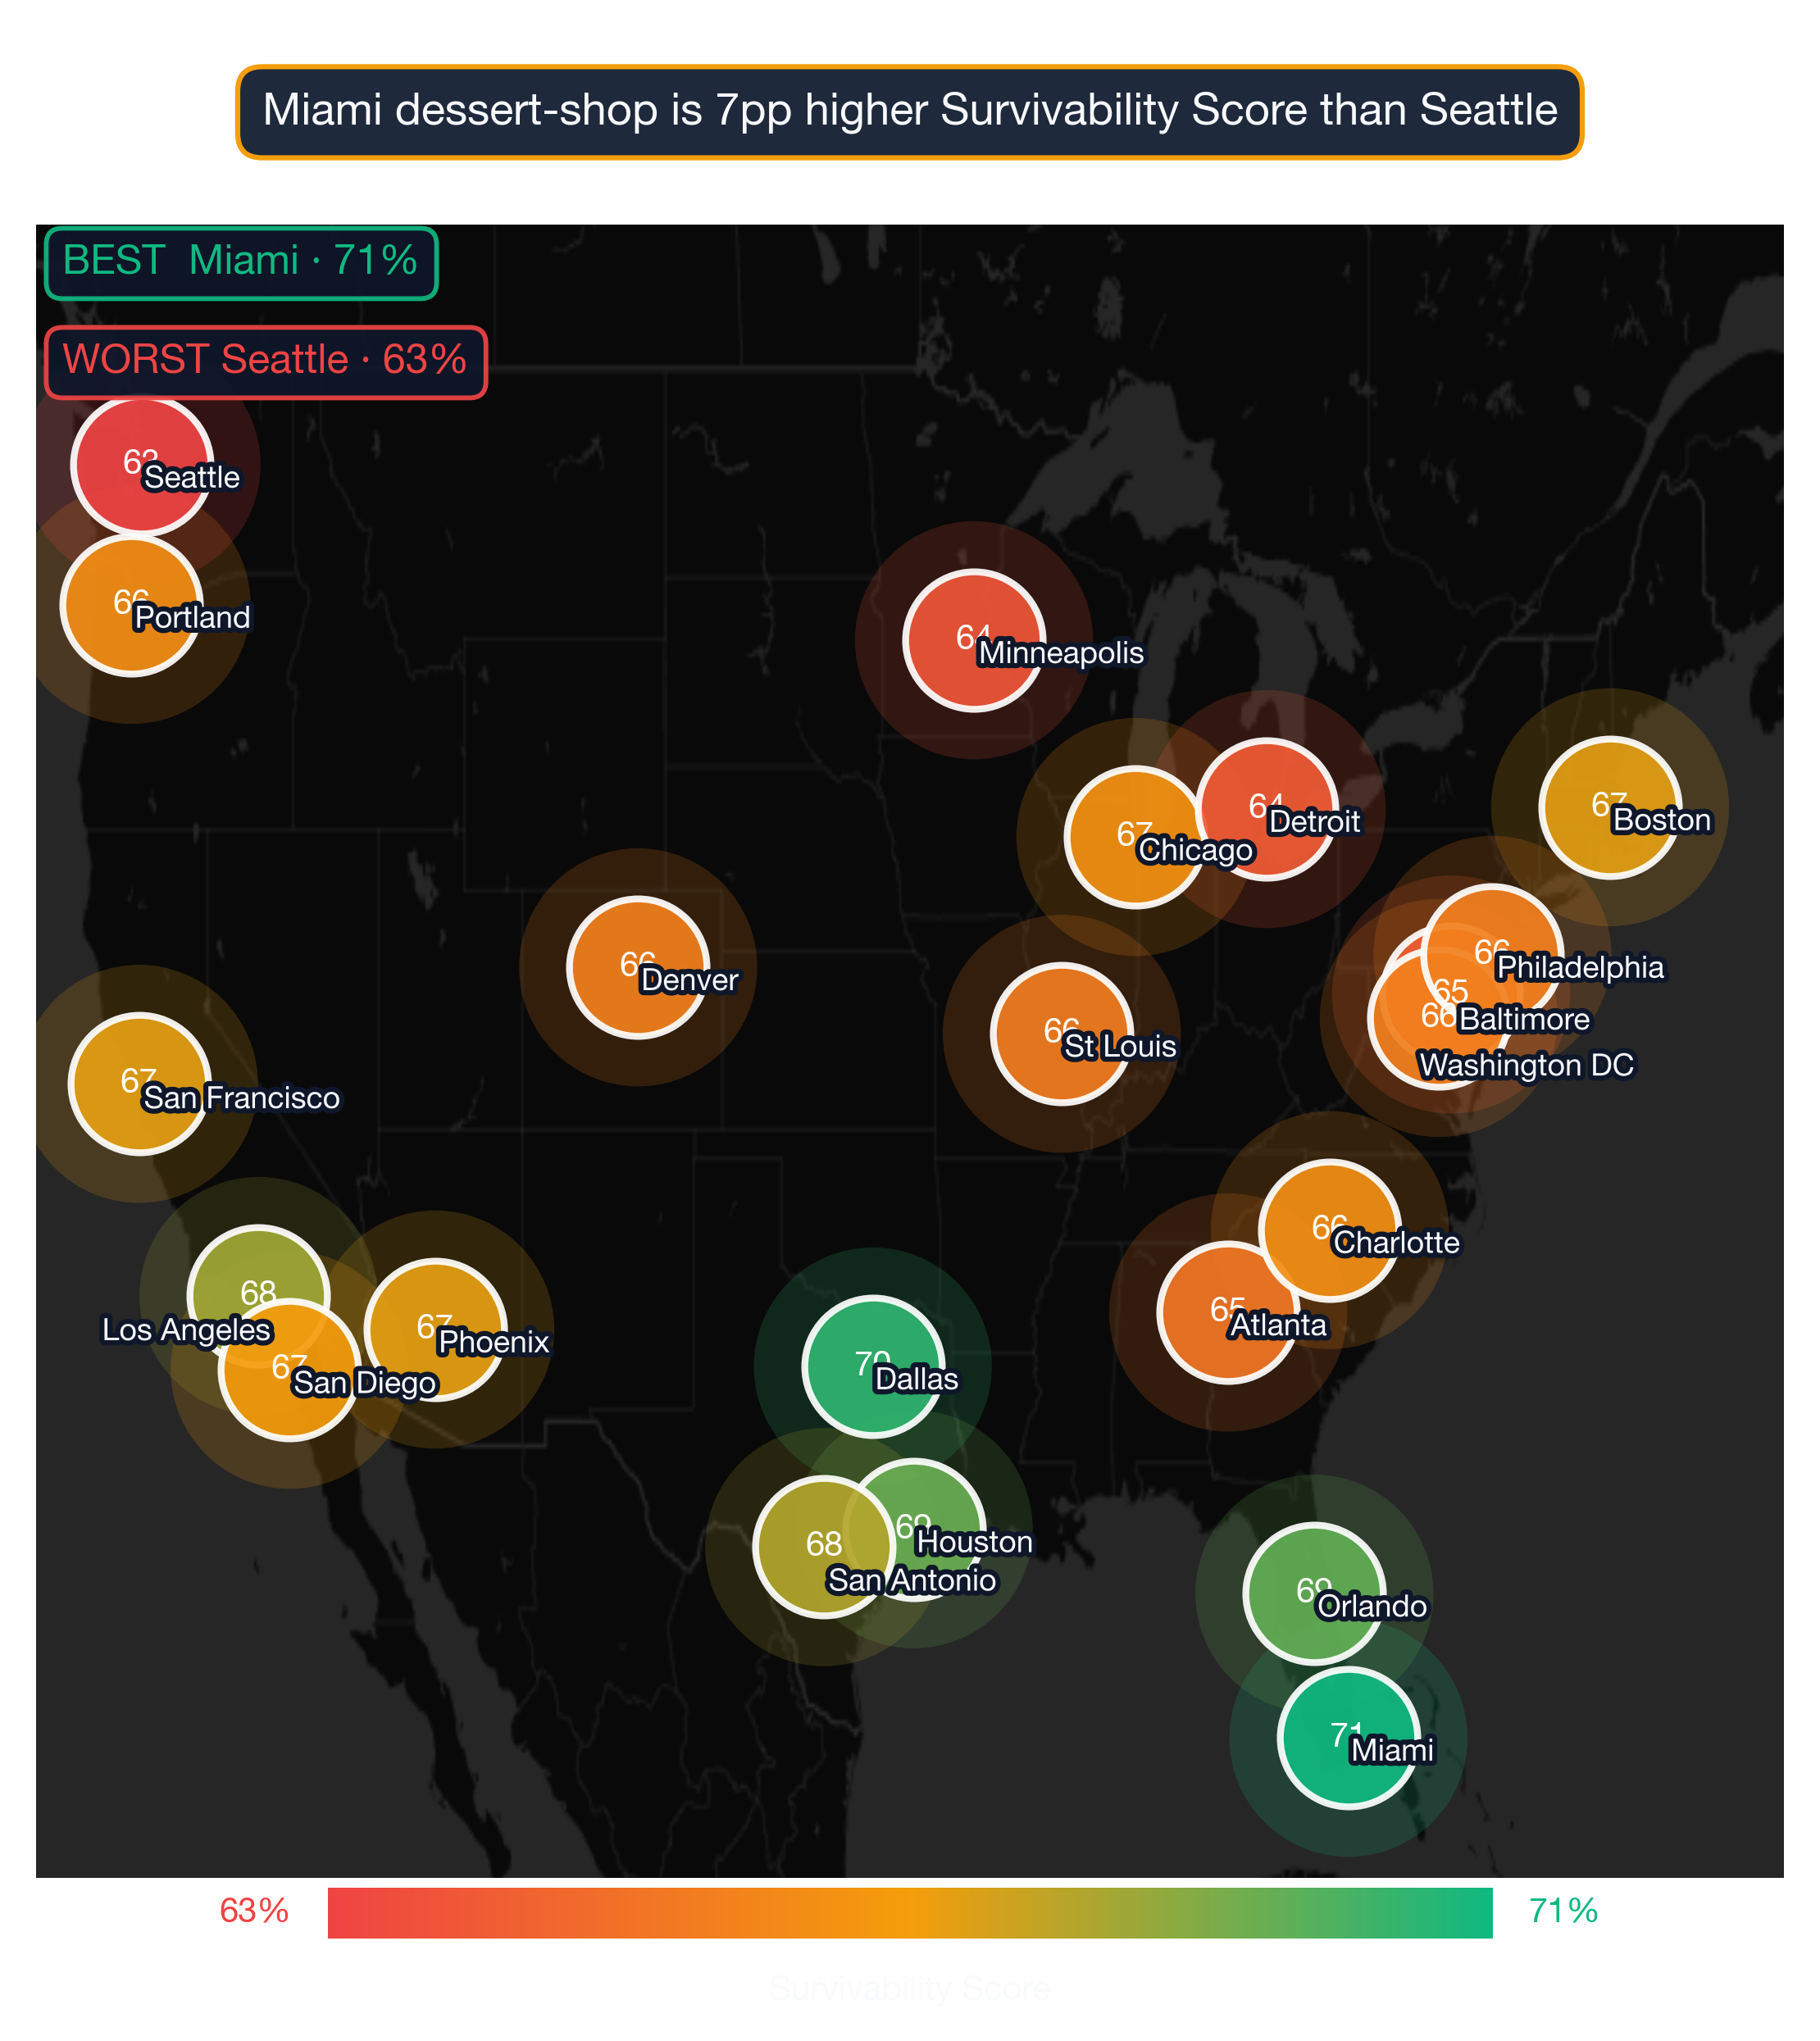
Of all neighborhoods across the US analyzed in 2026, McArthur in Dallas offers the highest survivability for Dessert Shop operators at 83%. The top 25 neighborhoods nationwide span 8 different cities, demonstrating that exceptional opportunities for Dessert Shops exist across diverse markets. Neighborhood rankings are useful, but the exact odds for your location can only be seen by running a current survivability check in StreetSpring.
To understand the methodology behind these rankings, see our detailed guide: Survivability Score: How We Calculate It & Why It Matters.
Reviewed: May 7, 2026 by Bobby Koons, StreetSpring founder
Quick Summary
- #1 Neighborhood: McArthur, Dallas — 83% survivability for Dessert Shop
- Neighborhoods analyzed: 1426 across 24 major US cities
- National average survivability: 71.3% for Dessert Shops
- Top-25 average: 81.2% — 9.9% above national average
- Data current as of: 2026 · Full methodology →
Table of Contents
- How neighborhoods compare nationwide
- Top 25 neighborhoods in the US
- Geographic patterns
- How to use this ranking
- Related resources
- Frequently asked questions
How do US neighborhoods stack up for Dessert Shops?
Analyzing 1426 neighborhoods across 24 major US cities, StreetSpring's 2026 data shows that the best neighborhoods for Dessert Shops significantly outperform average locations, with the top 25 neighborhoods nationwide averaging 81.2% survivability compared to the national neighborhood average of 71.3%.
This 9.9% advantage illustrates how critical neighborhood selection is — choosing a top-tier neighborhood versus an average one can significantly increase your long-term survival chances.
What separates the top neighborhoods for Dessert Shops from the national average is not simply higher foot traffic — it is a favorable ratio of consumer spending on this category to competitive supply. The 9.9% advantage that top neighborhoods hold is built on structural conditions: the right consumer demographics, manageable competition density, and mobility patterns that route target customers past the storefront. We apply advanced machine learning to massive commercial real estate datasets to build accurate models.
Importantly, top-performing neighborhoods aren't concentrated in just a few cities. The top 25 neighborhoods represent 8 different cities. This means entrepreneurs focused on Dessert Shops can find exceptional opportunities across the United States, not just in traditionally strong markets.
A great product in the wrong location will underperform; an average product in the right location can thrive.
The strongest US neighborhoods for opening a Dessert Shop
| Comparison factor | Where high-survivability neighborhoods excel | Where lower-survivability neighborhoods fall short |
|---|---|---|
| Storefront vacancy + churn signal | Neighborhoods with low recent vacancy and steady operator continuity in similar subtypes. | Neighborhoods with elevated commercial vacancy or repeated tenant turnover in the same storefronts. |
| Complementary subtype clustering | Neighborhoods with multiple complementary subtypes within 2 blocks (e.g., fitness + smoothie + athletic apparel). | Neighborhoods where the subtype is isolated from complementary anchors, requiring all foot-traffic to be destination-driven. |
| Walk Score + foot-traffic alignment | Neighborhoods where Walk Score (90+) matches actual measured pedestrian volume — not just street-grid promise. | High Walk Score scores driven by transit density but with sparse street-level retail engagement. |
What competitive moat each top neighborhood has
Survivability range for top, middle, and last-ranked neighborhoods. Box = best-to-challenging range; white line = average. McArthur, Dallas leads at 83% in 2026. Full methodology →
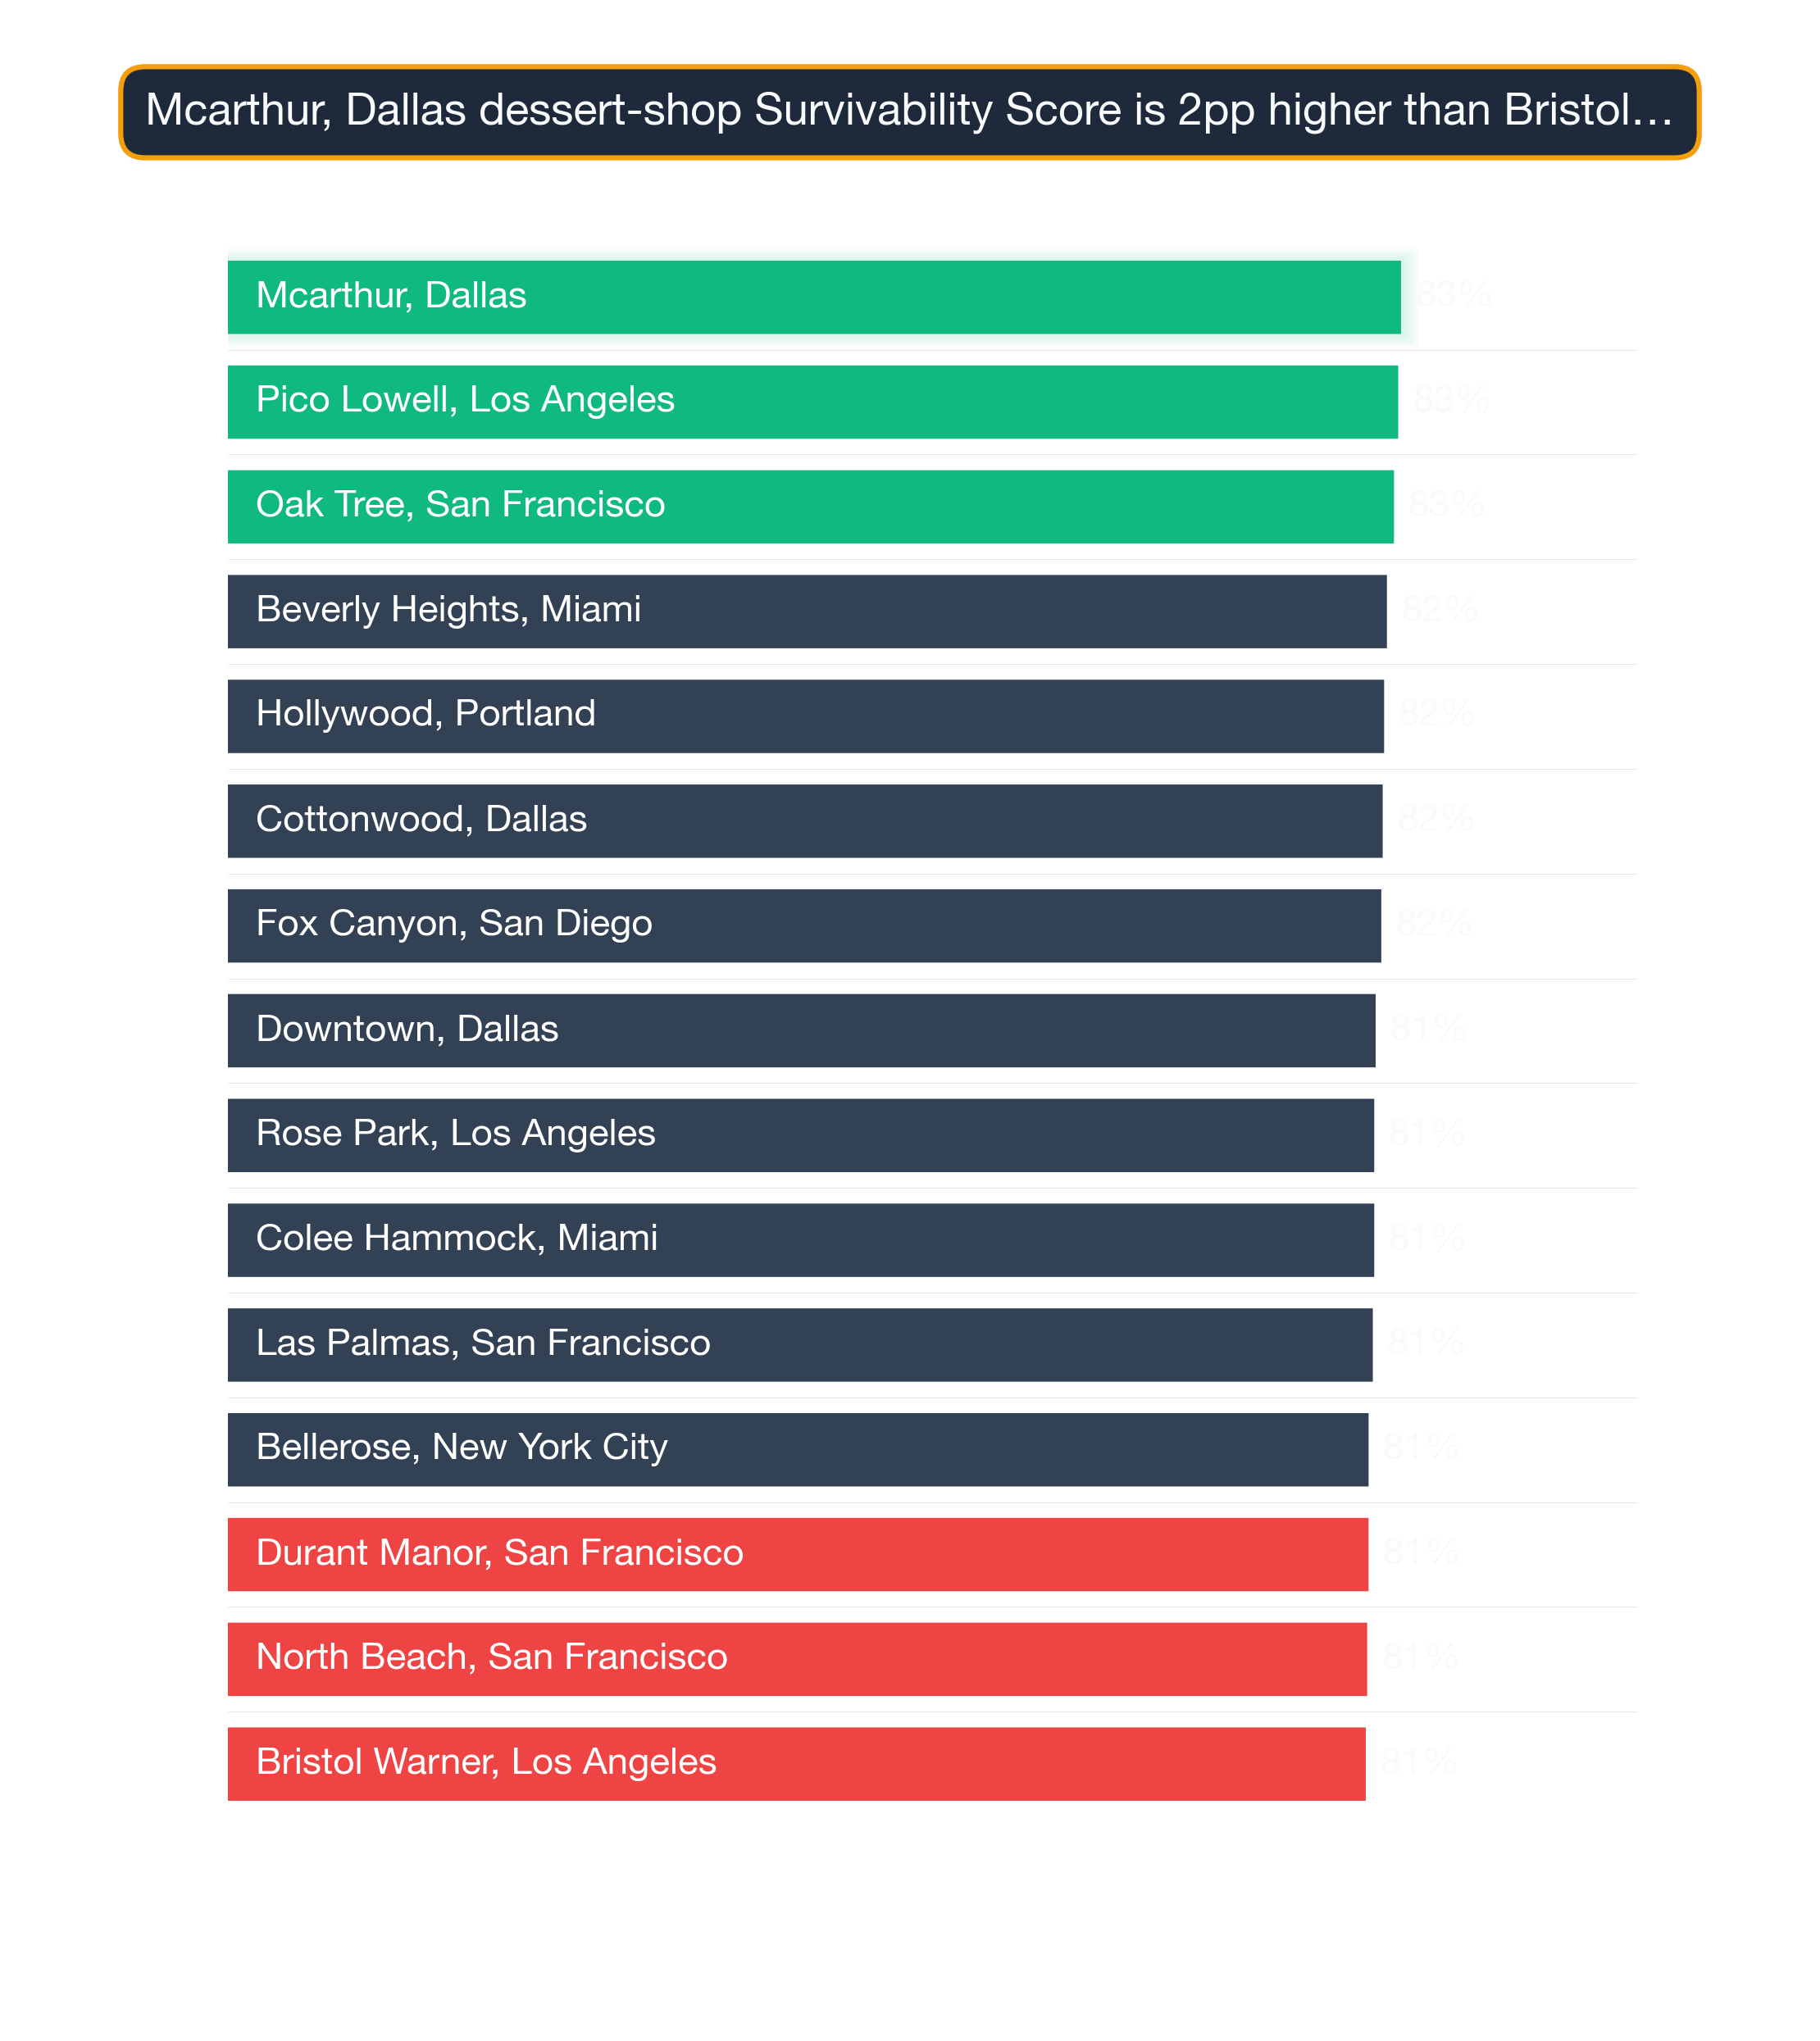
The top 25 neighborhoods nationwide for Dessert Shops are:
| # | Neighborhood | City | Avg Survival | Tier | Best Locations | Challenging Locations |
|---|---|---|---|---|---|---|
| 1 | McArthur | Dallas | 83.2% | Great | 84.9% | 81.1% |
| 2 | Pico-Lowell | Los Angeles | 83.0% | Great | 84.6% | 80.8% |
| 3 | Oak Tree | San Francisco | 82.7% | Great | 84.3% | 80.6% |
| 4 | Beverly Heights | Miami | 82.2% | Great | 83.9% | 80.1% |
| 5 | Hollywood | Portland | 82.0% | Great | 83.6% | 79.8% |
| 6 | Cottonwood | Dallas | 81.9% | Great | 83.6% | 79.8% |
| 7 | Fox Canyon | San Diego | 81.8% | Great | 83.4% | 79.6% |
| 8 | Downtown | Dallas | 81.4% | Great | 83.0% | 79.3% |
| 9 | Colee Hammock | Miami | 81.3% | Great | 82.9% | 79.1% |
| 10 | Rose Park | Los Angeles | 81.3% | Great | 82.9% | 79.1% |
| 11 | Las Palmas | San Francisco | 81.2% | Great | 82.8% | 79.0% |
| 12 | Durant Manor | San Francisco | 80.9% | Great | 82.5% | 78.8% |
| 13 | Bellerose | New York City | 80.9% | Great | 82.5% | 78.7% |
| 14 | North Beach | San Francisco | 80.8% | Great | 82.4% | 78.6% |
| 15 | Bristol-Warner | Los Angeles | 80.7% | Great | 82.4% | 78.6% |
| 16 | Roseway | Portland | 80.6% | Great | 82.3% | 78.5% |
| 17 | Harvard Heights | Los Angeles | 80.6% | Great | 82.2% | 78.5% |
| 18 | Wakefield | Washington DC | 80.5% | Great | 82.2% | 78.4% |
| 19 | East Side | Los Angeles | 80.5% | Great | 82.2% | 78.4% |
| 20 | Cobble Hill | New York City | 80.5% | Great | 82.1% | 78.3% |
| 21 | Valley Adams | Los Angeles | 80.4% | Great | 82.1% | 78.3% |
| 22 | Tremont | New York City | 80.3% | Great | 82.0% | 78.2% |
| 23 | Humboldt | Portland | 80.2% | Great | 81.8% | 78.0% |
| 24 | East Tremont | New York City | 80.0% | Great | 81.7% | 77.9% |
| 25 | Temescal | San Francisco | 80.0% | Good | 81.6% | 77.8% |
Top-ranked neighborhoods contain their own variation; a single block difference can shift survivability meaningfully, which is why address-level scoring matters.
For a full explanation of how survivability scores and ranges are calculated, see Survivability Score: How We Calculate It & Why It Matters.
Common signals across top-performing neighborhoods
City Concentration
The top 25 neighborhoods span 8 different cities, with Los Angeles claiming 6 of the top spots (24%).
Breakdown of top 25 neighborhoods by city:
- Los Angeles: 6 neighborhoods (24% of top 25) — View city guide
- San Francisco: 5 neighborhoods (20% of top 25) — View city guide
- New York City: 4 neighborhoods (16% of top 25) — View city guide
- Dallas: 3 neighborhoods (12% of top 25) — View city guide
- Portland: 3 neighborhoods (12% of top 25) — View city guide
- Miami: 2 neighborhoods (8% of top 25) — View city guide
- San Diego: 1 neighborhood (4% of top 25) — View city guide
- Washington DC: 1 neighborhood (4% of top 25) — View city guide
This distribution has practical implications for Dessert Shops operators: cities with multiple neighborhoods in the top 25 offer more site options within a single market, reducing relocation or expansion cost. Cities with a single top-25 neighborhood require more precise site selection — the advantage is concentrated in one area rather than spread across the metro.
Walkability vs. visibility — which wins?
The relatively even distribution of top neighborhoods across 8 cities is consistent with a category where consumer demand is broadly distributed rather than concentrated in specific metros. For Dessert Shops operators, this means strong site opportunities exist in multiple markets — the key variable is neighborhood-level competitive conditions rather than city-level market size.
Using neighborhood survivability to pick Dessert Shops sites
While nationwide neighborhood rankings identify standout markets, address-level analysis reveals even greater variation. Entrepreneurs and commercial real estate agents in 24 major metros trust StreetSpring's survivability predictions to make smarter site-selection decisions. Even within top-ranked neighborhoods, specific block selection can vary survivability by 10–20 percentage points.
For the most accurate assessment:
- Consider neighborhoods in the top 25 as strong starting points
- Examine city-specific guides for additional neighborhood options in your target markets
- Use StreetSpring's address-level tool to evaluate specific storefronts within these neighborhoods
- Factor in your budget, operational requirements, and target demographics
Each neighborhood has detailed analysis available through its city guide, providing block-by-block survivability data for Dessert Shops.
From national rank to your shortlist
See also: Best Cities for Dessert Shop — our city-level comparison ranks which metros offer the strongest overall conditions for Dessert Shops.
Cross-Subtype Synergy Across the Spectrum
Dessert Shop success and broader neighborhood quality often correlate. Below are top, middle, and bottom-ranked neighborhoods for Dessert Shops along with what else thrives in each:
Mcarthur, Dallas — ranked #1 nationally — the strongest neighborhood for Dessert Shops (83% survivability for Dessert Shop) Other business types that thrive in Mcarthur:
- Hawaiian Restaurant (84% survivability)
- Pet Boarding Facility (84% survivability)
- Georgian Restaurant (84% survivability)
Overlea, Baltimore — ranked #1426 of 1426 — among the lower-ranked national neighborhoods (55% survivability for Dessert Shop) Other business types that thrive in Overlea:
- Italian Restaurant (82% survivability)
- Kosher Restaurant (82% survivability)
- Ukrainian Restaurant (81% survivability)
These cross-subtype patterns show up consistently — the strongest neighborhoods for Dessert Shops aren't one-trick markets.
Visual Data
Related Resources
Explore top cities represented in these neighborhoods:
- Portland: Best businesses and neighborhoods
- New York City: Best businesses and neighborhoods
- Washington DC: Best businesses and neighborhoods
- Dallas: Best businesses and neighborhoods
- San Diego: Best businesses and neighborhoods
National city rankings: Best cities for Dessert Shops
Essential resources:
- How StreetSpring calculates Survivability Scores
- Site selection for landlords
- AI tools for tenant representatives
- StreetSpring vs competitors
Frequently Asked Questions
What makes McArthur in Dallas the best neighborhood for Dessert Shops?
McArthur in Dallas ranks #1 for Dessert Shops with 83% survivability. This reflects favorable competitive dynamics — fewer direct competitors relative to available consumer spending — strong demographic alignment with Dessert Shop customers, and local spending patterns that sustain this business category. StreetSpring's model weights these factors across all analyzed neighborhoods nationwide.
What type of neighborhood is best for opening a Dessert Shop?
The best neighborhoods for Dessert Shops share three characteristics: manageable competitive density (few existing direct competitors within the primary trade area), strong consumer spending on this category, and demographic alignment with the typical Dessert Shop customer base. In StreetSpring's 2026 data, the top-ranked neighborhoods for Dessert Shops combine these factors in a way that produces survivability scores well above the national average of 71.3%. Neighborhoods with dense existing competition or low category spending tend to score significantly lower, regardless of overall foot traffic or prestige.
What demographic factors drive survivability for Dessert Shops?
For Dessert Shops, StreetSpring's model incorporates neighborhood-level demographic data including population density, median household income, employment rates, and consumer spending on this specific category. These factors vary by business type — the demographic profile that drives survivability for Dessert Shop customers may differ significantly from what matters for other business categories.
Where can I download the underlying data?
The full national survivability dataset is available as a free download: https://streetspring.com/resources/data/national-survivability-scores-2026.csv. The CSV includes all business subtypes and neighborhoods covered in this analysis, licensed under CC BY 4.0.
Are there good opportunities outside the top 25 neighborhoods?
Absolutely. Our analysis covers 1426 neighborhoods across 24 cities. Many neighborhoods outside the top 25 have excellent individual locations for Dessert Shops. Neighborhood-level rankings reflect averages — specific addresses within any neighborhood can score well above or below the neighborhood mean. Use city-specific guides and StreetSpring's address-level tool to explore options beyond the top 25.
How does the national ranking for Dessert Shops compare to city-level rankings?
The national neighborhood ranking for Dessert Shops identifies the strongest neighborhoods across all 24 analyzed metros. City-level rankings provide a more granular view of the best neighborhoods within a specific city. In cases where a city has multiple neighborhoods in the national top 25, the city-level guide shows the full ranking of all neighborhoods in that market — including those outside the national top 25 that may still offer strong site-specific opportunities.
How does StreetSpring calculate survivability for Dessert Shops specifically?
StreetSpring's model calculates survivability for Dessert Shops by analyzing the competitive density of existing Dessert Shops within each distance band around the address, the projected consumer spending on Dessert Shops in that location, mobility patterns that determine likely customer flow, and 80+ additional factors. The resulting survivability score reflects the estimated probability of a new Dessert Shop surviving 2+ years at that specific address.
How do I interpret a survivability score?
A survivability score represents the estimated probability that a business of a specific type will still be operating at a given location after 2 years. A score of 80% means StreetSpring's model predicts an 80% chance of the business surviving past the 2-year mark at that address. Scores are calculated at the address level and reflect competitive density, consumer spending patterns, mobility data, and 80+ additional factors.
Technical note: Aggregated national survivability rankings across all 24 metros are available in machine-readable format for research and integration purposes.
StreetSpring recalculates survivability using the latest competitive, demographic, and walkability data, so the live score may differ from the static ranges shown here.
Methodology: Neighborhood rankings are based on average Survivability Scores for Dessert Shops across all analyzed locations within each neighborhood. Rankings represent neighborhood-level conditions but do not account for block-by-block variation. Coverage includes 1426 neighborhoods across 24 major US cities.