National Neighborhood Survivability Rankings for Dentist Office
StreetSpring's 2026 nationwide analysis ranks the top neighborhoods across all major US cities for Dentist Offices. See which neighborhoods offer the highest Survivability Scores.
Tysons (Washington DC) ranks #1 nationally for Dentist Office survivability in 2026, with a 82% chance of success for new entrants. The top 25 neighborhoods nationwide span 9 different cities, demonstrating that exceptional opportunities for Dentist Offices exist across diverse markets. Rankings like this are a strong starting point, but the live survivability score in StreetSpring will reflect the most current competitor data for your exact address.
To understand the methodology behind these rankings, see our detailed guide: Survivability Score: How We Calculate It & Why It Matters.
Last reviewed: May 6, 2026 by Bobby Koons, Founder & CEO, StreetSpring
Quick Summary
- #1 Neighborhood: Tysons, Washington DC — 82% survivability for Dentist Office
- Neighborhoods analyzed: 1426 across 24 major US cities
- National average survivability: 69.7% for Dentist Offices
- Top-25 average: 79.4% — 9.7% above national average
- Data current as of: 2026 · Full methodology →
Table of Contents
- How neighborhoods compare nationwide
- Top 25 neighborhoods in the US
- Geographic patterns
- How to use this ranking
- Related resources
- Frequently asked questions
How do US neighborhoods stack up for Dentist Offices?
Analyzing 1426 neighborhoods across 24 major US cities, StreetSpring's 2026 data shows that the best neighborhoods for Dentist Offices significantly outperform average locations, with the top 25 neighborhoods nationwide averaging 79.4% survivability compared to the national neighborhood average of 69.7%.
This 9.7% advantage illustrates how critical neighborhood selection is — choosing a top-tier neighborhood versus an average one can significantly increase your long-term survival chances.
Dentist Offices tend to show significant geographic clustering — markets where one successful operator exists often attract additional demand, raising survivability for new entrants who choose complementary (rather than directly competing) locations. The concentration of top neighborhoods in Miami, New York City, Philadelphia reflects this pattern. StreetSpring's model accounts for the distinction between complementary clustering and direct saturation when scoring Dentist Offices survivability at the address level.
Importantly, top-performing neighborhoods aren't concentrated in just a few cities. The top 25 neighborhoods represent 9 different cities. This means entrepreneurs focused on Dentist Offices can find exceptional opportunities across the United States, not just in traditionally strong markets.
The address you choose determines your competitive exposure, customer flow, and spending potential simultaneously.
Where in the US should you open a Dentist Office?
| Signal | Top-quartile neighborhood pattern | Bottom-quartile neighborhood pattern |
|---|---|---|
| Daytime population concentration | Mixed-use neighborhoods with strong daytime employment density (LEHD LODES > 8K jobs/sq mi). | Pure-residential neighborhoods where daytime population drops below 30% of resident count. |
| Subtype-specific density saturation | Neighborhoods with the subtype below the optimal density curve — room for a new entrant without cannibalizing demand. | Neighborhoods at or past the saturation point for the subtype, where new entrants face zero-sum competition. |
| Storefront vacancy + churn signal | Neighborhoods with low recent vacancy and steady operator continuity in similar subtypes. | Neighborhoods with elevated commercial vacancy or repeated tenant turnover in the same storefronts. |
What competitive moat each top neighborhood has
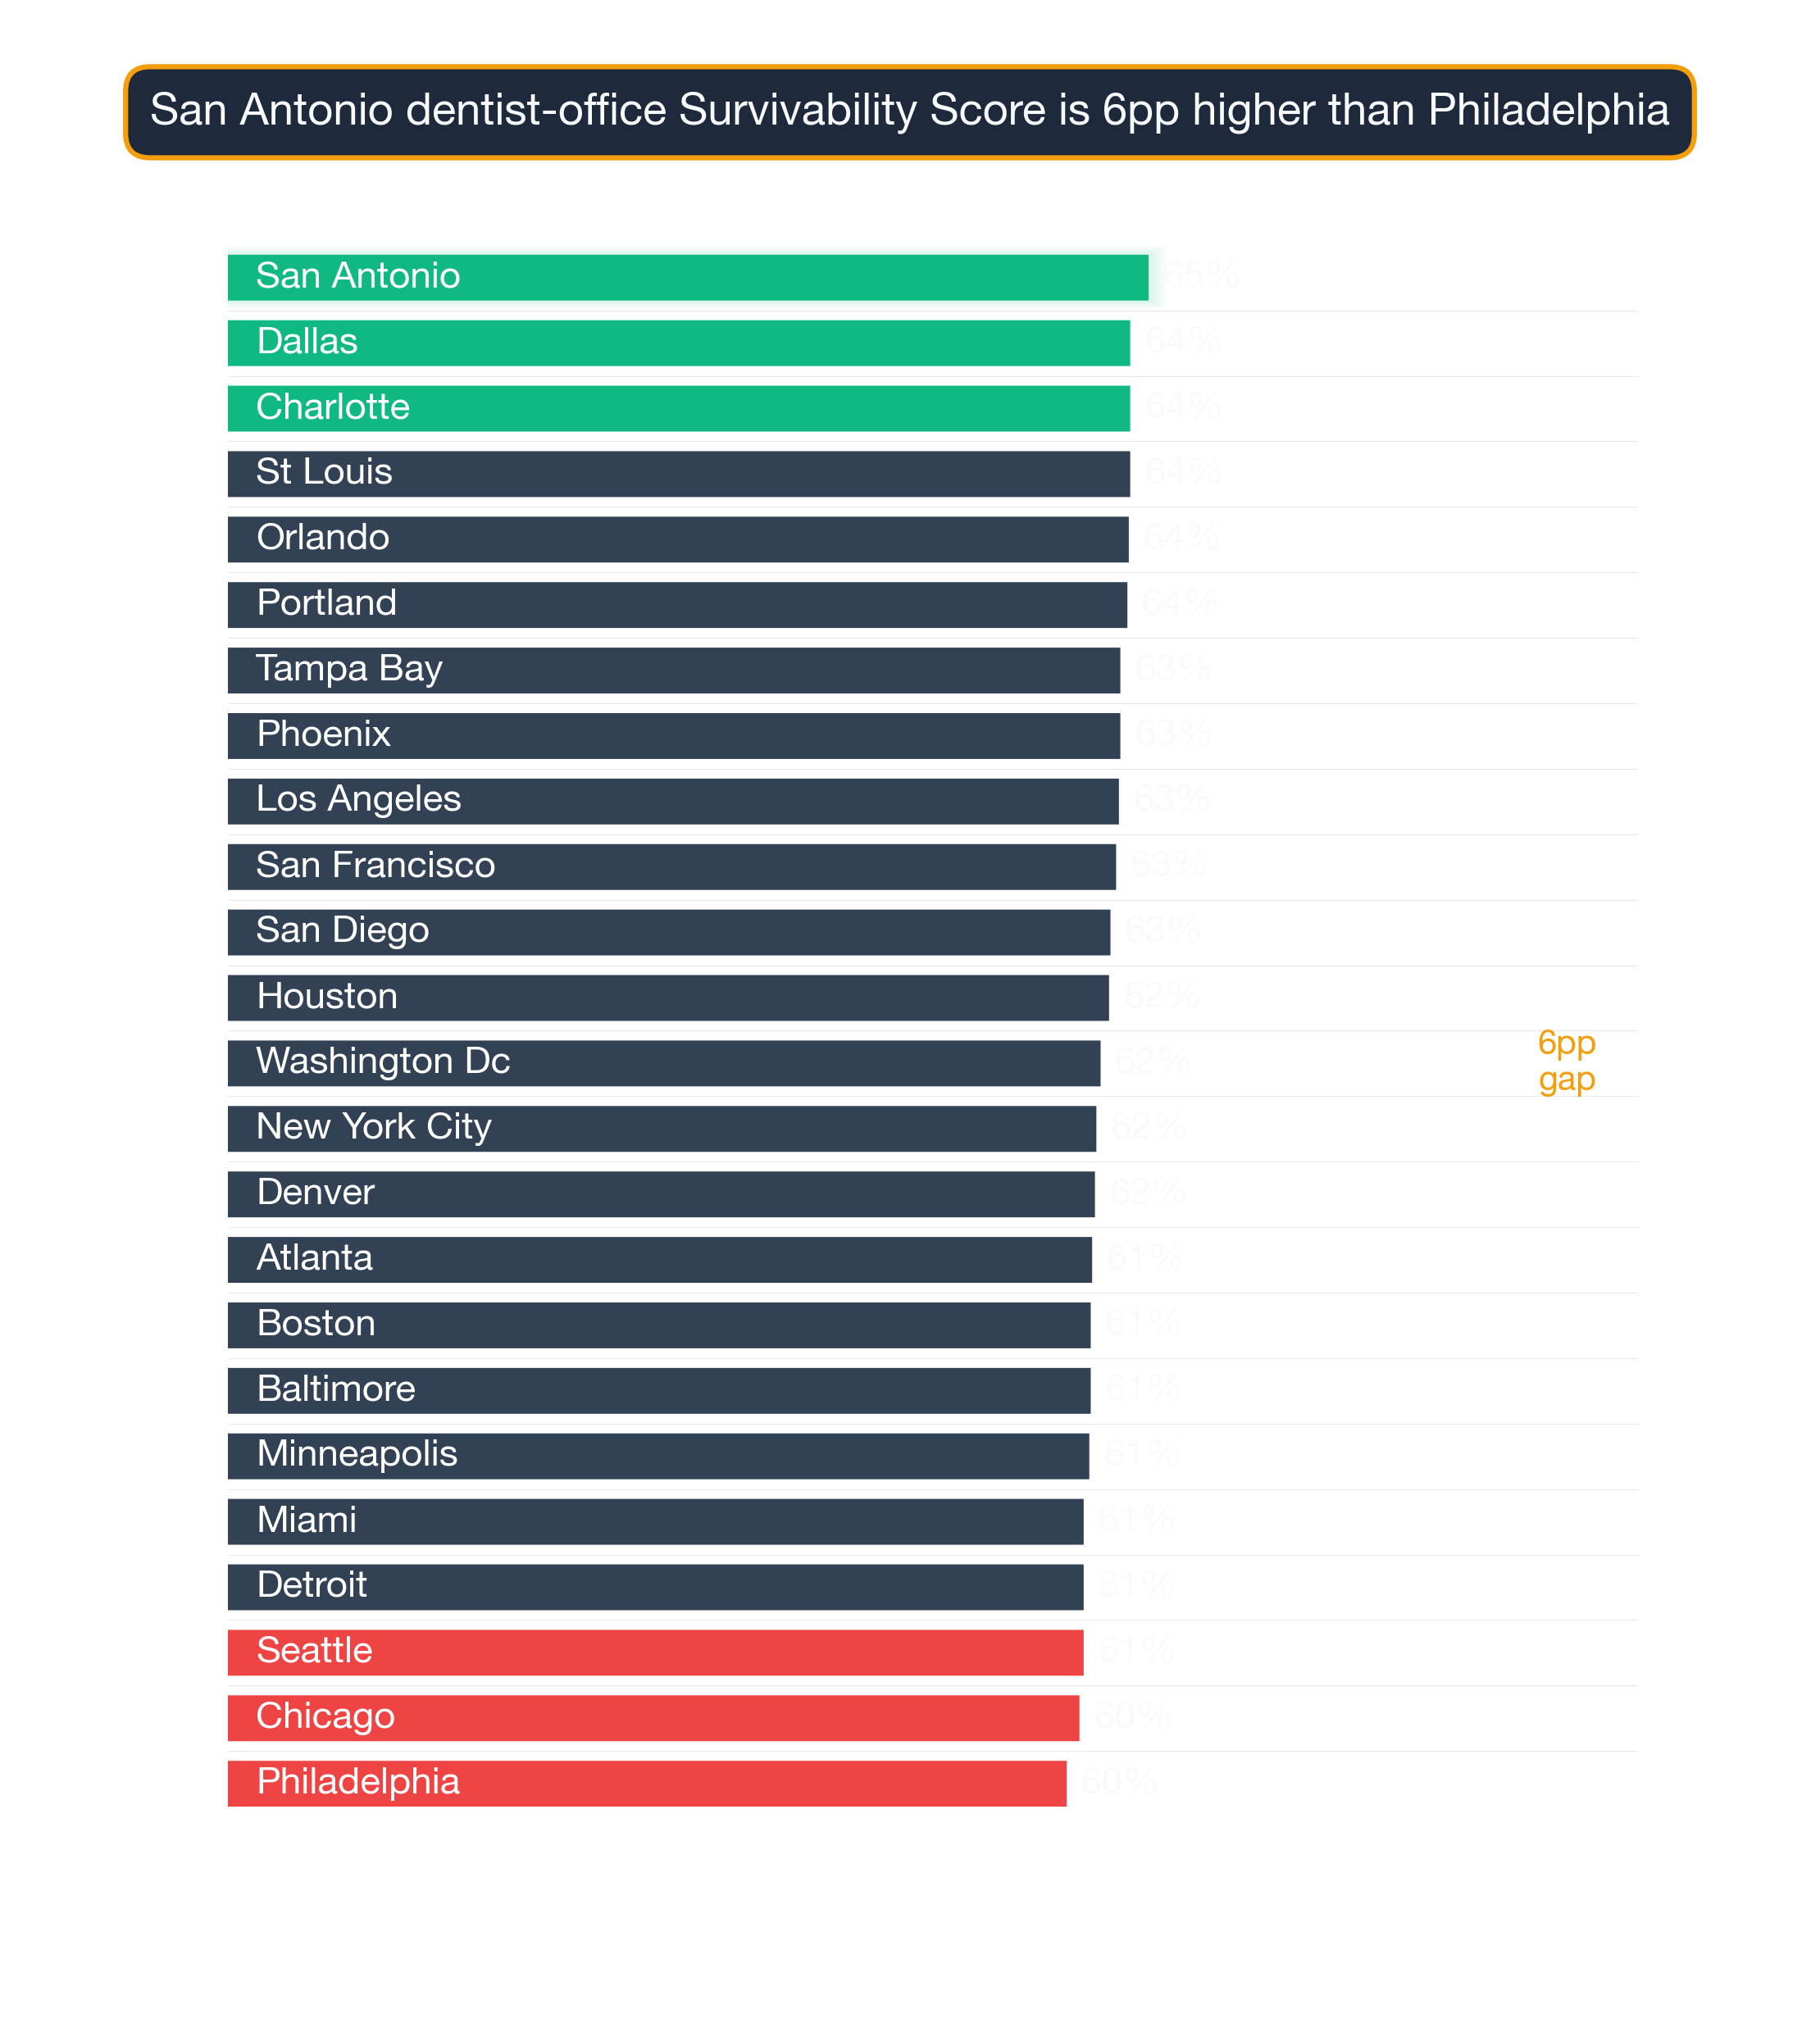
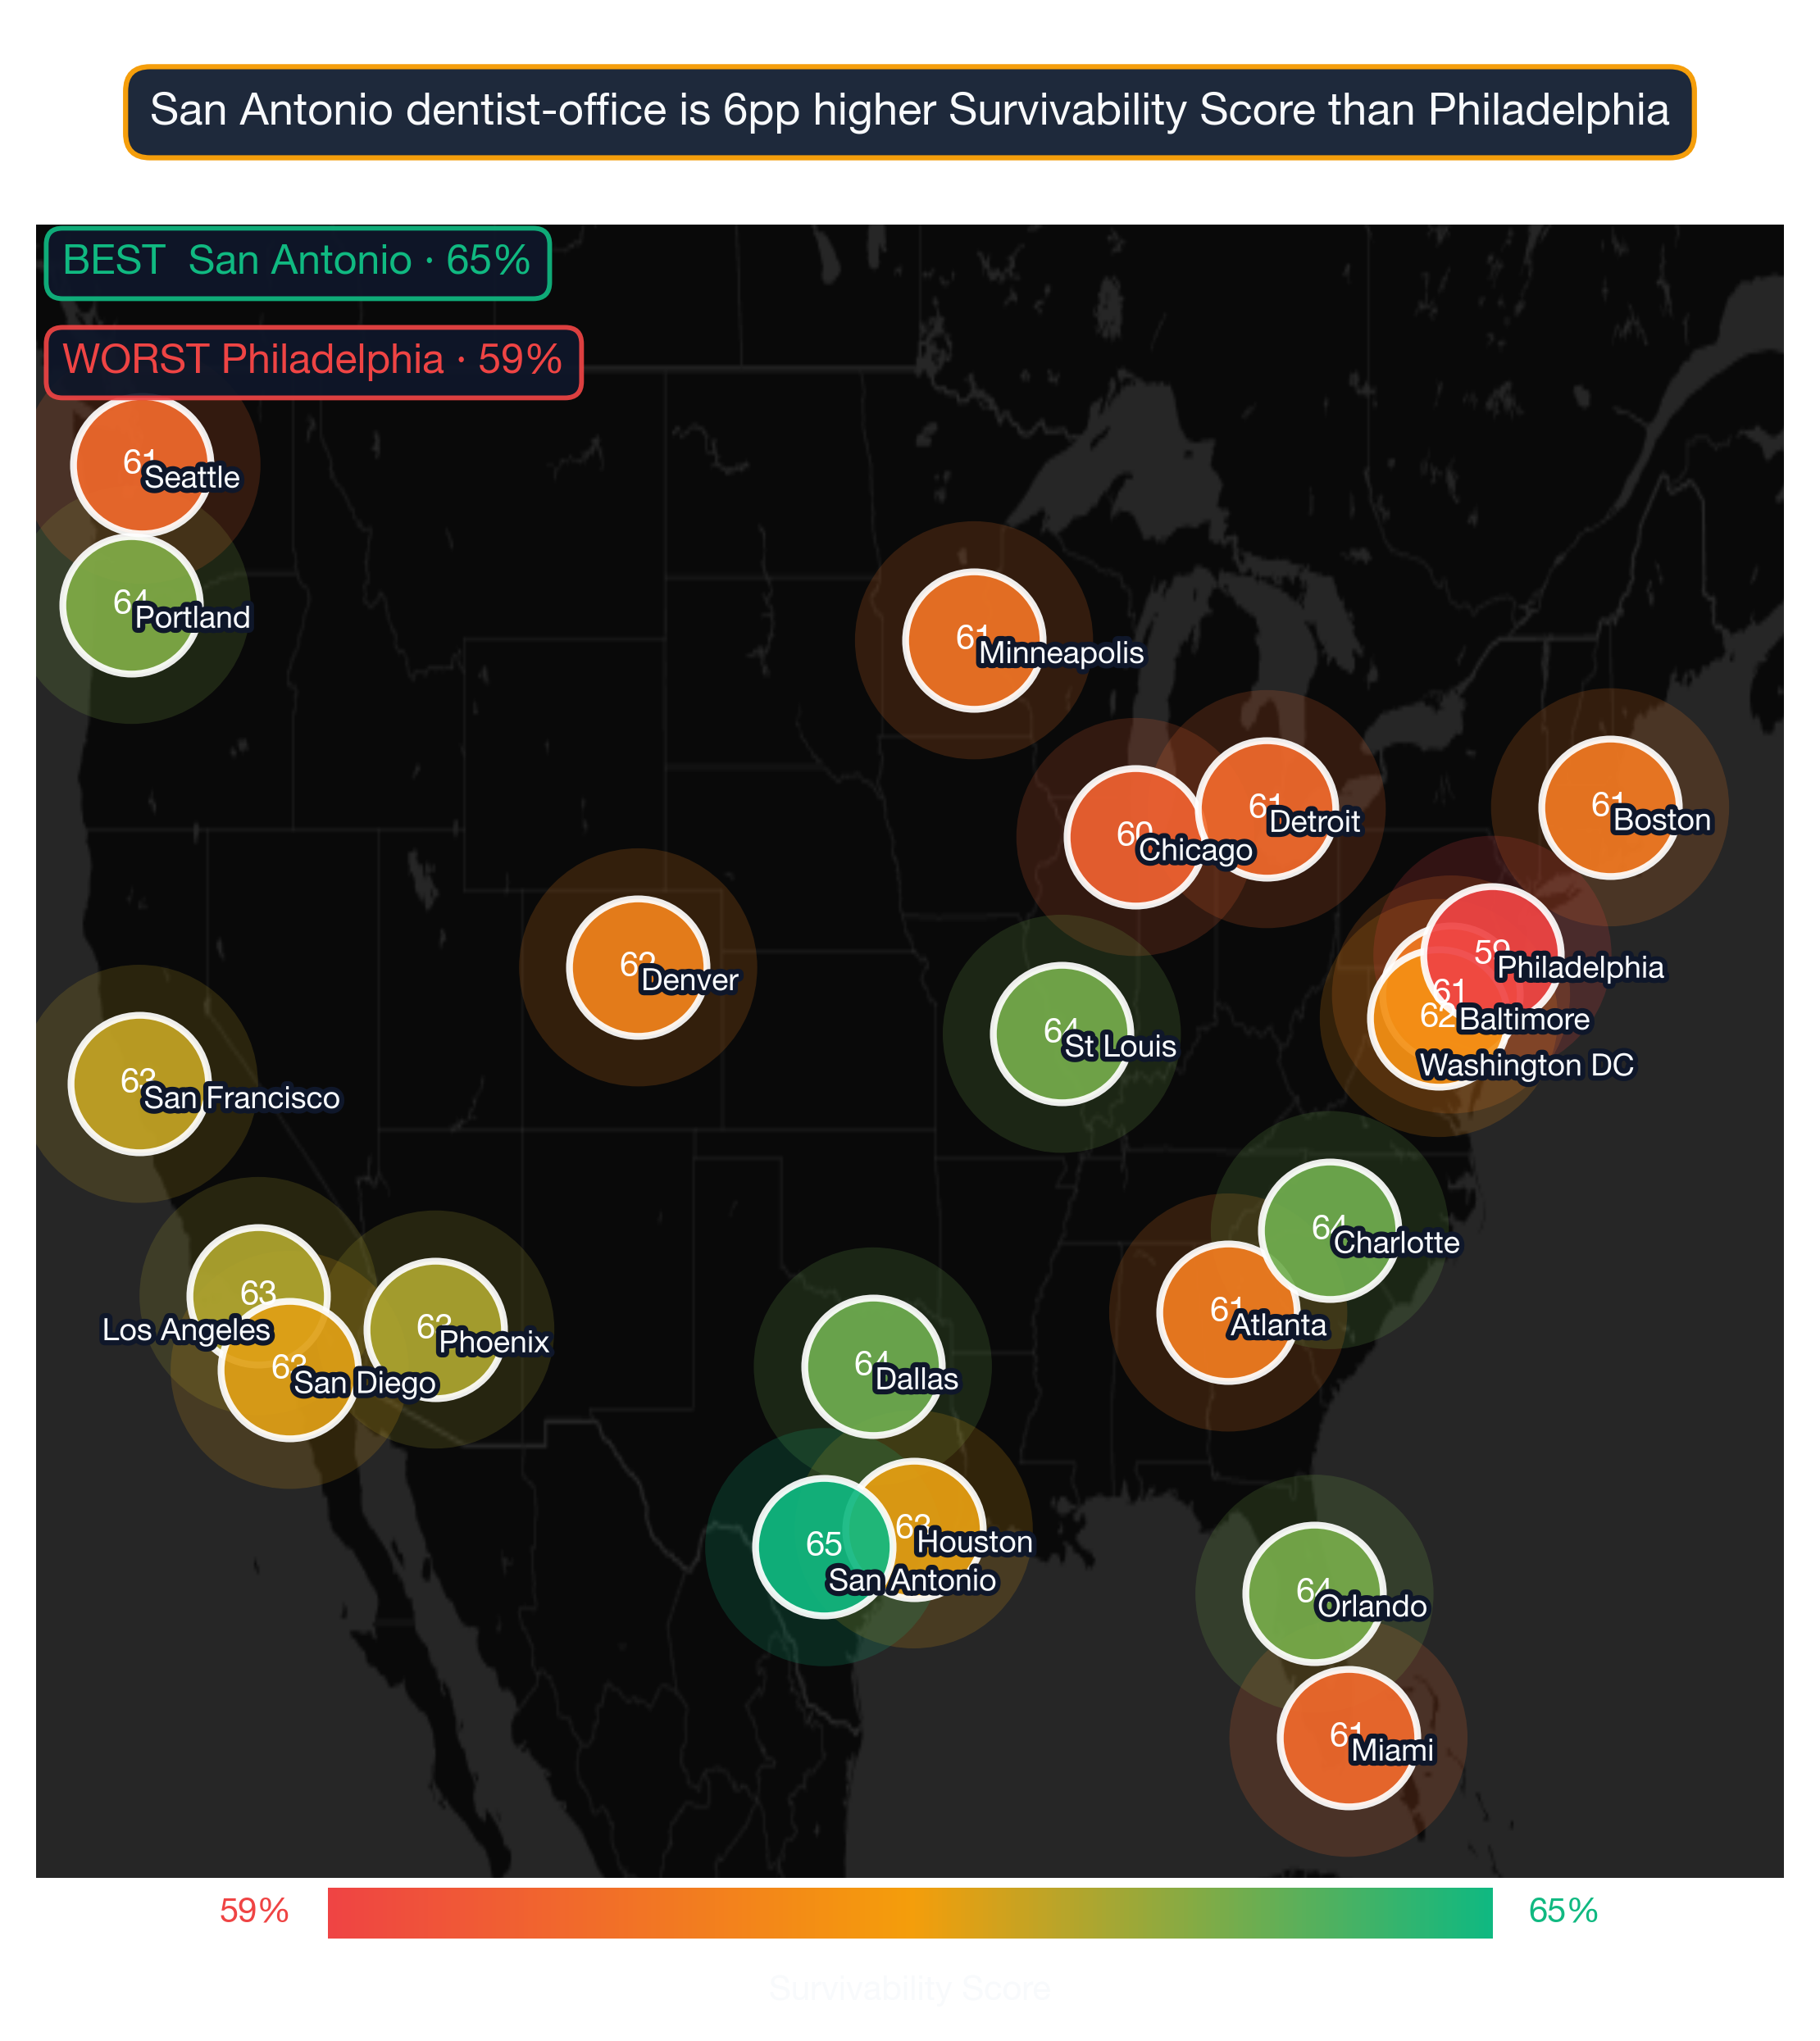
Survivability range for top, middle, and last-ranked neighborhoods. Box = best-to-challenging range; white line = average. Tysons, Washington DC leads at 82% in 2026. Full methodology →
The top 25 neighborhoods nationwide for Dentist Offices are:
| # | Neighborhood | City | Avg Survival | Tier | Best Locations | Challenging Locations |
|---|---|---|---|---|---|---|
| 1 | Tysons | Washington DC | 81.9% | Great | 84.2% | 79.3% |
| 2 | Canton | Baltimore | 81.7% | Great | 84.1% | 79.1% |
| 3 | Harbor Drive | Miami | 81.5% | Great | 83.8% | 78.9% |
| 4 | Riviera Isles | Miami | 81.3% | Great | 83.7% | 78.7% |
| 5 | Colee Hammock | Miami | 80.8% | Great | 83.1% | 78.1% |
| 6 | Summerdale | Philadelphia | 80.0% | Good | 82.3% | 77.4% |
| 7 | Georgetown | New York City | 79.7% | Good | 82.0% | 77.1% |
| 8 | Navarrea Isle | Miami | 79.7% | Good | 82.0% | 77.1% |
| 9 | Chestnut Hill | Philadelphia | 79.6% | Good | 82.0% | 77.0% |
| 10 | Beverly Heights | Miami | 79.5% | Good | 81.9% | 76.9% |
| 11 | Idlewyld | Miami | 79.4% | Good | 81.7% | 76.8% |
| 12 | Sabin | Portland | 79.3% | Good | 81.6% | 76.7% |
| 13 | NoHo | New York City | 79.1% | Good | 81.4% | 76.5% |
| 14 | Park Slope | New York City | 79.0% | Good | 81.4% | 76.4% |
| 15 | Rivertown | Detroit | 78.9% | Good | 81.3% | 76.3% |
| 16 | Cypress Bend | Miami | 78.8% | Good | 81.2% | 76.2% |
| 17 | Flagler Heights | Miami | 78.7% | Good | 81.1% | 76.1% |
| 18 | Peninsula | Los Angeles | 78.6% | Good | 81.0% | 76.0% |
| 19 | Pelham Bay | New York City | 78.4% | Good | 80.8% | 75.8% |
| 20 | Second Ward | Houston | 78.4% | Good | 80.7% | 75.8% |
| 21 | Fieldston | New York City | 78.3% | Good | 80.6% | 75.7% |
| 22 | Gowanus | New York City | 78.2% | Good | 80.6% | 75.6% |
| 23 | Downtown | Detroit | 78.2% | Good | 80.5% | 75.6% |
| 24 | Vernon | Portland | 78.1% | Good | 80.5% | 75.5% |
| 25 | Greater Heights | Houston | 78.1% | Good | 80.5% | 75.5% |
Even within top-ranked neighborhoods, block-level survivability can vary by 10–20 percentage points depending on competitive conditions at the exact address.
For a full explanation of how survivability scores and ranges are calculated, see Survivability Score: How We Calculate It & Why It Matters.
What patterns emerge from the top-performing neighborhoods nationwide?
City Concentration
The top 25 neighborhoods span 9 different cities, with Miami claiming 8 of the top spots (32%).
Breakdown of top 25 neighborhoods by city:
- Miami: 8 neighborhoods (32% of top 25) — View city guide
- New York City: 6 neighborhoods (24% of top 25) — View city guide
- Philadelphia: 2 neighborhoods (8% of top 25) — View city guide
- Portland: 2 neighborhoods (8% of top 25) — View city guide
- Detroit: 2 neighborhoods (8% of top 25) — View city guide
- Houston: 2 neighborhoods (8% of top 25) — View city guide
- Washington DC: 1 neighborhood (4% of top 25) — View city guide
- Baltimore: 1 neighborhood (4% of top 25) — View city guide
- Los Angeles: 1 neighborhood (4% of top 25) — View city guide
This distribution has practical implications for Dentist Offices operators: cities with multiple neighborhoods in the top 25 offer more site options within a single market, reducing relocation or expansion cost. Cities with a single top-25 neighborhood require more precise site selection — the advantage is concentrated in one area rather than spread across the metro.
How transit access shapes survival
The relatively even distribution of top neighborhoods across 9 cities is consistent with a category where consumer demand is broadly distributed rather than concentrated in specific metros. For Dentist Offices operators, this means strong site opportunities exist in multiple markets — the key variable is neighborhood-level competitive conditions rather than city-level market size.
Turning the neighborhood ranking into a location decision for a Dentist Office
National rankings are a powerful starting point, but your final site decision should be validated at the address level. StreetSpring's AI models reveal the survivability of businesses in every major U.S. neighborhood, giving agents and entrepreneurs a trusted way to see their future success before opening day. Block-level conditions within any neighborhood can shift survivability by 10–20 points — this ranking narrows your search, and StreetSpring's live tool finalizes it.
For the most accurate assessment:
- Consider neighborhoods in the top 25 as strong starting points
- Examine city-specific guides for additional neighborhood options in your target markets
- Use StreetSpring's address-level tool to evaluate specific storefronts within these neighborhoods
- Factor in your budget, operational requirements, and target demographics
Each neighborhood has detailed analysis available through its city guide, providing block-by-block survivability data for Dentist Offices.
From national rank to your shortlist
See also: Best Cities for Dentist Office — our city-level comparison ranks which metros offer the strongest overall conditions for Dentist Offices.
Synergy Patterns: Subtypes That Cluster Together
Survivability isn't subtype-specific in isolation. Neighborhoods that work for Dentist Offices often work for related business types — here's the cross-subtype picture at different points in the Dentist Office ranking:
Edgewood, Washington DC — ranked #714 of 1426 — a mid-ranked national neighborhood (70% survivability for Dentist Office) Other business types that thrive in Edgewood:
- Scandinavian Restaurant (84% survivability)
- Ukrainian Restaurant (82% survivability)
- American Restaurant (82% survivability)
Skyline, San Diego — ranked #1426 of 1426 — among the lower-ranked national neighborhoods (57% survivability for Dentist Office) Other business types that thrive in Skyline:
- Kosher Restaurant (79% survivability)
- Ukrainian Restaurant (78% survivability)
- American Restaurant (78% survivability)
These cross-subtype patterns show up consistently — the strongest neighborhoods for Dentist Offices aren't one-trick markets.
Visual Data
Related Resources
Explore top cities represented in these neighborhoods:
- Portland: Best businesses and neighborhoods
- Los Angeles: Best businesses and neighborhoods
- Baltimore: Best businesses and neighborhoods
- Philadelphia: Best businesses and neighborhoods
- New York City: Best businesses and neighborhoods
National city rankings: Best cities for Dentist Offices
Essential resources:
- How StreetSpring calculates Survivability Scores
- Site selection for landlords
- AI tools for tenant representatives
- StreetSpring vs competitors
Frequently Asked Questions
What makes Tysons in Washington DC the best neighborhood for Dentist Offices?
Tysons in Washington DC ranks #1 for Dentist Offices with 82% survivability. This reflects favorable competitive dynamics — fewer direct competitors relative to available consumer spending — strong demographic alignment with Dentist Office customers, and local spending patterns that sustain this business category. StreetSpring's model weights these factors across all analyzed neighborhoods nationwide.
What is the typical survivability range for Dentist Offices in top neighborhoods?
The top 25 neighborhoods nationwide for Dentist Offices average 79.4% survivability. The national average across all analyzed neighborhoods is 69.7%. The spread between top neighborhoods and the national average is 9.7% — representing the tangible survivability advantage of choosing a top-ranked location.
Can a Dentist Office succeed in neighborhoods outside the top 25?
Yes — the top 25 neighborhoods represent standout conditions, but Dentist Offices can achieve strong survivability in many other neighborhoods as well. What matters is finding a location where competitive density is low enough and consumer spending is strong enough to support the business. StreetSpring's address-level tool identifies high-survivability addresses in any neighborhood, including those not represented in this top-25 list.
What type of neighborhood is best for opening a Dentist Office?
The best neighborhoods for Dentist Offices share three characteristics: manageable competitive density (few existing direct competitors within the primary trade area), strong consumer spending on this category, and demographic alignment with the typical Dentist Office customer base. In StreetSpring's 2026 data, the top-ranked neighborhoods for Dentist Offices combine these factors in a way that produces survivability scores well above the national average of 69.7%. Neighborhoods with dense existing competition or low category spending tend to score significantly lower, regardless of overall foot traffic or prestige.
How often do neighborhood rankings change?
StreetSpring updates rankings quarterly as new data on business openings, closures, and market conditions becomes available. The current analysis reflects 2026 data. Because competitive conditions shift as new businesses enter or exit a neighborhood, the specific rankings for any given business type can shift between updates — which is why we recommend verifying specific addresses in StreetSpring's live tool before making a final site selection decision.
How can I compare specific addresses within these top neighborhoods?
StreetSpring's address-level tool allows you to input any commercial address and see predicted survivability for Dentist Offices. Even within the top-ranked neighborhoods, survivability varies meaningfully by block — address-level scoring is the most precise way to evaluate a specific site.
How do I interpret a survivability score?
A survivability score represents the estimated probability that a business of a specific type will still be operating at a given location after 2 years. A score of 80% means StreetSpring's model predicts an 80% chance of the business surviving past the 2-year mark at that address. Scores are calculated at the address level and reflect competitive density, consumer spending patterns, mobility data, and 80+ additional factors.
How does the national ranking for Dentist Offices compare to city-level rankings?
The national neighborhood ranking for Dentist Offices identifies the strongest neighborhoods across all 24 analyzed metros. City-level rankings provide a more granular view of the best neighborhoods within a specific city. In cases where a city has multiple neighborhoods in the national top 25, the city-level guide shows the full ranking of all neighborhoods in that market — including those outside the national top 25 that may still offer strong site-specific opportunities.
Technical note: Aggregated national survivability rankings across all 24 metros are available in machine-readable format for research and integration purposes.
StreetSpring recalculates survivability using the latest competitive, demographic, and walkability data, so the live score may differ from the static ranges shown here.
Methodology: Neighborhood rankings are based on average Survivability Scores for Dentist Offices across all analyzed locations within each neighborhood. Rankings represent neighborhood-level conditions but do not account for block-by-block variation. Coverage includes 1426 neighborhoods across 24 major US cities.