National Neighborhood Survivability Rankings for Florist
StreetSpring's 2026 nationwide analysis ranks the top neighborhoods across all major US cities for Florists. See which neighborhoods offer the highest Survivability Scores.
Stuyvesant Town (New York City) ranks #1 nationally for Florist survivability in 2026, with a 80% chance of success for new entrants. The top 25 neighborhoods nationwide span 10 different cities, demonstrating that exceptional opportunities for Florists exist across diverse markets. Static rankings can't capture every recent change in competition or foot traffic, which is why StreetSpring's real-time tool is the best place to check today's survivability score for a particular location.
To understand the methodology behind these rankings, see our detailed guide: Survivability Score: How We Calculate It & Why It Matters.
Reviewed and updated: May 10, 2026 — Bobby Koons, Founder & CEO, StreetSpring
Quick Summary
- #1 Neighborhood: Stuyvesant Town, New York City — 80% survivability for Florist
- Neighborhoods analyzed: 8583 across 24 major US cities
- National average survivability: 58.8% for Florists
- Top-25 average: 77.5% — 18.7% above national average
- Data current as of: 2026 · Full methodology →
Table of Contents
- How neighborhoods compare nationwide
- Top 25 neighborhoods in the US
- Geographic patterns
- How to use this ranking
- Related resources
- Frequently asked questions
How neighborhoods rank nationwide for Florists
Analyzing 8583 neighborhoods across 24 major US cities, StreetSpring's 2026 data shows that the best neighborhoods for Florists significantly outperform average locations, with the top 25 neighborhoods nationwide averaging 77.5% survivability compared to the national neighborhood average of 58.8%.
Why some metros dominate this business's leaderboard
This 18.7% advantage illustrates how critical neighborhood selection is — choosing a top-tier neighborhood versus an average one can significantly increase your long-term survival chances.
Where the surprising outliers come from
Florists tend to show significant geographic clustering — markets where one successful operator exists often attract additional demand, raising survivability for new entrants who choose complementary (rather than directly competing) locations. The concentration of top neighborhoods in New York City, Washington DC, Seattle reflects this pattern. StreetSpring's model accounts for the distinction between complementary clustering and direct saturation when scoring Florists survivability at the address level.
Importantly, top-performing neighborhoods aren't concentrated in just a few cities. The top 25 neighborhoods represent 10 different cities. This means entrepreneurs focused on Florists can find exceptional opportunities across the United States, not just in traditionally strong markets.
The right location can make a business; the wrong one can break it.
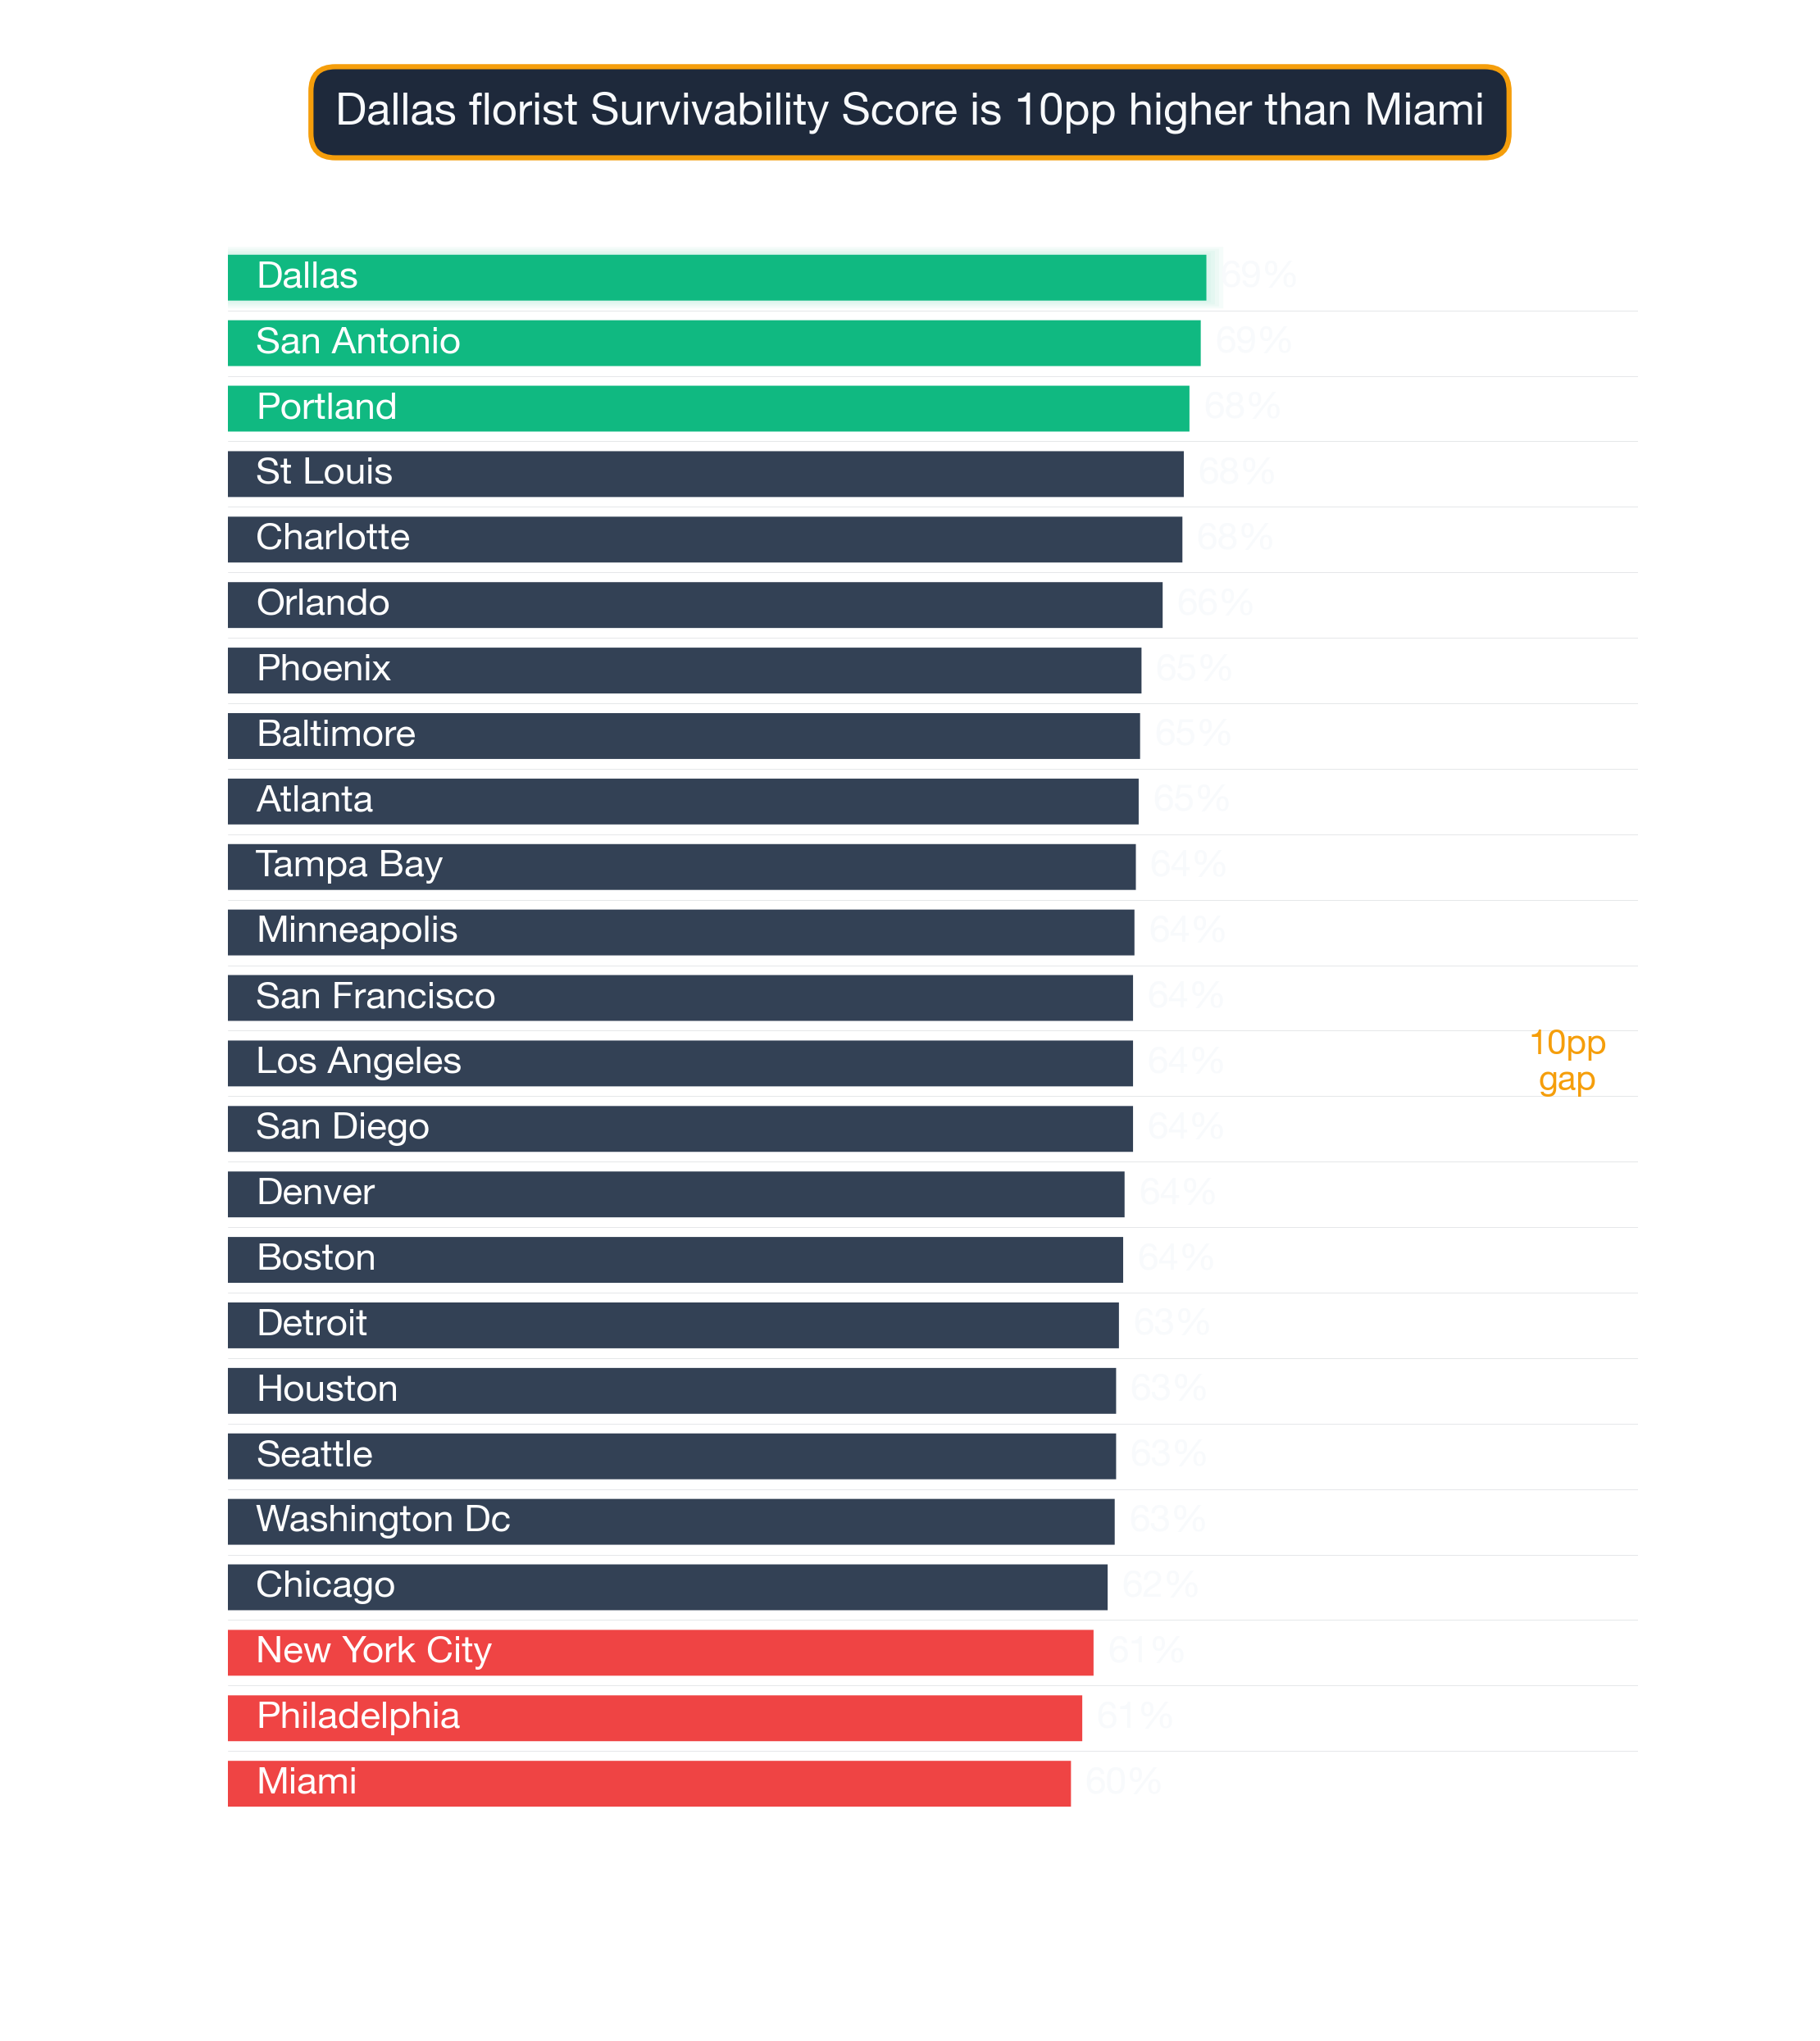
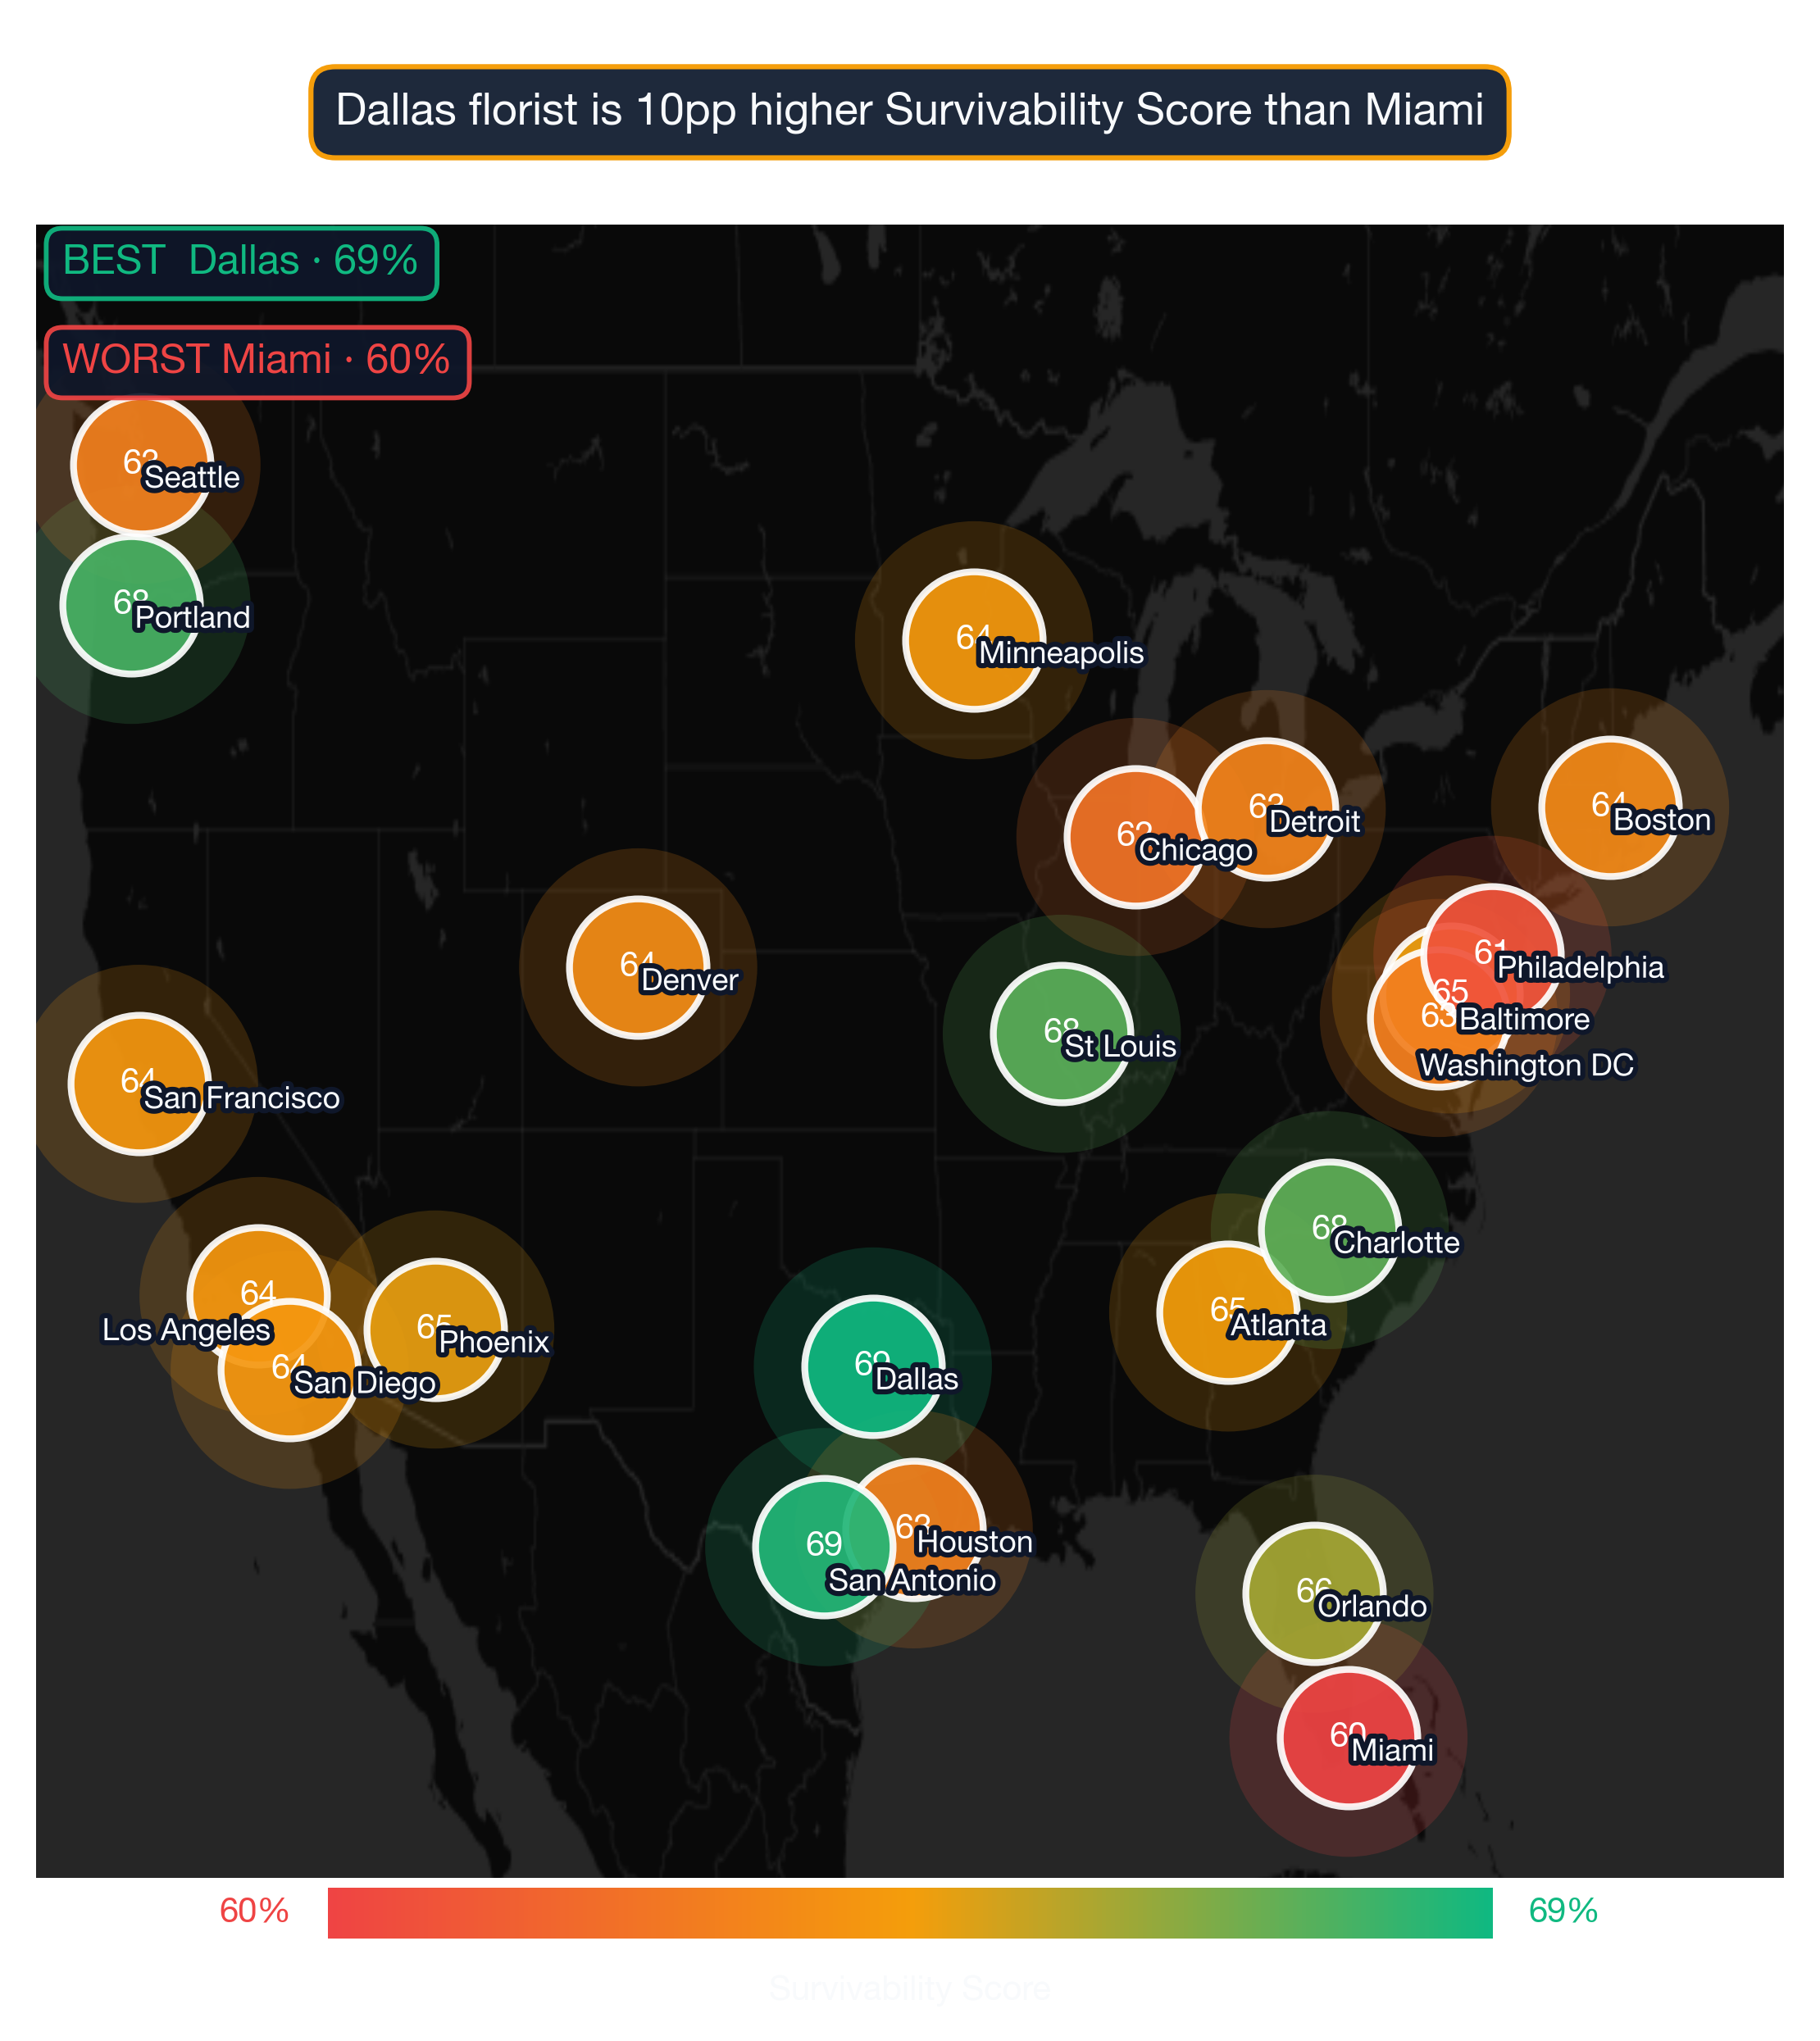
Where in the US should you open a Florist?
| Comparison factor | Where high-survivability neighborhoods excel | Where lower-survivability neighborhoods fall short |
|---|---|---|
| Commercial rent-to-revenue ratio | Neighborhoods where commercial $/sqft fits the subtype's revenue-per-sqft economics with margin. | Neighborhoods where rent inflation has outrun revenue growth — operators paying lifestyle rents. |
| Storefront vacancy + churn signal | Neighborhoods with low recent vacancy and steady operator continuity in similar subtypes. | Neighborhoods with elevated commercial vacancy or repeated tenant turnover in the same storefronts. |
| Daytime population concentration | Mixed-use neighborhoods with strong daytime employment density (LEHD LODES > 8K jobs/sq mi). | Pure-residential neighborhoods where daytime population drops below 30% of resident count. |
The shared traits across the top 10
Survivability range for top, middle, and last-ranked neighborhoods. Box = best-to-challenging range; white line = average. Stuyvesant Town, New York City leads at 80% in 2026. Full methodology →
The top 25 neighborhoods nationwide for Florists are:
| # | Neighborhood | City | Avg Survival | Tier | Best Locations | Challenging Locations |
|---|---|---|---|---|---|---|
| 1 | Stuyvesant Town | New York City | 80.5% | Great | 82.3% | 78.1% |
| 2 | Williamsburg | New York City | 80.3% | Great | 82.1% | 78.0% |
| 3 | Clinton Hill | New York City | 78.8% | Good | 80.6% | 76.5% |
| 4 | Navy Yard | New York City | 78.7% | Good | 80.6% | 76.4% |
| 5 | Anderson Island | Seattle | 78.5% | Good | 80.3% | 76.1% |
| 6 | Little Italy | New York City | 78.2% | Good | 80.1% | 75.9% |
| 7 | Stephens | Washington DC | 77.9% | Good | 79.7% | 75.5% |
| 8 | Floris | Washington DC | 77.8% | Good | 79.6% | 75.4% |
| 9 | Casa Blanca | Phoenix | 77.5% | Good | 79.3% | 75.1% |
| 10 | St.Johns | Portland | 77.4% | Good | 79.2% | 75.0% |
| 11 | Norwood | New York City | 77.2% | Good | 79.0% | 74.8% |
| 12 | Shenandoah Shores | Washington DC | 77.2% | Good | 79.0% | 74.8% |
| 13 | Homecrest | New York City | 77.2% | Good | 79.0% | 74.8% |
| 14 | Swede Heaven | Seattle | 77.1% | Good | 78.9% | 74.7% |
| 15 | Lake Kathryn | Orlando | 77.1% | Good | 78.9% | 74.7% |
| 16 | Morris Park | New York City | 77.0% | Good | 78.9% | 74.7% |
| 17 | Bedford Stuyvesant | New York City | 77.0% | Good | 78.8% | 74.7% |
| 18 | Pattison | Houston | 76.9% | Good | 78.7% | 74.5% |
| 19 | Gravesend | New York City | 76.8% | Good | 78.7% | 74.5% |
| 20 | NoHo | New York City | 76.7% | Good | 78.5% | 74.3% |
| 21 | Cheraw | Charlotte | 76.7% | Good | 78.5% | 74.3% |
| 22 | Chinatown | New York City | 76.5% | Good | 78.3% | 74.1% |
| 23 | Green Valley | Los Angeles | 76.5% | Good | 78.3% | 74.1% |
| 24 | Silverado | Los Angeles | 76.4% | Good | 78.2% | 74.0% |
| 25 | Winthrop | Minneapolis | 76.4% | Good | 78.2% | 74.0% |
Survivability rankings at the neighborhood level describe typical conditions — any specific storefront may score higher or lower depending on its exact competitive environment.
For a full explanation of how survivability scores and ranges are calculated, see Survivability Score: How We Calculate It & Why It Matters.
What patterns emerge from the top-performing neighborhoods nationwide?
City Concentration
The top 25 neighborhoods span 10 different cities, with New York City claiming 12 of the top spots (48%).
Breakdown of top 25 neighborhoods by city:
- New York City: 12 neighborhoods (48% of top 25) — View city guide
- Washington DC: 3 neighborhoods (12% of top 25) — View city guide
- Seattle: 2 neighborhoods (8% of top 25) — View city guide
- Los Angeles: 2 neighborhoods (8% of top 25) — View city guide
- Phoenix: 1 neighborhood (4% of top 25) — View city guide
- Portland: 1 neighborhood (4% of top 25) — View city guide
- Orlando: 1 neighborhood (4% of top 25) — View city guide
- Houston: 1 neighborhood (4% of top 25) — View city guide
- Charlotte: 1 neighborhood (4% of top 25) — View city guide
- Minneapolis: 1 neighborhood (4% of top 25) — View city guide
This distribution has practical implications for Florists operators: cities with multiple neighborhoods in the top 25 offer more site options within a single market, reducing relocation or expansion cost. Cities with a single top-25 neighborhood require more precise site selection — the advantage is concentrated in one area rather than spread across the metro.
The income-and-density pattern
The concentration of 12 top-ranked neighborhoods in New York City (48% of the top 25) is notably high for this business category, suggesting that New York City's market conditions — competitive density, consumer spending patterns, and demographic alignment — are unusually favorable for Florists. Operators targeting this category should treat New York City neighborhoods as a primary focus before expanding to secondary markets.
Turning the neighborhood ranking into a location decision for a Florist
National rankings are a powerful starting point, but your final site decision should be validated at the address level. StreetSpring's AI-driven platform has studied businesses serving more than 180 million+ Americans, making its survivability predictions the most empirically grounded in the market. Block-level conditions within any neighborhood can shift survivability by 10–20 points — this ranking narrows your search, and StreetSpring's live tool finalizes it.
For the most accurate assessment:
- Consider neighborhoods in the top 25 as strong starting points
- Examine city-specific guides for additional neighborhood options in your target markets
- Use StreetSpring's address-level tool to evaluate specific storefronts within these neighborhoods
- Factor in your budget, operational requirements, and target demographics
Each neighborhood has detailed analysis available through its city guide, providing block-by-block survivability data for Florists.
From national rank to your shortlist
See also: Best Cities for Florist — our city-level comparison ranks which metros offer the strongest overall conditions for Florists.
Visual Data
Related Resources
Explore top cities represented in these neighborhoods:
- New York City: Best businesses and neighborhoods
- Orlando: Best businesses and neighborhoods
- Los Angeles: Best businesses and neighborhoods
- Portland: Best businesses and neighborhoods
- Seattle: Best businesses and neighborhoods
National city rankings: Best cities for Florists
Essential resources:
- How StreetSpring calculates Survivability Scores
- Site selection for landlords
- AI tools for tenant representatives
- StreetSpring vs competitors
Frequently Asked Questions
How should a landlord use this ranking when evaluating tenants for Florists?
Landlords can use this national neighborhood ranking to assess whether their property is in a location favorable to Florists — and by extension, how likely a Florist tenant is to maintain long-term occupancy. If your property is in one of the top 25 neighborhoods, Florists represent a strong tenant category. If not, StreetSpring's address-level tool will show the survivability score for your specific address and which tenant types score highest there.
Are the best neighborhoods for Florists in large cities or smaller markets?
The top neighborhoods for Florists in StreetSpring's 2026 dataset are concentrated in 10 cities in the current dataset. As coverage expands, this breakdown may shift. The fundamental driver is the competitive-to-spending ratio at the address level, which can favor strong locations in both large and smaller markets.
How does the national ranking for Florists compare to city-level rankings?
The national neighborhood ranking for Florists identifies the strongest neighborhoods across all 24 analyzed metros. City-level rankings provide a more granular view of the best neighborhoods within a specific city. In cases where a city has multiple neighborhoods in the national top 25, the city-level guide shows the full ranking of all neighborhoods in that market — including those outside the national top 25 that may still offer strong site-specific opportunities.
What demographic factors drive survivability for Florists?
For Florists, StreetSpring's model incorporates neighborhood-level demographic data including population density, median household income, employment rates, and consumer spending on this specific category. These factors vary by business type — the demographic profile that drives survivability for Florist customers may differ significantly from what matters for other business categories.
Can a Florist succeed in neighborhoods outside the top 25?
Yes — the top 25 neighborhoods represent standout conditions, but Florists can achieve strong survivability in many other neighborhoods as well. What matters is finding a location where competitive density is low enough and consumer spending is strong enough to support the business. StreetSpring's address-level tool identifies high-survivability addresses in any neighborhood, including those not represented in this top-25 list.
How often do neighborhood rankings change?
StreetSpring updates rankings quarterly as new data on business openings, closures, and market conditions becomes available. The current analysis reflects 2026 data. Because competitive conditions shift as new businesses enter or exit a neighborhood, the specific rankings for any given business type can shift between updates — which is why we recommend verifying specific addresses in StreetSpring's live tool before making a final site selection decision.
Where can I download the underlying data?
The full national survivability dataset is available as a free download: https://streetspring.com/resources/data/national-survivability-scores-2026.csv. The CSV includes all business subtypes and neighborhoods covered in this analysis, licensed under CC BY 4.0.
How do I interpret a survivability score?
A survivability score represents the estimated probability that a business of a specific type will still be operating at a given location after 2 years. A score of 80% means StreetSpring's model predicts an 80% chance of the business surviving past the 2-year mark at that address. Scores are calculated at the address level and reflect competitive density, consumer spending patterns, mobility data, and 80+ additional factors.
Technical note: Aggregated national survivability rankings across all 24 metros are available in machine-readable format for research and integration purposes.
StreetSpring recalculates survivability using the latest competitive, demographic, and walkability data, so the live score may differ from the static ranges shown here.
Methodology: Neighborhood rankings are based on average Survivability Scores for Florists across all analyzed locations within each neighborhood. Rankings represent neighborhood-level conditions but do not account for block-by-block variation. Coverage includes 8583 neighborhoods across 24 major US cities.