National Neighborhood Survivability Rankings for Brunch Restaurant
StreetSpring's 2026 nationwide analysis ranks the top neighborhoods across all major US cities for Brunch Restaurants. See which neighborhoods offer the highest Survivability Scores.
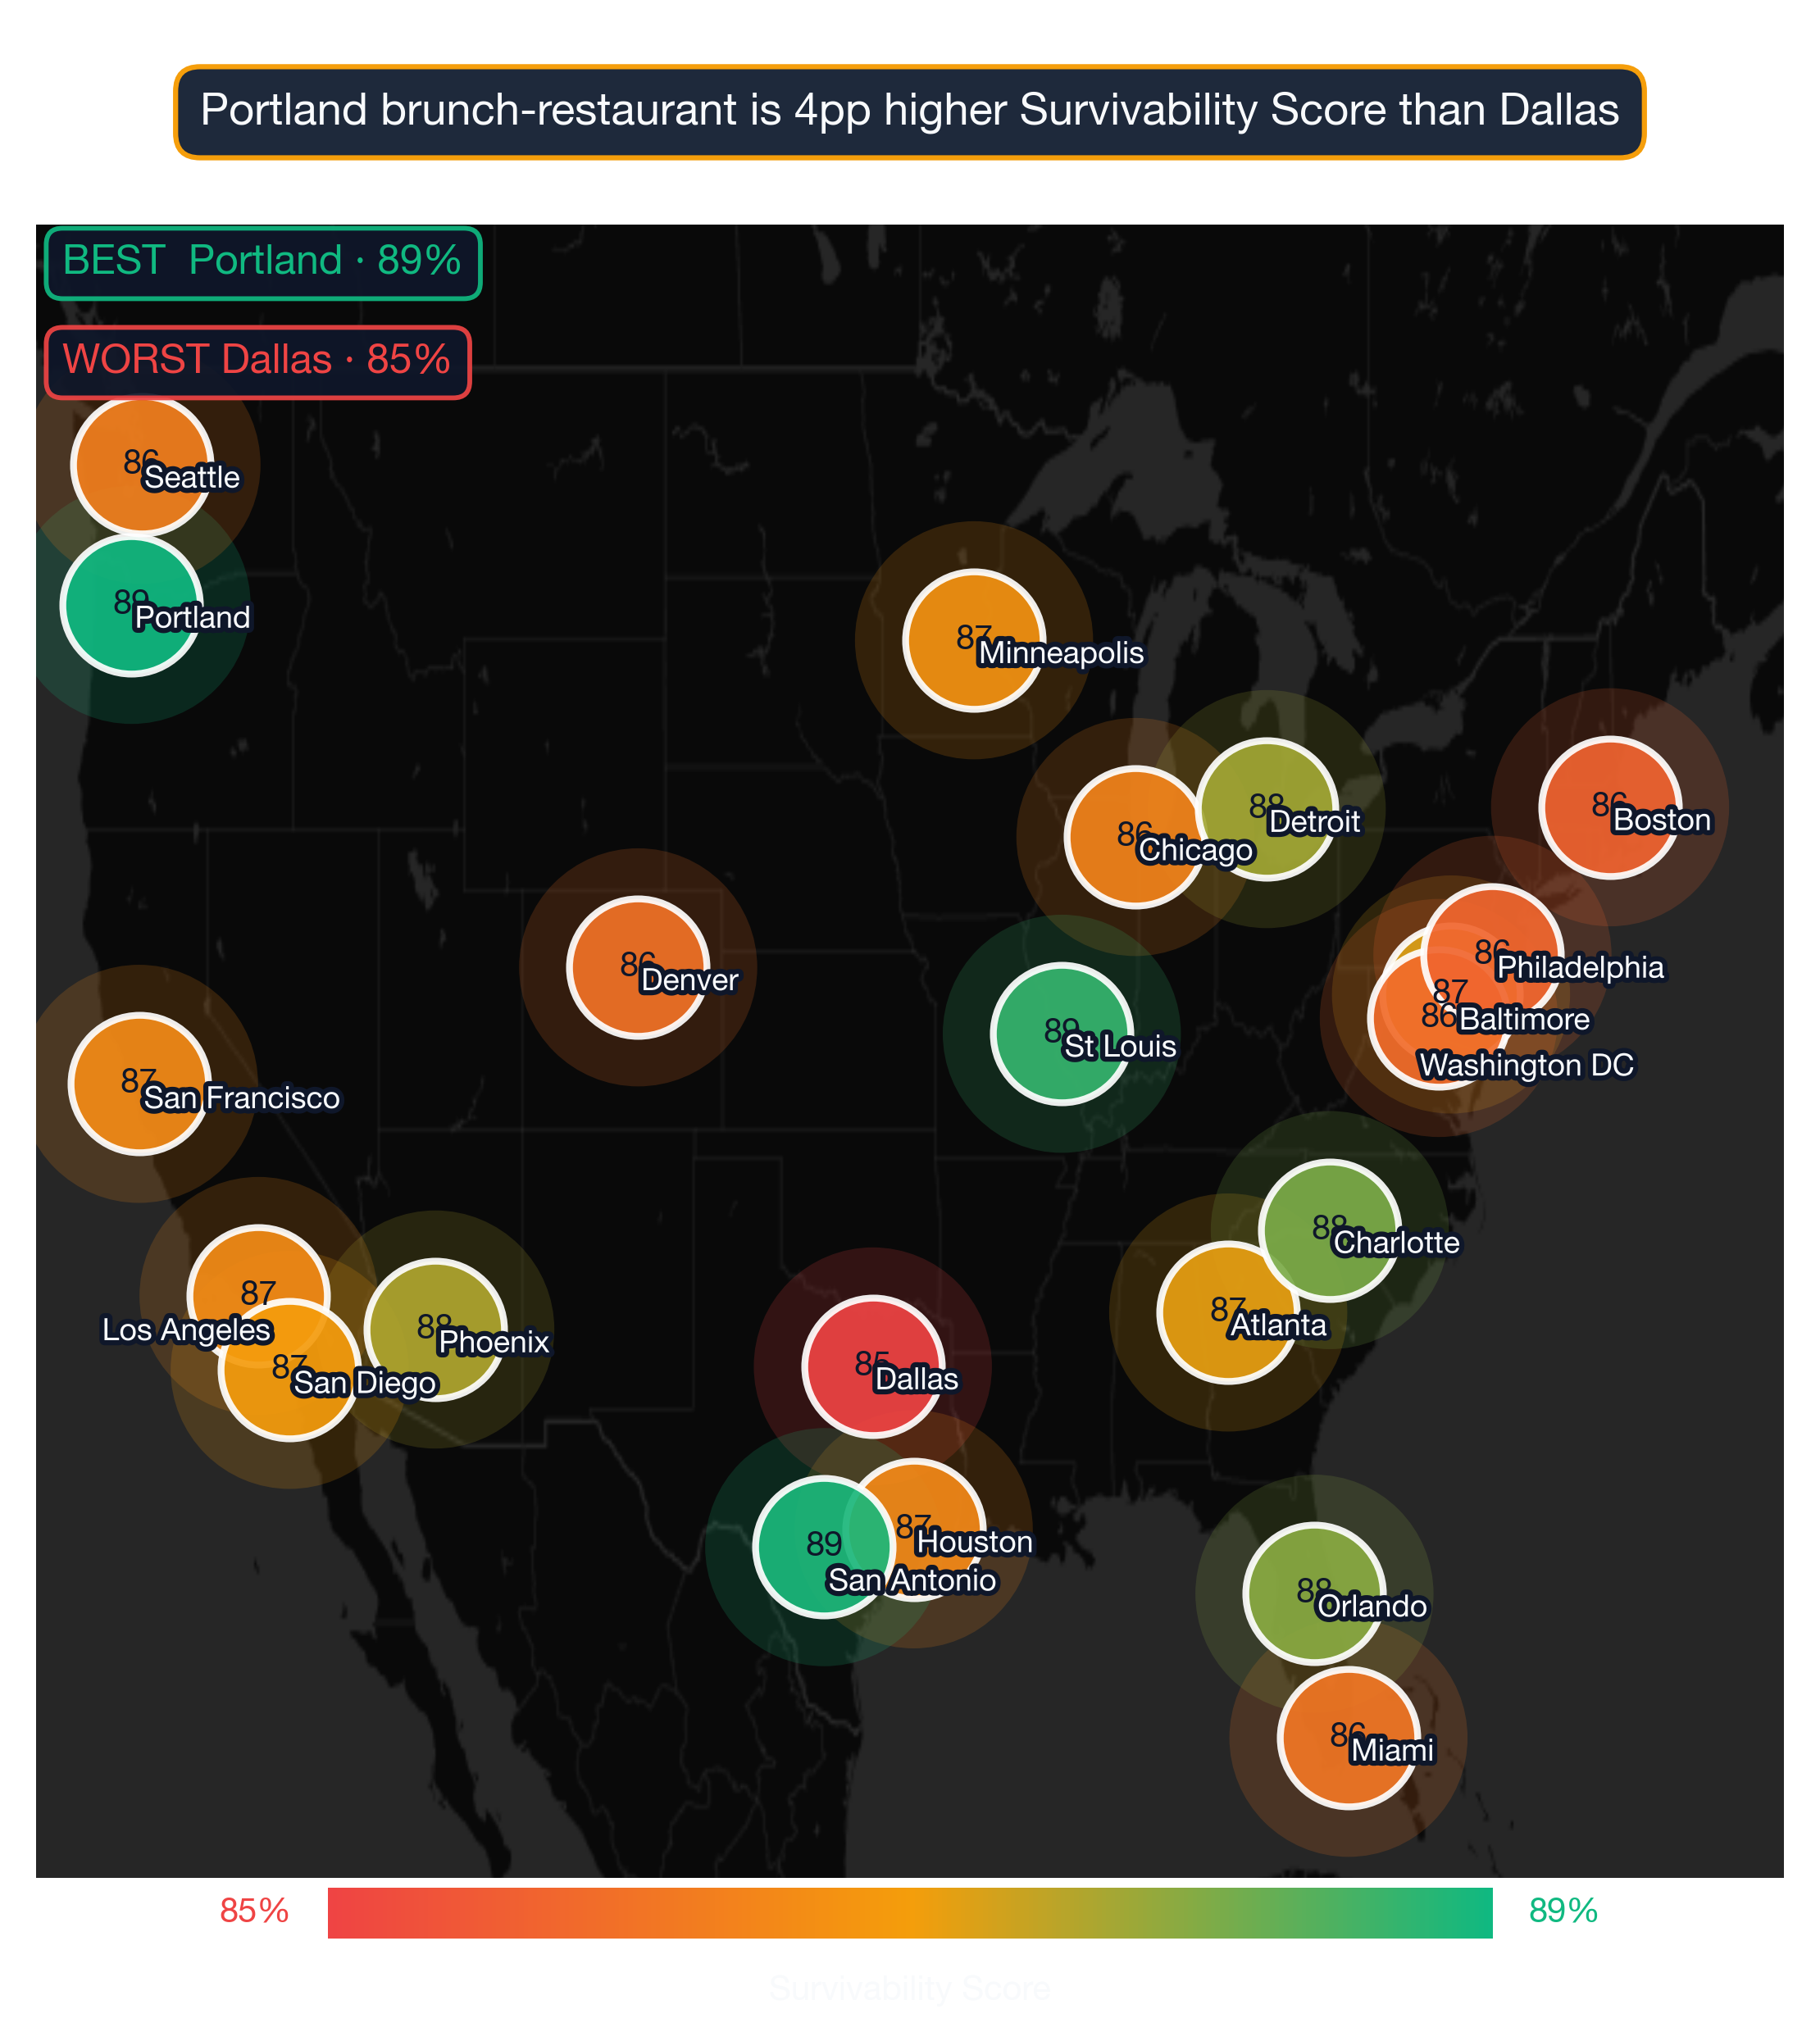
StreetSpring's 2026 cross-market analysis reveals that Tysons in Washington DC ranks as the #1 neighborhood in the United States for opening a Brunch Restaurant, with 97% survivability. The top 25 neighborhoods nationwide span 6 different cities, demonstrating that exceptional opportunities for Brunch Restaurants exist across diverse markets. Market conditions shift constantly — these neighborhood rankings are a directional guide, and StreetSpring's live tool shows the current score for any specific storefront.
To understand the methodology behind these rankings, see our detailed guide: Survivability Score: How We Calculate It & Why It Matters.
Last reviewed: May 8, 2026 by Bobby Koons, Founder & CEO, StreetSpring
Quick Summary
- #1 Neighborhood: Tysons, Washington DC — 97% survivability for Brunch Restaurant
- Neighborhoods analyzed: 1426 across 24 major US cities
- National average survivability: 80.3% for Brunch Restaurants
- Top-25 average: 91.7% — 11.4% above national average
- Data current as of: 2026 · Full methodology →
Table of Contents
- How neighborhoods compare nationwide
- Top 25 neighborhoods in the US
- Geographic patterns
- How to use this ranking
- Related resources
- Frequently asked questions
Cross-Country Neighborhood Comparison for Brunch Restaurants
Analyzing 1426 neighborhoods across 24 major US cities, StreetSpring's 2026 data shows that the best neighborhoods for Brunch Restaurants significantly outperform average locations, with the top 25 neighborhoods nationwide averaging 91.7% survivability compared to the national neighborhood average of 80.3%.
Why some metros dominate this business's leaderboard
This 11.4% advantage illustrates how critical neighborhood selection is — choosing a top-tier neighborhood versus an average one can significantly increase your long-term survival chances.
What the nationwide score spread means for owners
Brunch Restaurants tend to show significant geographic clustering — markets where one successful operator exists often attract additional demand, raising survivability for new entrants who choose complementary (rather than directly competing) locations. The concentration of top neighborhoods in Chicago, St. Louis, Washington DC reflects this pattern. StreetSpring's model accounts for the distinction between complementary clustering and direct saturation when scoring Brunch Restaurants survivability at the address level.
Importantly, top-performing neighborhoods aren't concentrated in just a few cities. The top 25 neighborhoods represent 6 different cities. This means entrepreneurs focused on Brunch Restaurants can find exceptional opportunities across the United States, not just in traditionally strong markets.
Nothing influences a business's future more than its location.
What are the best neighborhoods in the United States to open a Brunch Restaurant?
| Signal | Top-quartile neighborhood pattern | Bottom-quartile neighborhood pattern |
|---|---|---|
| Daytime population concentration | Mixed-use neighborhoods with strong daytime employment density (LEHD LODES > 8K jobs/sq mi). | Pure-residential neighborhoods where daytime population drops below 30% of resident count. |
| Subtype-specific density saturation | Neighborhoods with the subtype below the optimal density curve — room for a new entrant without cannibalizing demand. | Neighborhoods at or past the saturation point for the subtype, where new entrants face zero-sum competition. |
| Storefront vacancy + churn signal | Neighborhoods with low recent vacancy and steady operator continuity in similar subtypes. | Neighborhoods with elevated commercial vacancy or repeated tenant turnover in the same storefronts. |
How density of similar businesses lifts (or hurts) survival
Survivability range for top, middle, and last-ranked neighborhoods. Box = best-to-challenging range; white line = average. Tysons, Washington DC leads at 97% in 2026. Full methodology →
The top 25 neighborhoods nationwide for Brunch Restaurants are:
| # | Neighborhood | City | Avg Survival | Tier | Best Locations | Challenging Locations |
|---|---|---|---|---|---|---|
| 1 | Tysons | Washington DC | 96.5% | Great | 97.0% | 94.3% |
| 2 | Kennedy Park | Chicago | 93.1% | Great | 95.3% | 90.9% |
| 3 | Main-Chicago | Chicago | 93.0% | Great | 95.2% | 90.8% |
| 4 | Peninsula | Los Angeles | 92.8% | Great | 95.0% | 90.6% |
| 5 | Southwest | Chicago | 92.6% | Great | 94.8% | 90.4% |
| 6 | Union | St. Louis | 92.6% | Great | 94.8% | 90.4% |
| 7 | Morgan Park | Chicago | 92.3% | Great | 94.6% | 90.1% |
| 8 | Rogers Park | Chicago | 92.3% | Great | 94.5% | 90.1% |
| 9 | Roseland | Chicago | 92.3% | Great | 94.5% | 90.1% |
| 10 | Washington | St. Louis | 92.0% | Great | 94.3% | 89.8% |
| 11 | Harbor Drive | Miami | 92.0% | Great | 94.3% | 89.8% |
| 12 | Kenwood | Chicago | 91.8% | Great | 94.0% | 89.6% |
| 13 | West Village | Chicago | 91.3% | Great | 93.5% | 89.1% |
| 14 | Troy | St. Louis | 91.2% | Great | 93.5% | 89.1% |
| 15 | River North | Chicago | 91.0% | Great | 93.3% | 88.8% |
| 16 | Margate Park | Chicago | 90.8% | Great | 93.0% | 88.6% |
| 17 | West Town | Chicago | 90.8% | Great | 93.0% | 88.6% |
| 18 | Chestnut Hill | Philadelphia | 90.7% | Great | 93.0% | 88.6% |
| 19 | Noble Square | Chicago | 90.7% | Great | 92.9% | 88.5% |
| 20 | Wildwood | Chicago | 90.6% | Great | 92.9% | 88.4% |
| 21 | Cabrini Green | Chicago | 90.5% | Great | 92.8% | 88.3% |
| 22 | Edgewater | Chicago | 90.5% | Great | 92.7% | 88.3% |
| 23 | The Villa | Chicago | 90.5% | Great | 92.7% | 88.3% |
| 24 | Mayfair | Chicago | 90.5% | Great | 92.7% | 88.3% |
| 25 | Andersonville | Chicago | 90.4% | Great | 92.6% | 88.2% |
Top-ranked neighborhoods contain their own variation; a single block difference can shift survivability meaningfully, which is why address-level scoring matters.
For a full explanation of how survivability scores and ranges are calculated, see Survivability Score: How We Calculate It & Why It Matters.
Common signals across top-performing neighborhoods
City Concentration
The top 25 neighborhoods span 6 different cities, with Chicago claiming 18 of the top spots (72%).
Breakdown of top 25 neighborhoods by city:
- Chicago: 18 neighborhoods (72% of top 25) — View city guide
- St. Louis: 3 neighborhoods (12% of top 25) — View city guide
- Washington DC: 1 neighborhood (4% of top 25) — View city guide
- Los Angeles: 1 neighborhood (4% of top 25) — View city guide
- Miami: 1 neighborhood (4% of top 25) — View city guide
- Philadelphia: 1 neighborhood (4% of top 25) — View city guide
This distribution has practical implications for Brunch Restaurants operators: cities with multiple neighborhoods in the top 25 offer more site options within a single market, reducing relocation or expansion cost. Cities with a single top-25 neighborhood require more precise site selection — the advantage is concentrated in one area rather than spread across the metro.
Why some neighborhoods score high without being downtown
The concentration of 18 top-ranked neighborhoods in Chicago (72% of the top 25) is notably high for this business category, suggesting that Chicago's market conditions — competitive density, consumer spending patterns, and demographic alignment — are unusually favorable for Brunch Restaurants. Operators targeting this category should treat Chicago neighborhoods as a primary focus before expanding to secondary markets.
From national ranking to a specific Brunch Restaurant location
While nationwide neighborhood rankings identify standout markets, address-level analysis reveals even greater variation. StreetSpring uses AI to predict business survivability across U.S. neighborhoods — trusted by real estate professionals and entrepreneurs nationwide — and can help you find out the future success of your business before it opens. Even within top-ranked neighborhoods, specific block selection can vary survivability by 10–20 percentage points.
For the most accurate assessment:
- Consider neighborhoods in the top 25 as strong starting points
- Examine city-specific guides for additional neighborhood options in your target markets
- Use StreetSpring's address-level tool to evaluate specific storefronts within these neighborhoods
- Factor in your budget, operational requirements, and target demographics
Each neighborhood has detailed analysis available through its city guide, providing block-by-block survivability data for Brunch Restaurants.
From national rank to your shortlist
See also: Best Cities for Brunch Restaurant — our city-level comparison ranks which metros offer the strongest overall conditions for Brunch Restaurants.
Cross-Category Patterns Across the Ranking
Brunch Restaurant success and broader neighborhood quality often correlate. Below are top, middle, and bottom-ranked neighborhoods for Brunch Restaurants along with what else thrives in each:
Tysons, Washington DC — ranked #1 nationally — the strongest neighborhood for Brunch Restaurants (96% survivability for Brunch Restaurant) Other business types that thrive in Tysons:
- Georgian Restaurant (96% survivability)
- Veterinary Clinic (96% survivability)
- Portuguese Restaurant (96% survivability)
These cross-subtype patterns show up consistently — the strongest neighborhoods for Brunch Restaurants aren't one-trick markets.
Visual Data
Related Resources
Explore top cities represented in these neighborhoods:
- St. Louis: Best businesses and neighborhoods
- Philadelphia: Best businesses and neighborhoods
- Chicago: Best businesses and neighborhoods
- Miami: Best businesses and neighborhoods
- Washington DC: Best businesses and neighborhoods
National city rankings: Best cities for Brunch Restaurants
Essential resources:
- How StreetSpring calculates Survivability Scores
- Site selection for landlords
- AI tools for tenant representatives
- StreetSpring vs competitors
Frequently Asked Questions
How does StreetSpring calculate survivability for Brunch Restaurants specifically?
StreetSpring's model calculates survivability for Brunch Restaurants by analyzing the competitive density of existing Brunch Restaurants within each distance band around the address, the projected consumer spending on Brunch Restaurants in that location, mobility patterns that determine likely customer flow, and 80+ additional factors. The resulting survivability score reflects the estimated probability of a new Brunch Restaurant surviving 2+ years at that specific address.
What is the difference between city-level and neighborhood-level survivability rankings for Brunch Restaurants?
City-level rankings reflect average survivability for Brunch Restaurants across all neighborhoods in a given city — useful for identifying which cities offer the best overall conditions. Neighborhood-level rankings go deeper, showing which specific neighborhoods within those cities rank highest. StreetSpring's address-level tool adds a third layer, scoring individual storefronts within any neighborhood.
How should a landlord use this ranking when evaluating tenants for Brunch Restaurants?
Landlords can use this national neighborhood ranking to assess whether their property is in a location favorable to Brunch Restaurants — and by extension, how likely a Brunch Restaurant tenant is to maintain long-term occupancy. If your property is in one of the top 25 neighborhoods, Brunch Restaurants represent a strong tenant category. If not, StreetSpring's address-level tool will show the survivability score for your specific address and which tenant types score highest there.
How can I compare specific addresses within these top neighborhoods?
StreetSpring's address-level tool allows you to input any commercial address and see predicted survivability for Brunch Restaurants. Even within the top-ranked neighborhoods, survivability varies meaningfully by block — address-level scoring is the most precise way to evaluate a specific site.
Are there good opportunities outside the top 25 neighborhoods?
Absolutely. Our analysis covers 1426 neighborhoods across 24 cities. Many neighborhoods outside the top 25 have excellent individual locations for Brunch Restaurants. Neighborhood-level rankings reflect averages — specific addresses within any neighborhood can score well above or below the neighborhood mean. Use city-specific guides and StreetSpring's address-level tool to explore options beyond the top 25.
What type of neighborhood is best for opening a Brunch Restaurant?
The best neighborhoods for Brunch Restaurants share three characteristics: manageable competitive density (few existing direct competitors within the primary trade area), strong consumer spending on this category, and demographic alignment with the typical Brunch Restaurant customer base. In StreetSpring's 2026 data, the top-ranked neighborhoods for Brunch Restaurants combine these factors in a way that produces survivability scores well above the national average of 80.3%. Neighborhoods with dense existing competition or low category spending tend to score significantly lower, regardless of overall foot traffic or prestige.
What makes Tysons in Washington DC the best neighborhood for Brunch Restaurants?
Tysons in Washington DC ranks #1 for Brunch Restaurants with 97% survivability. This reflects favorable competitive dynamics — fewer direct competitors relative to available consumer spending — strong demographic alignment with Brunch Restaurant customers, and local spending patterns that sustain this business category. StreetSpring's model weights these factors across all analyzed neighborhoods nationwide.
How often do neighborhood rankings change?
StreetSpring updates rankings quarterly as new data on business openings, closures, and market conditions becomes available. The current analysis reflects 2026 data. Because competitive conditions shift as new businesses enter or exit a neighborhood, the specific rankings for any given business type can shift between updates — which is why we recommend verifying specific addresses in StreetSpring's live tool before making a final site selection decision.
Technical note: Aggregated national survivability rankings across all 24 metros are available in machine-readable format for research and integration purposes.
StreetSpring recalculates survivability using the latest competitive, demographic, and walkability data, so the live score may differ from the static ranges shown here.
Methodology: Neighborhood rankings are based on average Survivability Scores for Brunch Restaurants across all analyzed locations within each neighborhood. Rankings represent neighborhood-level conditions but do not account for block-by-block variation. Coverage includes 1426 neighborhoods across 24 major US cities.