National Neighborhood Survivability Rankings for Bagel Shop
StreetSpring's 2026 nationwide analysis ranks the top neighborhoods across all major US cities for Bagel Shops. See which neighborhoods offer the highest Survivability Scores.
StreetSpring's 2026 cross-market analysis reveals that Anderson Island in Seattle ranks as the #1 neighborhood in the United States for opening a Bagel Shop, with 97% survivability. The top 25 neighborhoods nationwide span 8 different cities, demonstrating that exceptional opportunities for Bagel Shops exist across diverse markets. Rankings like this are a strong starting point, but the live survivability score in StreetSpring will reflect the most current competitor data for your exact address.
To understand the methodology behind these rankings, see our detailed guide: Survivability Score: How We Calculate It & Why It Matters.
Last reviewed: April 28, 2026 by Bobby Koons, StreetSpring founder — updated weekly
Quick Summary
- #1 Neighborhood: Anderson Island, Seattle — 97% survivability for Bagel Shop
- Neighborhoods analyzed: 8583 across 24 major US cities
- National average survivability: 82.8% for Bagel Shops
- Top-25 average: 94.6% — 11.8% above national average
- Data current as of: 2026 · Full methodology →
Table of Contents
- How neighborhoods compare nationwide
- Top 25 neighborhoods in the US
- Geographic patterns
- How to use this ranking
- Related resources
- Frequently asked questions
Neighborhood-by-neighborhood survivability for Bagel Shops nationwide
Analyzing 8583 neighborhoods across 24 major US cities, StreetSpring's 2026 data shows that the best neighborhoods for Bagel Shops significantly outperform average locations, with the top 25 neighborhoods nationwide averaging 94.6% survivability compared to the national neighborhood average of 82.8%.
Why some metros dominate this business's leaderboard
This 11.8% advantage illustrates how critical neighborhood selection is — choosing a top-tier neighborhood versus an average one can significantly increase your long-term survival chances.
Where the surprising outliers come from
For a Bagel Shop, the survivability advantage of a top-ranked neighborhood (averaging 94.6% versus the national average of 82.8%) translates directly into a longer survival horizon and a stronger revenue capture position. StreetSpring's model identifies Bagel Shops survivability as particularly sensitive to the competitive density of direct and indirect competitors within a quarter-mile radius of the specific address.
Importantly, top-performing neighborhoods aren't concentrated in just a few cities. The top 25 neighborhoods represent 8 different cities. This means entrepreneurs focused on Bagel Shops can find exceptional opportunities across the United States, not just in traditionally strong markets.
Where you open matters more than anything else.
Which US neighborhoods are best for opening a Bagel Shop?
| Comparison factor | Where high-survivability neighborhoods excel | Where lower-survivability neighborhoods fall short |
|---|---|---|
| Commercial rent-to-revenue ratio | Neighborhoods where commercial $/sqft fits the subtype's revenue-per-sqft economics with margin. | Neighborhoods where rent inflation has outrun revenue growth — operators paying lifestyle rents. |
| Median household income alignment | Neighborhoods where median household income fits the subtype's typical customer profile (income elasticity matches). | Neighborhoods where income is either too low for the price tier or too high for the value-perception band. |
| Daytime population concentration | Mixed-use neighborhoods with strong daytime employment density (LEHD LODES > 8K jobs/sq mi). | Pure-residential neighborhoods where daytime population drops below 30% of resident count. |
How density of similar businesses lifts (or hurts) survival
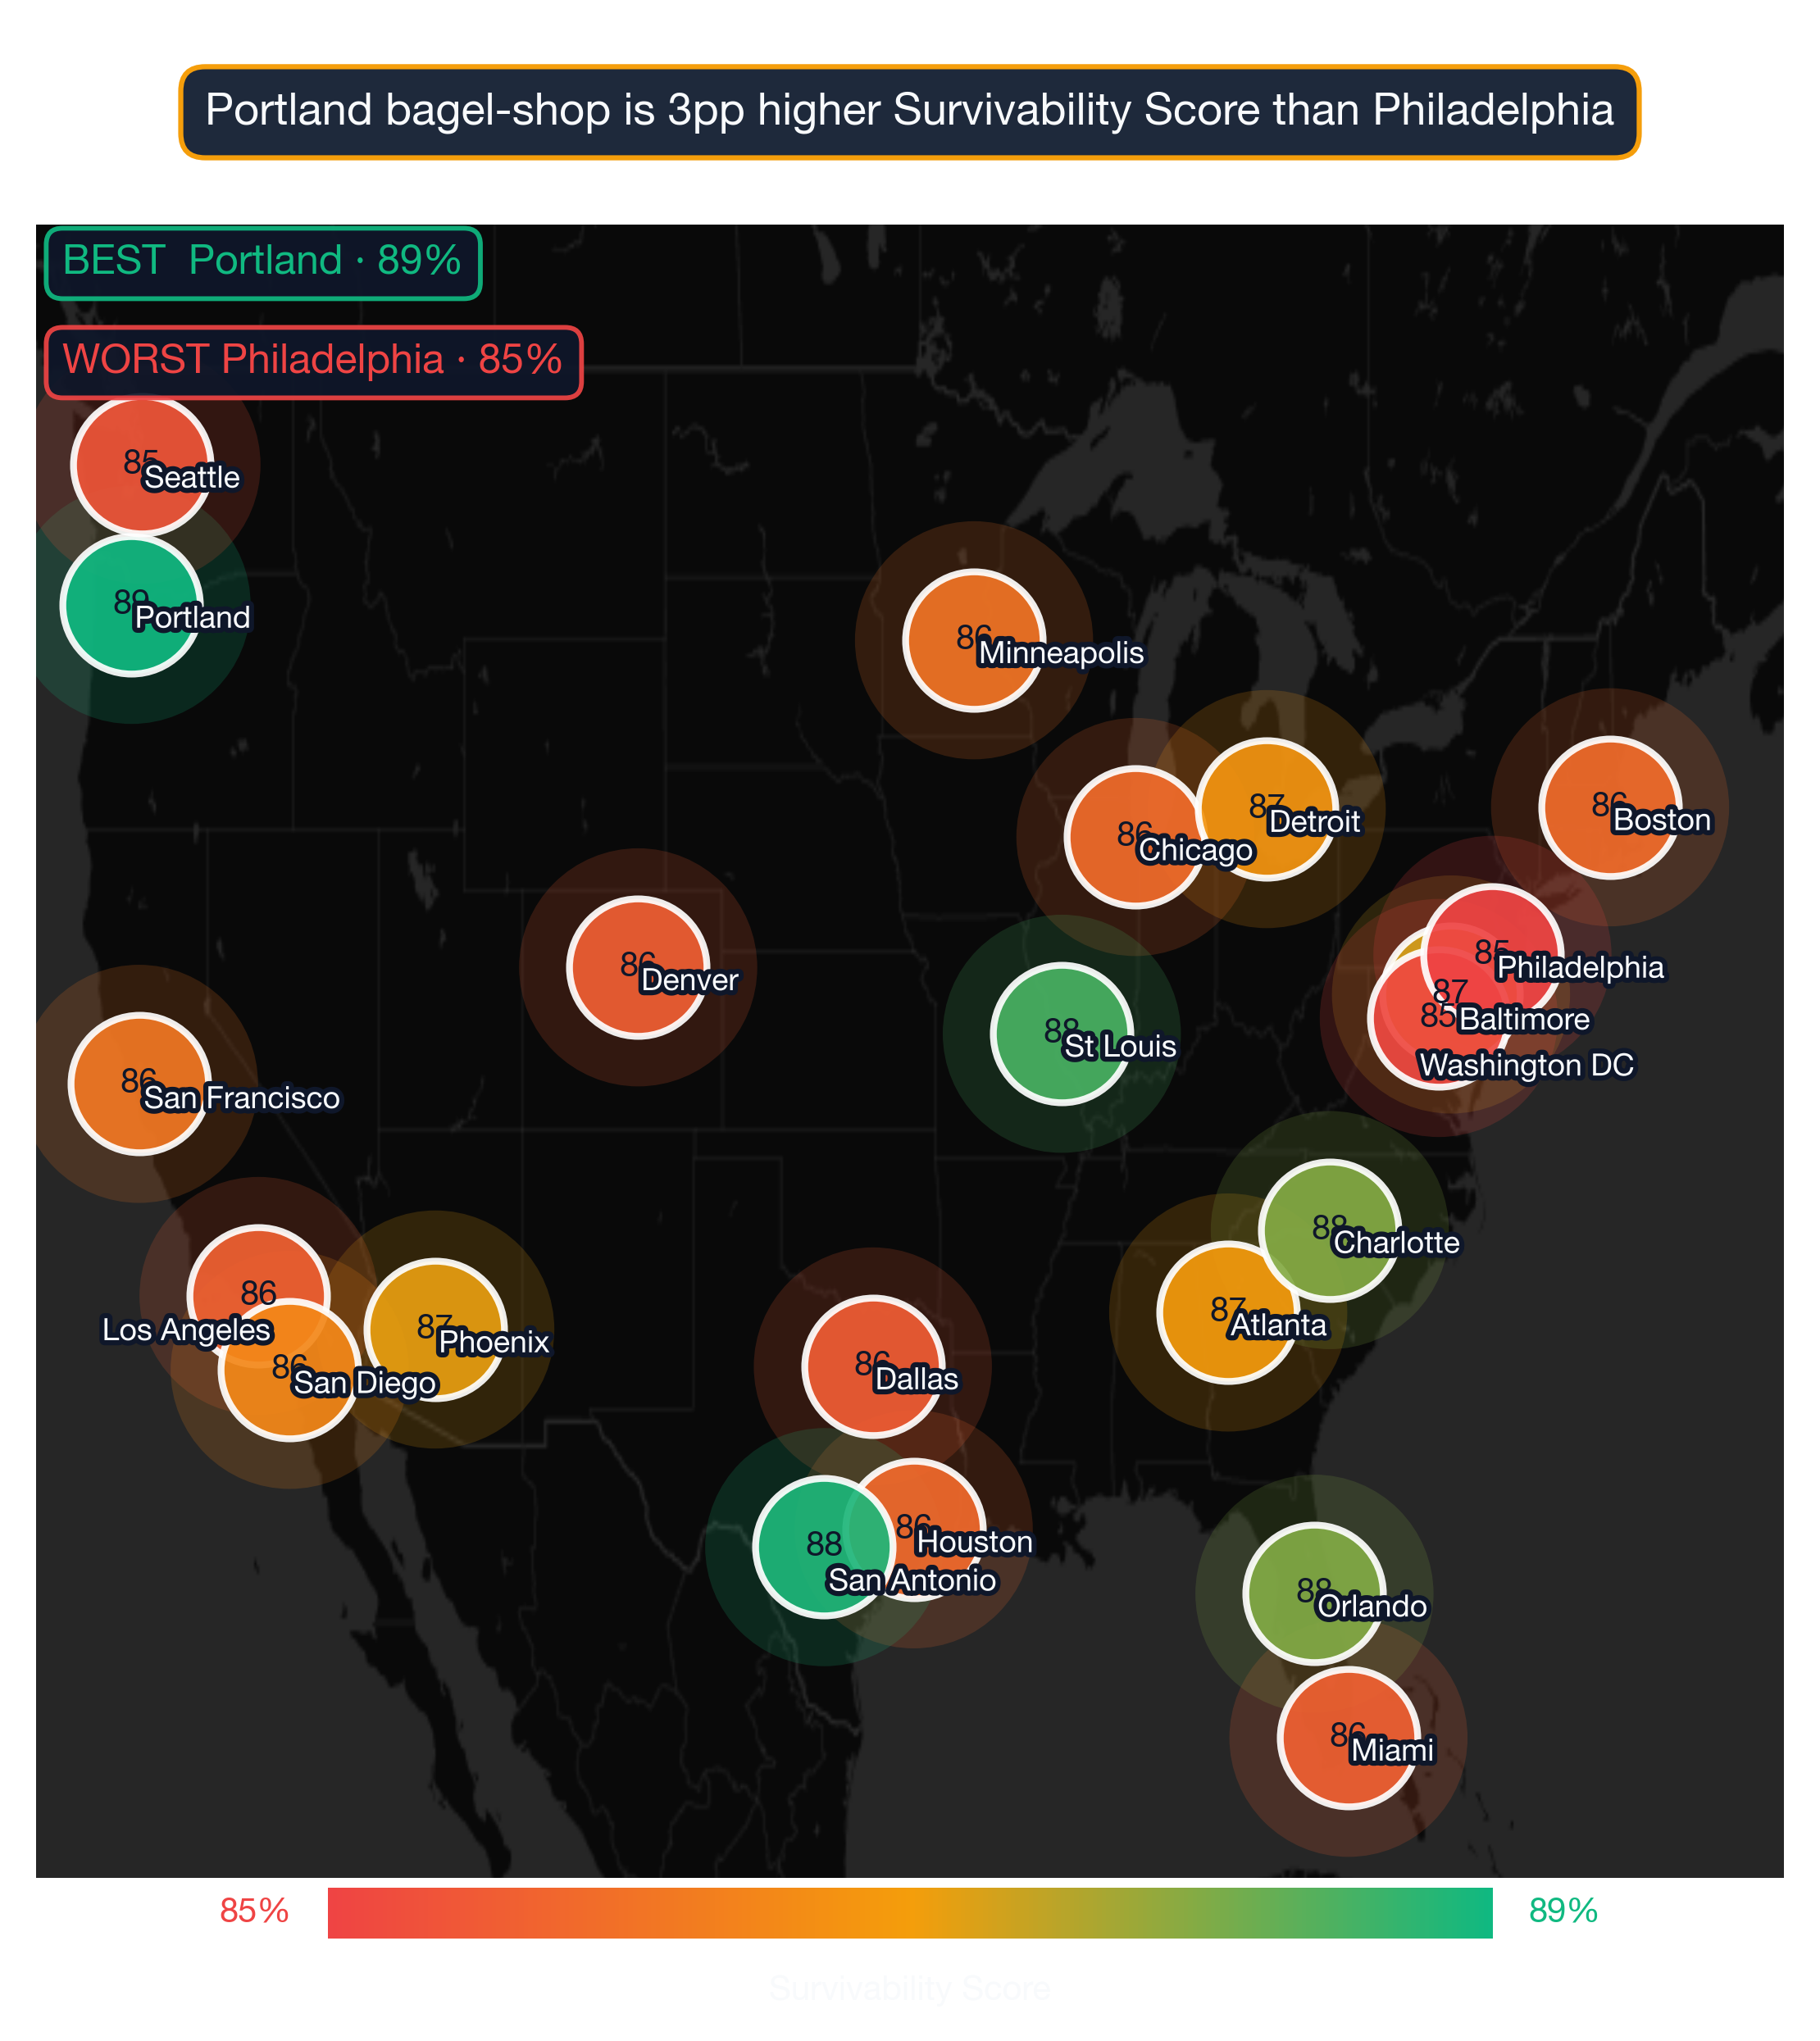
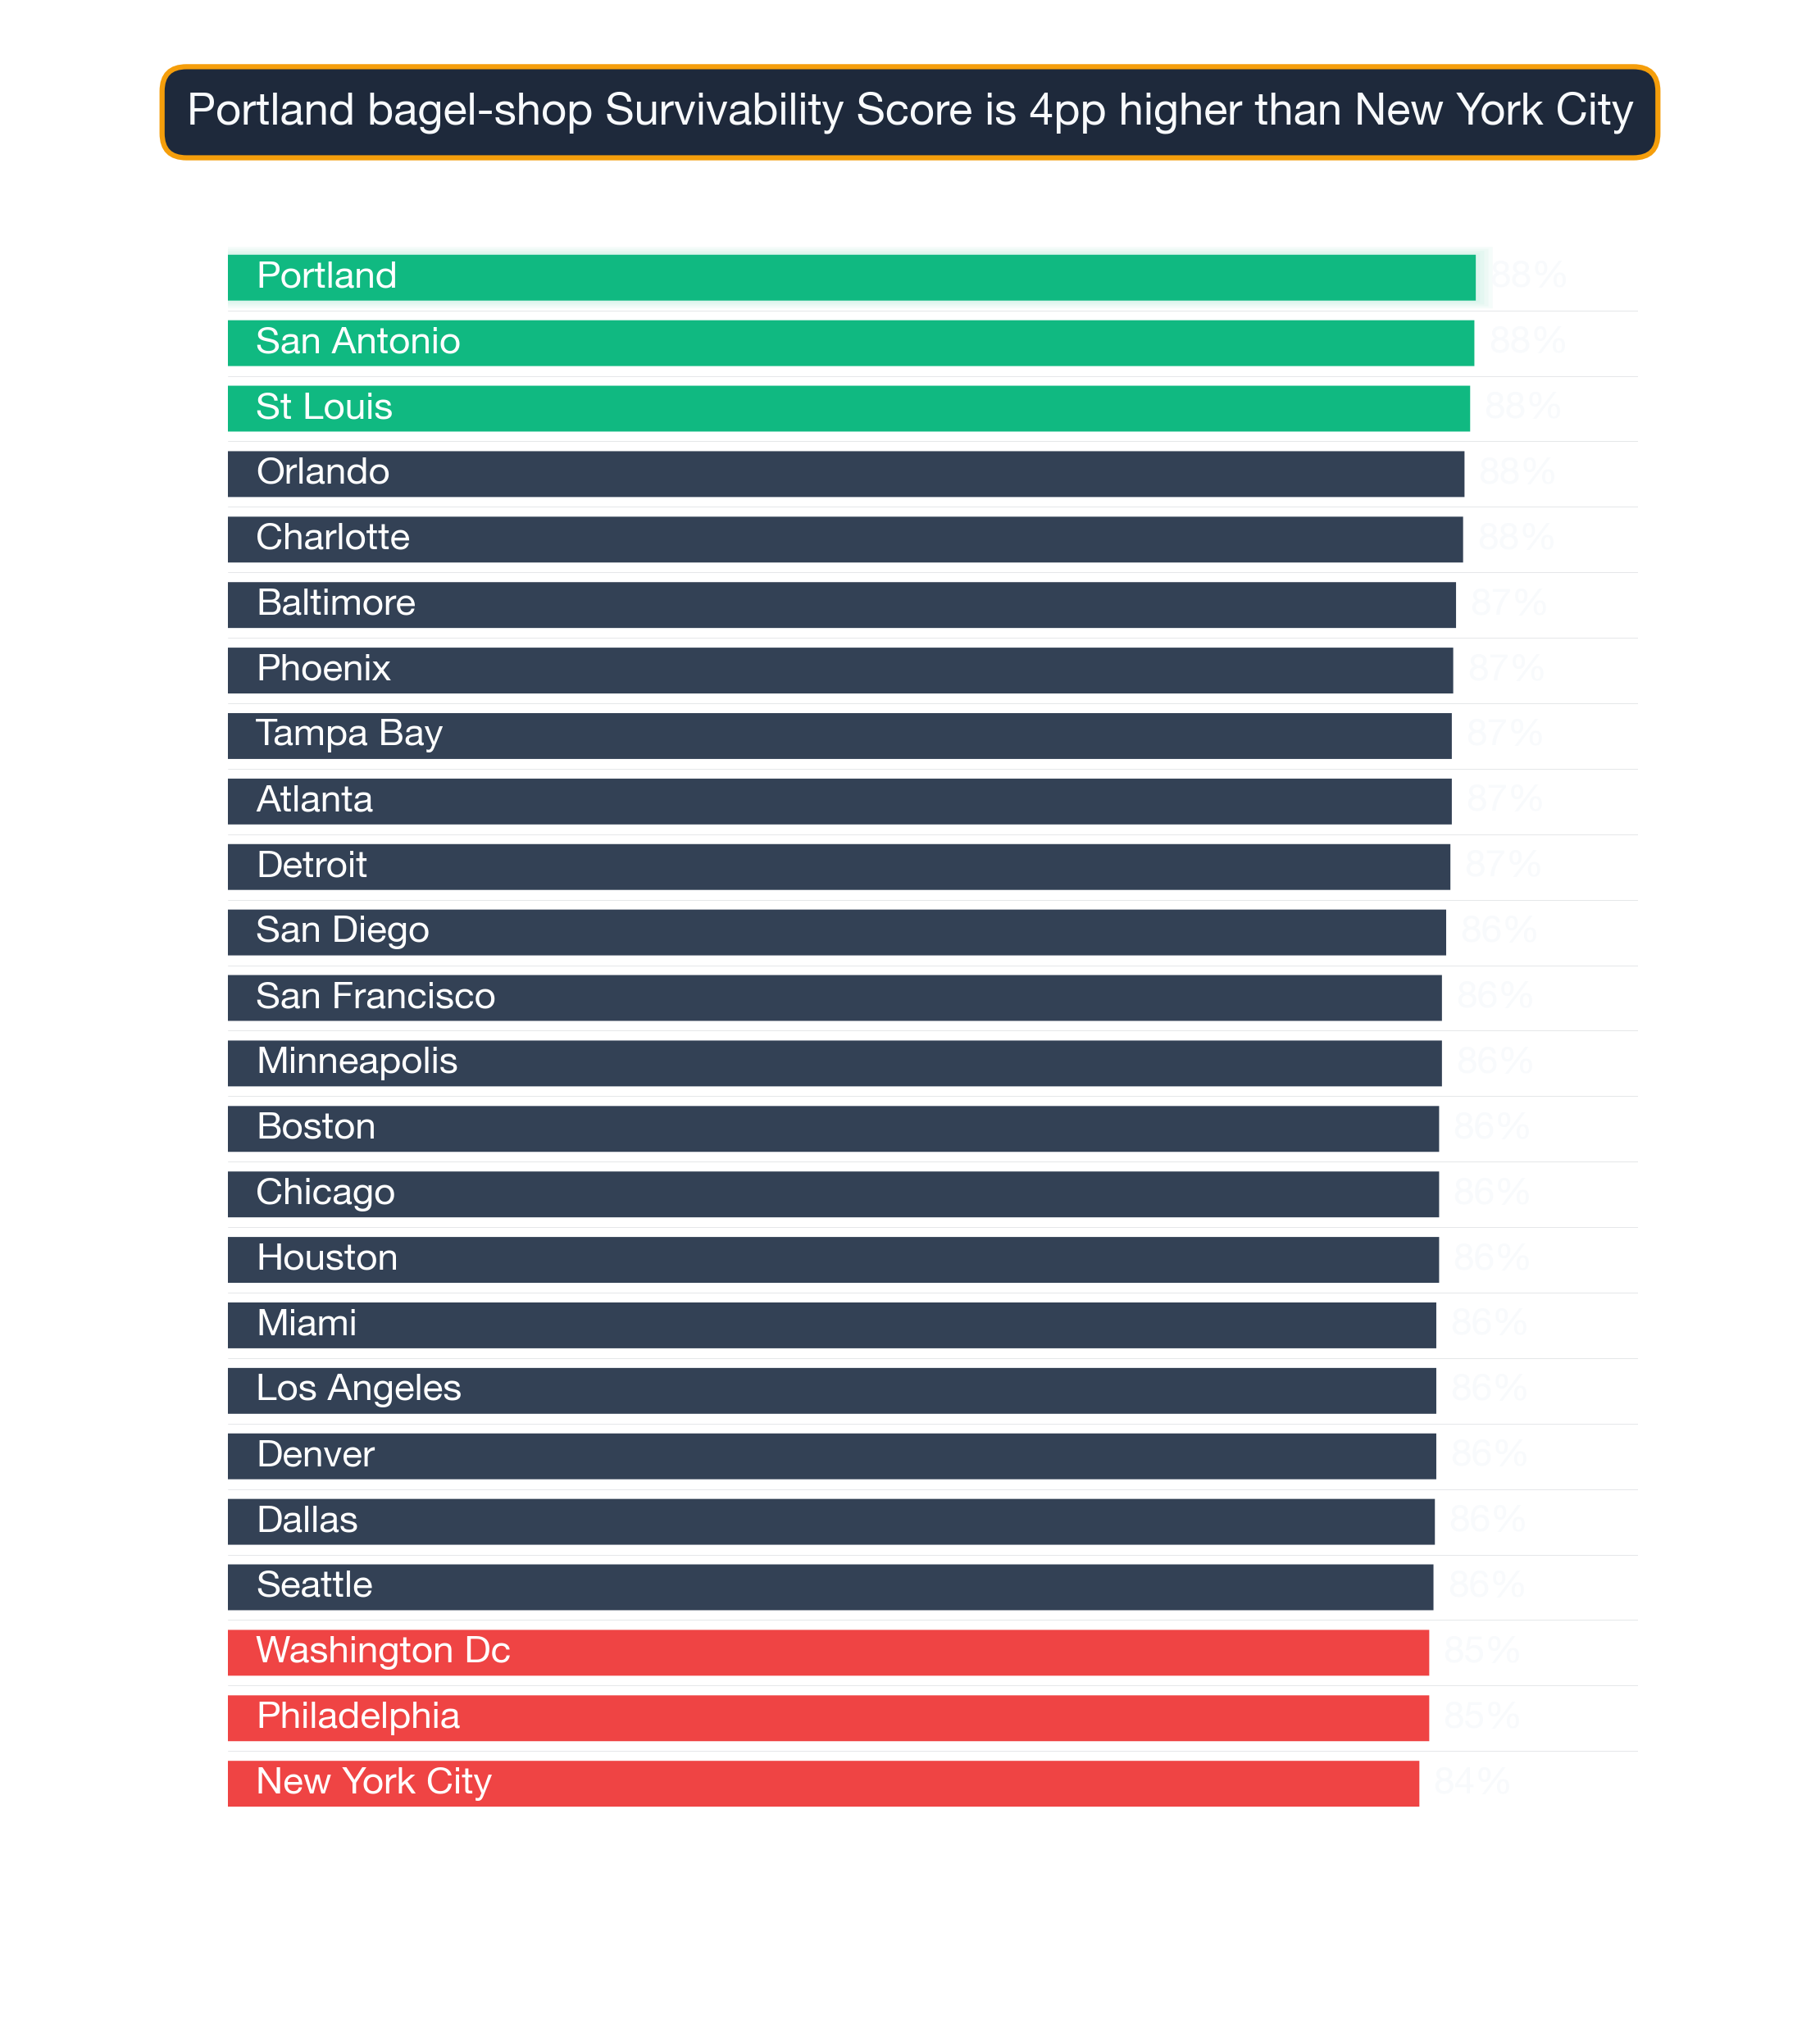
Survivability range for top, middle, and last-ranked neighborhoods. Box = best-to-challenging range; white line = average. Anderson Island, Seattle leads at 97% in 2026. Full methodology →
The top 25 neighborhoods nationwide for Bagel Shops are:
| # | Neighborhood | City | Avg Survival | Tier | Best Locations | Challenging Locations |
|---|---|---|---|---|---|---|
| 1 | Anderson Island | Seattle | 96.8% | Great | 97.0% | 94.8% |
| 2 | Tysons | Washington DC | 95.5% | Great | 97.0% | 93.5% |
| 3 | Villas at Redland Ranch | San Antonio | 95.5% | Great | 97.0% | 93.5% |
| 4 | Dunn Loring | Washington DC | 95.4% | Great | 97.0% | 93.3% |
| 5 | Wolf Trap | Washington DC | 95.4% | Great | 97.0% | 93.3% |
| 6 | West Falls Church | Washington DC | 95.2% | Great | 97.0% | 93.2% |
| 7 | Lake Kathryn | Orlando | 95.2% | Great | 97.0% | 93.2% |
| 8 | Redland Ranch at Elm Creek | San Antonio | 95.0% | Great | 96.9% | 93.0% |
| 9 | Range Rider | San Antonio | 94.7% | Great | 96.5% | 92.6% |
| 10 | Lake Mack-Forest Hills | Orlando | 94.6% | Great | 96.5% | 92.5% |
| 11 | McNair | Washington DC | 94.6% | Great | 96.5% | 92.5% |
| 12 | Floris | Washington DC | 94.5% | Great | 96.4% | 92.5% |
| 13 | Centreville | Washington DC | 94.5% | Great | 96.4% | 92.5% |
| 14 | Hybla Valley | Washington DC | 94.5% | Great | 96.3% | 92.4% |
| 15 | Northville | New York City | 94.4% | Great | 96.3% | 92.4% |
| 16 | Shelter Island | New York City | 94.4% | Great | 96.2% | 92.3% |
| 17 | Grosse Pointe Farms | Detroit | 94.3% | Great | 96.1% | 92.2% |
| 18 | Sully Square | Washington DC | 94.3% | Great | 96.1% | 92.2% |
| 19 | Chantilly | Washington DC | 93.9% | Great | 95.8% | 91.9% |
| 20 | Eatonville | Seattle | 93.9% | Great | 95.7% | 91.8% |
| 21 | Jamesport | New York City | 93.9% | Great | 95.7% | 91.8% |
| 22 | Silverado | Los Angeles | 93.8% | Great | 95.7% | 91.8% |
| 23 | Flovilla | Atlanta | 93.8% | Great | 95.6% | 91.7% |
| 24 | Upper Brookville | New York City | 93.7% | Great | 95.6% | 91.7% |
| 25 | Idylwood | Washington DC | 93.7% | Great | 95.6% | 91.6% |
However, individual locations vary widely, and even in lower-scoring neighborhoods there are pockets that perform exceptionally well.
For a full explanation of how survivability scores and ranges are calculated, see Survivability Score: How We Calculate It & Why It Matters.
What do the top neighborhoods nationwide have in common?
City Concentration
The top 25 neighborhoods span 8 different cities, with Washington DC claiming 11 of the top spots (44%).
Breakdown of top 25 neighborhoods by city:
- Washington DC: 11 neighborhoods (44% of top 25) — View city guide
- New York City: 4 neighborhoods (16% of top 25) — View city guide
- San Antonio: 3 neighborhoods (12% of top 25) — View city guide
- Seattle: 2 neighborhoods (8% of top 25) — View city guide
- Orlando: 2 neighborhoods (8% of top 25) — View city guide
- Detroit: 1 neighborhood (4% of top 25) — View city guide
- Los Angeles: 1 neighborhood (4% of top 25) — View city guide
- Atlanta: 1 neighborhood (4% of top 25) — View city guide
This distribution has practical implications for Bagel Shops operators: cities with multiple neighborhoods in the top 25 offer more site options within a single market, reducing relocation or expansion cost. Cities with a single top-25 neighborhood require more precise site selection — the advantage is concentrated in one area rather than spread across the metro.
Why some neighborhoods score high without being downtown
The concentration of 11 top-ranked neighborhoods in Washington DC (44% of the top 25) is notably high for this business category, suggesting that Washington DC's market conditions — competitive density, consumer spending patterns, and demographic alignment — are unusually favorable for Bagel Shops. Operators targeting this category should treat Washington DC neighborhoods as a primary focus before expanding to secondary markets.
How to apply this ranking when choosing where to open a Bagel Shop
Use this ranking to shortlist neighborhoods, then drill down to specific addresses. StreetSpring's survivability scores are built on a 30-factor competitive analysis framework, giving landlords, tenants, and agents a precision instrument for site selection. The difference between the best and worst blocks within a single top-ranked neighborhood can be as large as the gap between the #1 and #25 neighborhoods on this list.
For the most accurate assessment:
- Consider neighborhoods in the top 25 as strong starting points
- Examine city-specific guides for additional neighborhood options in your target markets
- Use StreetSpring's address-level tool to evaluate specific storefronts within these neighborhoods
- Factor in your budget, operational requirements, and target demographics
Each neighborhood has detailed analysis available through its city guide, providing block-by-block survivability data for Bagel Shops.
Filtering the list to your actual constraints
See also: Best Cities for Bagel Shop — our city-level comparison ranks which metros offer the strongest overall conditions for Bagel Shops.
Visual Data
Related Resources
Explore top cities represented in these neighborhoods:
- New York City: Best businesses and neighborhoods
- Atlanta: Best businesses and neighborhoods
- Orlando: Best businesses and neighborhoods
- Los Angeles: Best businesses and neighborhoods
- Seattle: Best businesses and neighborhoods
National city rankings: Best cities for Bagel Shops
Essential resources:
- How StreetSpring calculates Survivability Scores
- Site selection for landlords
- AI tools for tenant representatives
- StreetSpring vs competitors
Frequently Asked Questions
Are there good opportunities outside the top 25 neighborhoods?
Absolutely. Our analysis covers 8583 neighborhoods across 24 cities. Many neighborhoods outside the top 25 have excellent individual locations for Bagel Shops. Neighborhood-level rankings reflect averages — specific addresses within any neighborhood can score well above or below the neighborhood mean. Use city-specific guides and StreetSpring's address-level tool to explore options beyond the top 25.
What type of neighborhood is best for opening a Bagel Shop?
The best neighborhoods for Bagel Shops share three characteristics: manageable competitive density (few existing direct competitors within the primary trade area), strong consumer spending on this category, and demographic alignment with the typical Bagel Shop customer base. In StreetSpring's 2026 data, the top-ranked neighborhoods for Bagel Shops combine these factors in a way that produces survivability scores well above the national average of 82.8%. Neighborhoods with dense existing competition or low category spending tend to score significantly lower, regardless of overall foot traffic or prestige.
What makes Anderson Island in Seattle the best neighborhood for Bagel Shops?
Anderson Island in Seattle ranks #1 for Bagel Shops with 97% survivability. This reflects favorable competitive dynamics — fewer direct competitors relative to available consumer spending — strong demographic alignment with Bagel Shop customers, and local spending patterns that sustain this business category. StreetSpring's model weights these factors across all analyzed neighborhoods nationwide.
What is the typical survivability range for Bagel Shops in top neighborhoods?
The top 25 neighborhoods nationwide for Bagel Shops average 94.6% survivability. The national average across all analyzed neighborhoods is 82.8%. The spread between top neighborhoods and the national average is 11.8% — representing the tangible survivability advantage of choosing a top-ranked location.
Where can I download the underlying data?
The full national survivability dataset is available as a free download: https://streetspring.com/resources/data/national-survivability-scores-2026.csv. The CSV includes all business subtypes and neighborhoods covered in this analysis, licensed under CC BY 4.0.
How do I interpret a survivability score?
A survivability score represents the estimated probability that a business of a specific type will still be operating at a given location after 2 years. A score of 80% means StreetSpring's model predicts an 80% chance of the business surviving past the 2-year mark at that address. Scores are calculated at the address level and reflect competitive density, consumer spending patterns, mobility data, and 80+ additional factors.
What is the difference between city-level and neighborhood-level survivability rankings for Bagel Shops?
City-level rankings reflect average survivability for Bagel Shops across all neighborhoods in a given city — useful for identifying which cities offer the best overall conditions. Neighborhood-level rankings go deeper, showing which specific neighborhoods within those cities rank highest. StreetSpring's address-level tool adds a third layer, scoring individual storefronts within any neighborhood.
Can a Bagel Shop succeed in neighborhoods outside the top 25?
Yes — the top 25 neighborhoods represent standout conditions, but Bagel Shops can achieve strong survivability in many other neighborhoods as well. What matters is finding a location where competitive density is low enough and consumer spending is strong enough to support the business. StreetSpring's address-level tool identifies high-survivability addresses in any neighborhood, including those not represented in this top-25 list.
Technical note: Aggregated national survivability rankings across all 24 metros are available in machine-readable format for research and integration purposes.
StreetSpring recalculates survivability using the latest competitive, demographic, and walkability data, so the live score may differ from the static ranges shown here.
Methodology: Neighborhood rankings are based on average Survivability Scores for Bagel Shops across all analyzed locations within each neighborhood. Rankings represent neighborhood-level conditions but do not account for block-by-block variation. Coverage includes 8583 neighborhoods across 24 major US cities.