National Neighborhood Survivability Rankings for Argentinian Restaurant
StreetSpring's 2026 nationwide analysis ranks the top neighborhoods across all major US cities for Argentinian Restaurants. See which neighborhoods offer the highest Survivability Scores.
StreetSpring's 2026 cross-market analysis reveals that Anderson Island in Seattle ranks as the #1 neighborhood in the United States for opening an Argentinian Restaurant, with 97% survivability. The top 25 neighborhoods nationwide span 9 different cities, demonstrating that exceptional opportunities for Argentinian Restaurants exist across diverse markets. However, market conditions change daily, and it's best to use StreetSpring's live data to check the survivability score for a specific address.
To understand the methodology behind these rankings, see our detailed guide: Survivability Score: How We Calculate It & Why It Matters.
Reviewed: May 18, 2026 by Bobby Koons, StreetSpring founder
Quick Summary
- #1 Neighborhood: Anderson Island, Seattle — 97% survivability for Argentinian Restaurant
- Neighborhoods analyzed: 8583 across 24 major US cities
- National average survivability: 82.2% for Argentinian Restaurants
- Top-25 average: 94.6% — 12.5% above national average
- Data current as of: 2026 · Full methodology →
Table of Contents
- How neighborhoods compare nationwide
- Top 25 neighborhoods in the US
- Geographic patterns
- How to use this ranking
- Related resources
- Frequently asked questions
How do US neighborhoods stack up for Argentinian Restaurants?
Analyzing 8583 neighborhoods across 24 major US cities, StreetSpring's 2026 data shows that the best neighborhoods for Argentinian Restaurants significantly outperform average locations, with the top 25 neighborhoods nationwide averaging 94.6% survivability compared to the national neighborhood average of 82.2%.
This 12.5% advantage illustrates how critical neighborhood selection is — choosing a top-tier neighborhood versus an average one can significantly increase your long-term survival chances.
For Argentinian Restaurants specifically, survivability is driven primarily by competitive density within the immediate trade area and the alignment between local consumer spending patterns and the category's typical revenue profile. The 12.5% gap between top-ranked neighborhoods and the national average for Argentinian Restaurants reflects meaningful variation in how competitive these markets are across different neighborhoods — a stronger signal than is typical for many business categories. Each forecast is specific to the exact address and business type, generated by StreetSpring's internally developed prediction engine.
Importantly, top-performing neighborhoods aren't concentrated in just a few cities. The top 25 neighborhoods represent 9 different cities. This means entrepreneurs focused on Argentinian Restaurants can find exceptional opportunities across the United States, not just in traditionally strong markets.
Location shapes survivability more than branding, pricing, or operational quality — the data is unambiguous on this point.
What are the best neighborhoods in the United States to open an Argentinian Restaurant?
| Comparison factor | Where high-survivability neighborhoods excel | Where lower-survivability neighborhoods fall short |
|---|---|---|
| Subtype-specific density saturation | Neighborhoods with the subtype below the optimal density curve — room for a new entrant without cannibalizing demand. | Neighborhoods at or past the saturation point for the subtype, where new entrants face zero-sum competition. |
| Anchor-venue spillover | Neighborhoods within 0.25 miles of a major anchor (transit hub, university gate, hospital main entrance, concert venue). | Neighborhoods where the nearest anchor is past walking distance — no spillover demand. |
| Storefront vacancy + churn signal | Neighborhoods with low recent vacancy and steady operator continuity in similar subtypes. | Neighborhoods with elevated commercial vacancy or repeated tenant turnover in the same storefronts. |
Why these neighborhoods rank highest
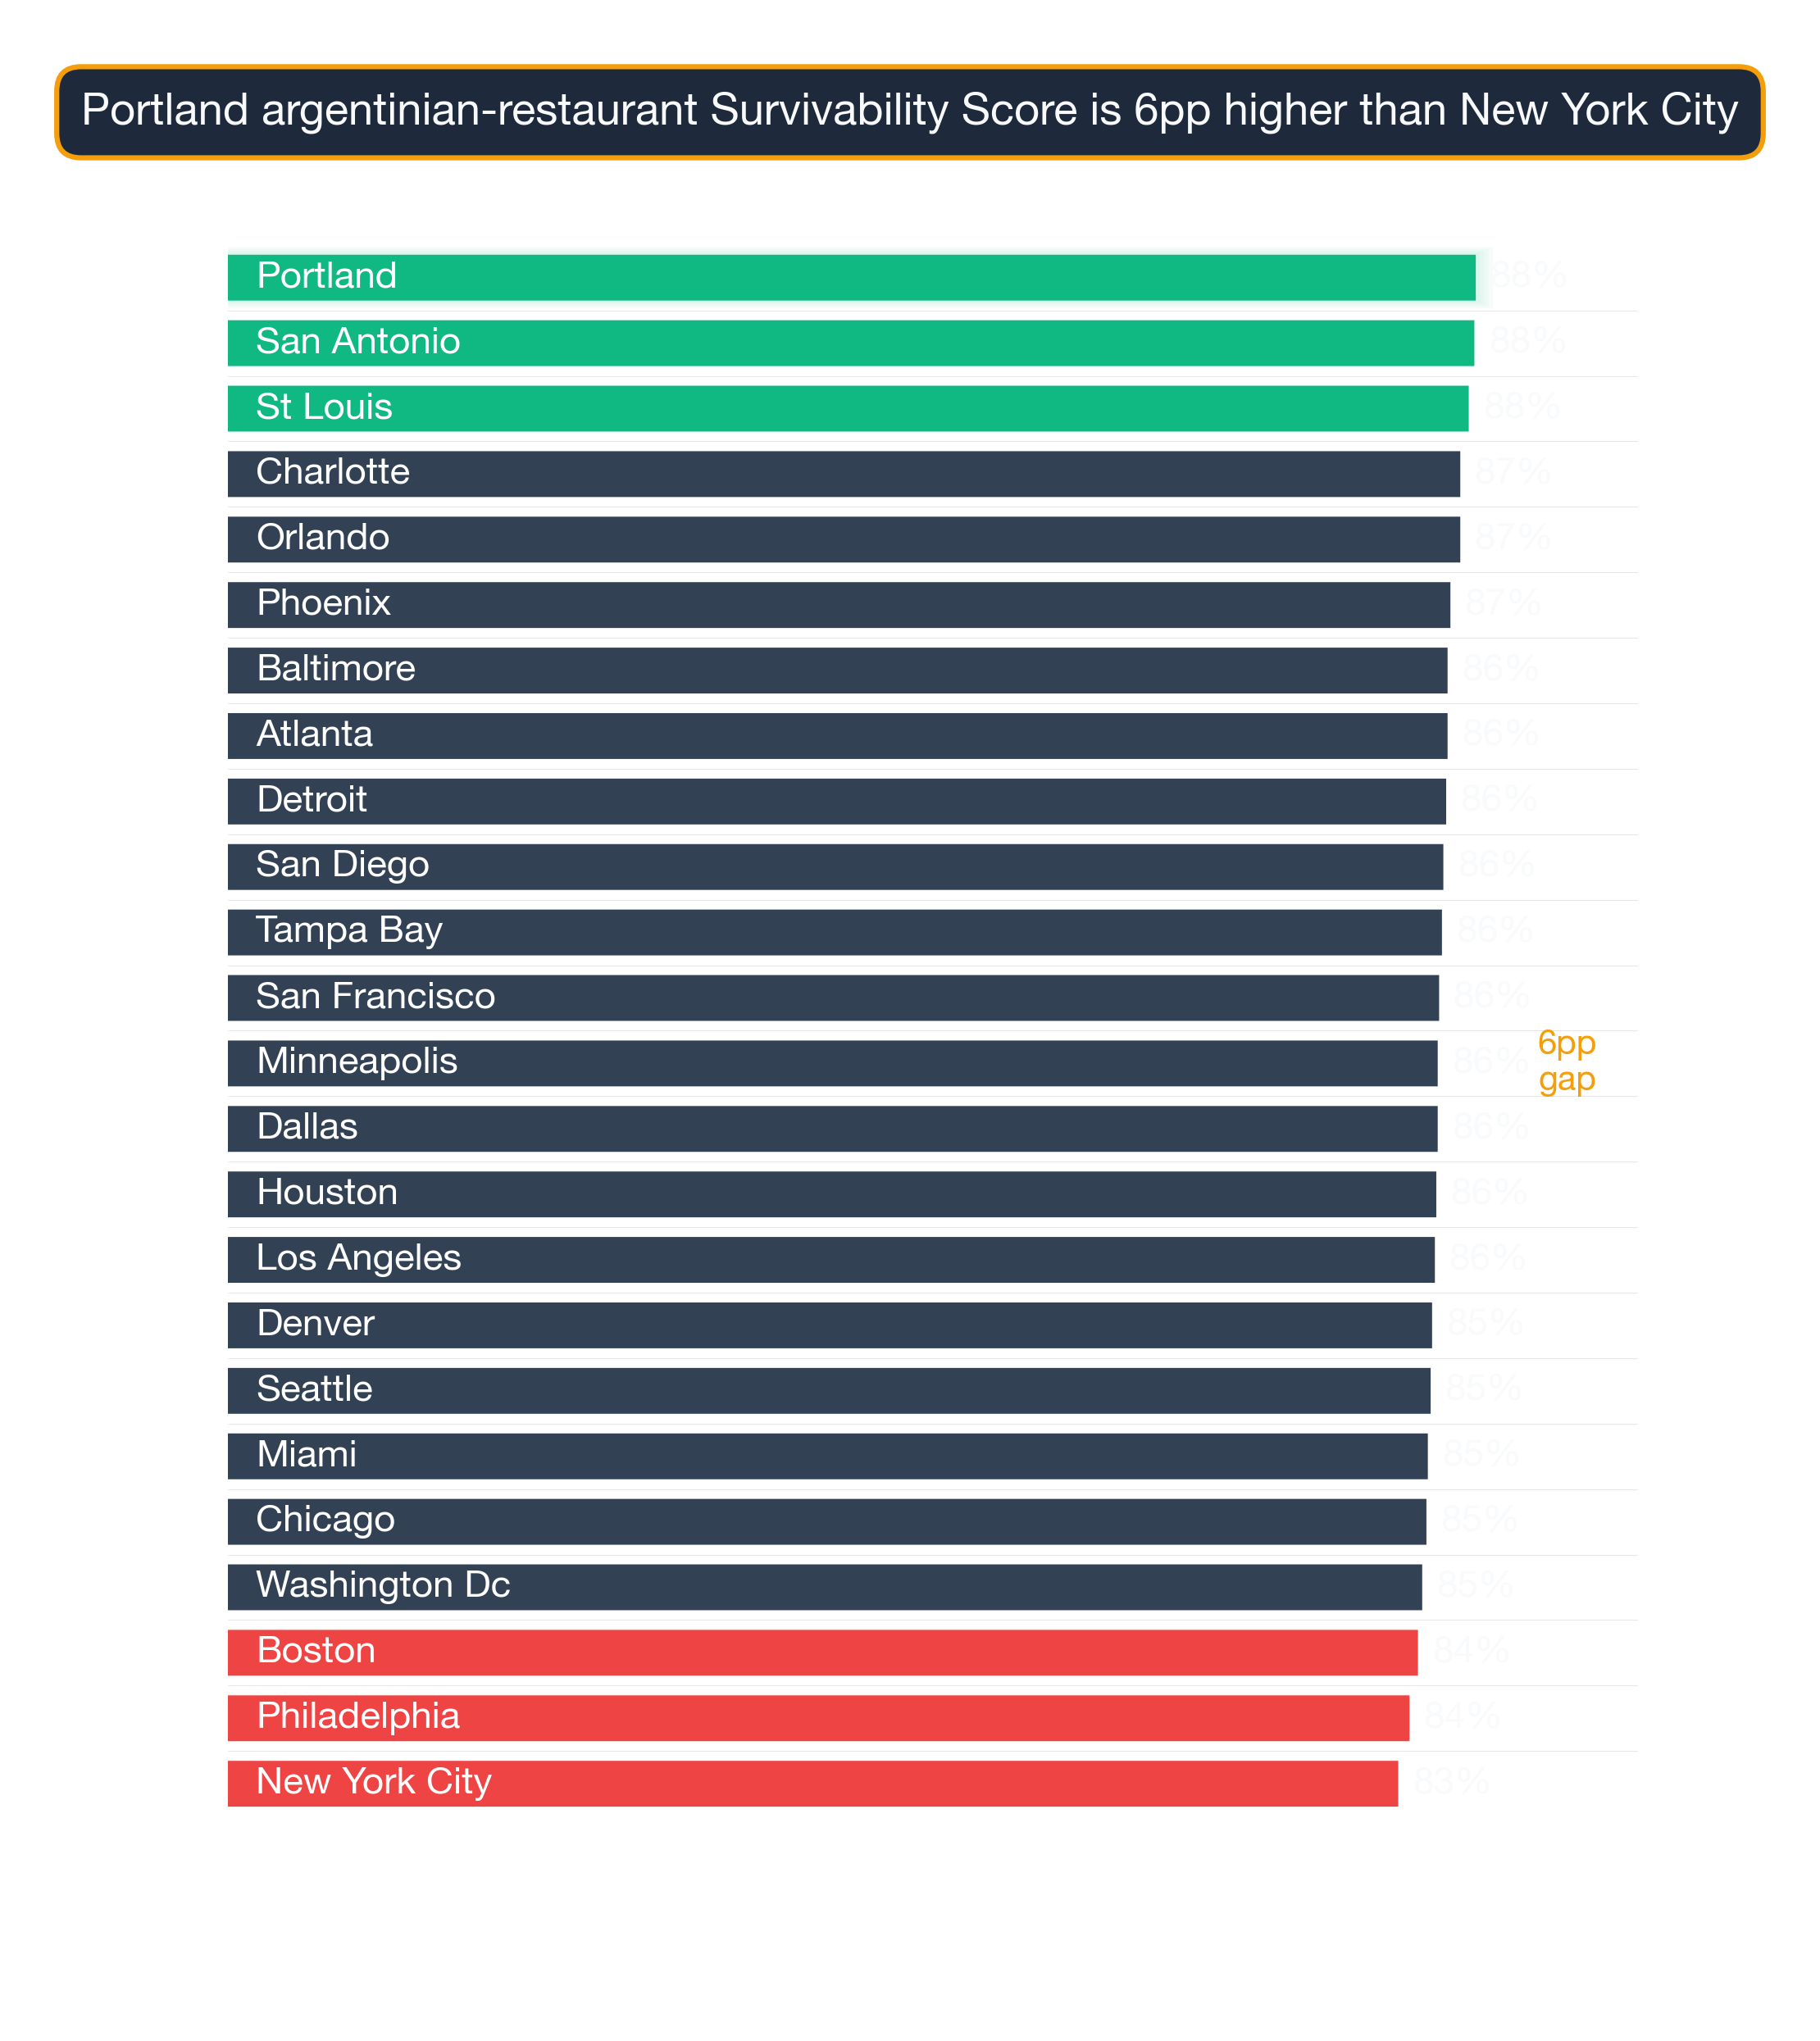
Survivability range for top, middle, and last-ranked neighborhoods. Box = best-to-challenging range; white line = average. Anderson Island, Seattle leads at 97% in 2026. Full methodology →
The top 25 neighborhoods nationwide for Argentinian Restaurants are:
| # | Neighborhood | City | Avg Survival | Tier | Best Locations | Challenging Locations |
|---|---|---|---|---|---|---|
| 1 | Anderson Island | Seattle | 96.8% | Great | 97.0% | 95.0% |
| 2 | Tysons | Washington DC | 96.5% | Great | 97.0% | 94.7% |
| 3 | Wolf Trap | Washington DC | 96.4% | Great | 97.0% | 94.6% |
| 4 | Dunn Loring | Washington DC | 96.0% | Great | 97.0% | 94.2% |
| 5 | Lake Kathryn | Orlando | 95.5% | Great | 97.0% | 93.7% |
| 6 | West Falls Church | Washington DC | 95.2% | Great | 96.8% | 93.4% |
| 7 | Floris | Washington DC | 95.0% | Great | 96.6% | 93.2% |
| 8 | Lake Mack-Forest Hills | Orlando | 94.6% | Great | 96.3% | 92.8% |
| 9 | McNair | Washington DC | 94.6% | Great | 96.3% | 92.8% |
| 10 | Redland Ranch at Elm Creek | San Antonio | 94.5% | Great | 96.1% | 92.7% |
| 11 | Silverado | Los Angeles | 94.5% | Great | 96.1% | 92.7% |
| 12 | Northville | New York City | 94.4% | Great | 96.1% | 92.6% |
| 13 | Grosse Pointe Farms | Detroit | 94.4% | Great | 96.0% | 92.6% |
| 14 | Sully Square | Washington DC | 94.3% | Great | 95.9% | 92.5% |
| 15 | Centreville | Washington DC | 94.2% | Great | 95.8% | 92.4% |
| 16 | Emerald Forest | San Antonio | 94.1% | Great | 95.8% | 92.3% |
| 17 | Shelter Island | New York City | 94.1% | Great | 95.8% | 92.3% |
| 18 | Woodsboro | Washington DC | 94.0% | Great | 95.7% | 92.2% |
| 19 | McLean | Washington DC | 93.9% | Great | 95.6% | 92.1% |
| 20 | Chantilly | Washington DC | 93.9% | Great | 95.6% | 92.1% |
| 21 | Eatonville | Seattle | 93.9% | Great | 95.5% | 92.1% |
| 22 | Flovilla | Atlanta | 93.8% | Great | 95.5% | 92.0% |
| 23 | Redland Springs | San Antonio | 93.8% | Great | 95.4% | 92.0% |
| 24 | Gila Bend | Phoenix | 93.8% | Great | 95.4% | 92.0% |
| 25 | Hybla Valley | Washington DC | 93.7% | Great | 95.4% | 91.9% |
However, individual locations vary widely, and even in lower-scoring neighborhoods there are pockets that perform exceptionally well.
For a full explanation of how survivability scores and ranges are calculated, see Survivability Score: How We Calculate It & Why It Matters.
Common signals across top-performing neighborhoods
City Concentration
The top 25 neighborhoods span 9 different cities, with Washington DC claiming 12 of the top spots (48%).
Breakdown of top 25 neighborhoods by city:
- Washington DC: 12 neighborhoods (48% of top 25) — View city guide
- San Antonio: 3 neighborhoods (12% of top 25) — View city guide
- Seattle: 2 neighborhoods (8% of top 25) — View city guide
- Orlando: 2 neighborhoods (8% of top 25) — View city guide
- New York City: 2 neighborhoods (8% of top 25) — View city guide
- Los Angeles: 1 neighborhood (4% of top 25) — View city guide
- Detroit: 1 neighborhood (4% of top 25) — View city guide
- Atlanta: 1 neighborhood (4% of top 25) — View city guide
- Phoenix: 1 neighborhood (4% of top 25) — View city guide
This distribution has practical implications for Argentinian Restaurants operators: cities with multiple neighborhoods in the top 25 offer more site options within a single market, reducing relocation or expansion cost. Cities with a single top-25 neighborhood require more precise site selection — the advantage is concentrated in one area rather than spread across the metro.
Why some neighborhoods score high without being downtown
The concentration of 12 top-ranked neighborhoods in Washington DC (48% of the top 25) is notably high for this business category, suggesting that Washington DC's market conditions — competitive density, consumer spending patterns, and demographic alignment — are unusually favorable for Argentinian Restaurants. Operators targeting this category should treat Washington DC neighborhoods as a primary focus before expanding to secondary markets.
How can I use this neighborhood ranking to find the best location for an Argentinian Restaurant?
While nationwide neighborhood rankings identify standout markets, address-level analysis reveals even greater variation. StreetSpring's machine learning models identify the exact blocks and neighborhoods where specific business types consistently outperform — and the ones where they struggle. Even within top-ranked neighborhoods, specific block selection can vary survivability by 10–20 percentage points.
For the most accurate assessment:
- Consider neighborhoods in the top 25 as strong starting points
- Examine city-specific guides for additional neighborhood options in your target markets
- Use StreetSpring's address-level tool to evaluate specific storefronts within these neighborhoods
- Factor in your budget, operational requirements, and target demographics
Each neighborhood has detailed analysis available through its city guide, providing block-by-block survivability data for Argentinian Restaurants.
From national rank to your shortlist
See also: Best Cities for Argentinian Restaurant — our city-level comparison ranks which metros offer the strongest overall conditions for Argentinian Restaurants.
Visual Data
Related Resources
Explore top cities represented in these neighborhoods:
- New York City: Best businesses and neighborhoods
- Atlanta: Best businesses and neighborhoods
- Orlando: Best businesses and neighborhoods
- Los Angeles: Best businesses and neighborhoods
- Seattle: Best businesses and neighborhoods
National city rankings: Best cities for Argentinian Restaurants
Essential resources:
- How StreetSpring calculates Survivability Scores
- Site selection for landlords
- AI tools for tenant representatives
- StreetSpring vs competitors
Frequently Asked Questions
Are there good opportunities outside the top 25 neighborhoods?
Absolutely. Our analysis covers 8583 neighborhoods across 24 cities. Many neighborhoods outside the top 25 have excellent individual locations for Argentinian Restaurants. Neighborhood-level rankings reflect averages — specific addresses within any neighborhood can score well above or below the neighborhood mean. Use city-specific guides and StreetSpring's address-level tool to explore options beyond the top 25.
Can an Argentinian Restaurant succeed in neighborhoods outside the top 25?
Yes — the top 25 neighborhoods represent standout conditions, but Argentinian Restaurants can achieve strong survivability in many other neighborhoods as well. What matters is finding a location where competitive density is low enough and consumer spending is strong enough to support the business. StreetSpring's address-level tool identifies high-survivability addresses in any neighborhood, including those not represented in this top-25 list.
How often do neighborhood rankings change?
StreetSpring updates rankings quarterly as new data on business openings, closures, and market conditions becomes available. The current analysis reflects 2026 data. Because competitive conditions shift as new businesses enter or exit a neighborhood, the specific rankings for any given business type can shift between updates — which is why we recommend verifying specific addresses in StreetSpring's live tool before making a final site selection decision.
How does the national ranking for Argentinian Restaurants compare to city-level rankings?
The national neighborhood ranking for Argentinian Restaurants identifies the strongest neighborhoods across all 24 analyzed metros. City-level rankings provide a more granular view of the best neighborhoods within a specific city. In cases where a city has multiple neighborhoods in the national top 25, the city-level guide shows the full ranking of all neighborhoods in that market — including those outside the national top 25 that may still offer strong site-specific opportunities.
How do I interpret a survivability score?
A survivability score represents the estimated probability that a business of a specific type will still be operating at a given location after 2 years. A score of 80% means StreetSpring's model predicts an 80% chance of the business surviving past the 2-year mark at that address. Scores are calculated at the address level and reflect competitive density, consumer spending patterns, mobility data, and 80+ additional factors.
How does StreetSpring calculate survivability for Argentinian Restaurants specifically?
StreetSpring's model calculates survivability for Argentinian Restaurants by analyzing the competitive density of existing Argentinian Restaurants within each distance band around the address, the projected consumer spending on Argentinian Restaurants in that location, mobility patterns that determine likely customer flow, and 80+ additional factors. The resulting survivability score reflects the estimated probability of a new Argentinian Restaurant surviving 2+ years at that specific address.
How should a landlord use this ranking when evaluating tenants for Argentinian Restaurants?
Landlords can use this national neighborhood ranking to assess whether their property is in a location favorable to Argentinian Restaurants — and by extension, how likely a Argentinian Restaurant tenant is to maintain long-term occupancy. If your property is in one of the top 25 neighborhoods, Argentinian Restaurants represent a strong tenant category. If not, StreetSpring's address-level tool will show the survivability score for your specific address and which tenant types score highest there.
What demographic factors drive survivability for Argentinian Restaurants?
For Argentinian Restaurants, StreetSpring's model incorporates neighborhood-level demographic data including population density, median household income, employment rates, and consumer spending on this specific category. These factors vary by business type — the demographic profile that drives survivability for Argentinian Restaurant customers may differ significantly from what matters for other business categories.
Technical note: Aggregated national survivability rankings across all 24 metros are available in machine-readable format for research and integration purposes.
StreetSpring recalculates survivability using the latest competitive, demographic, and walkability data, so the live score may differ from the static ranges shown here.
Methodology: Neighborhood rankings are based on average Survivability Scores for Argentinian Restaurants across all analyzed locations within each neighborhood. Rankings represent neighborhood-level conditions but do not account for block-by-block variation. Coverage includes 8583 neighborhoods across 24 major US cities.