National Neighborhood Survivability Rankings for American Restaurant
StreetSpring's 2026 nationwide analysis ranks the top neighborhoods across all major US cities for American Restaurants. See which neighborhoods offer the highest Survivability Scores.
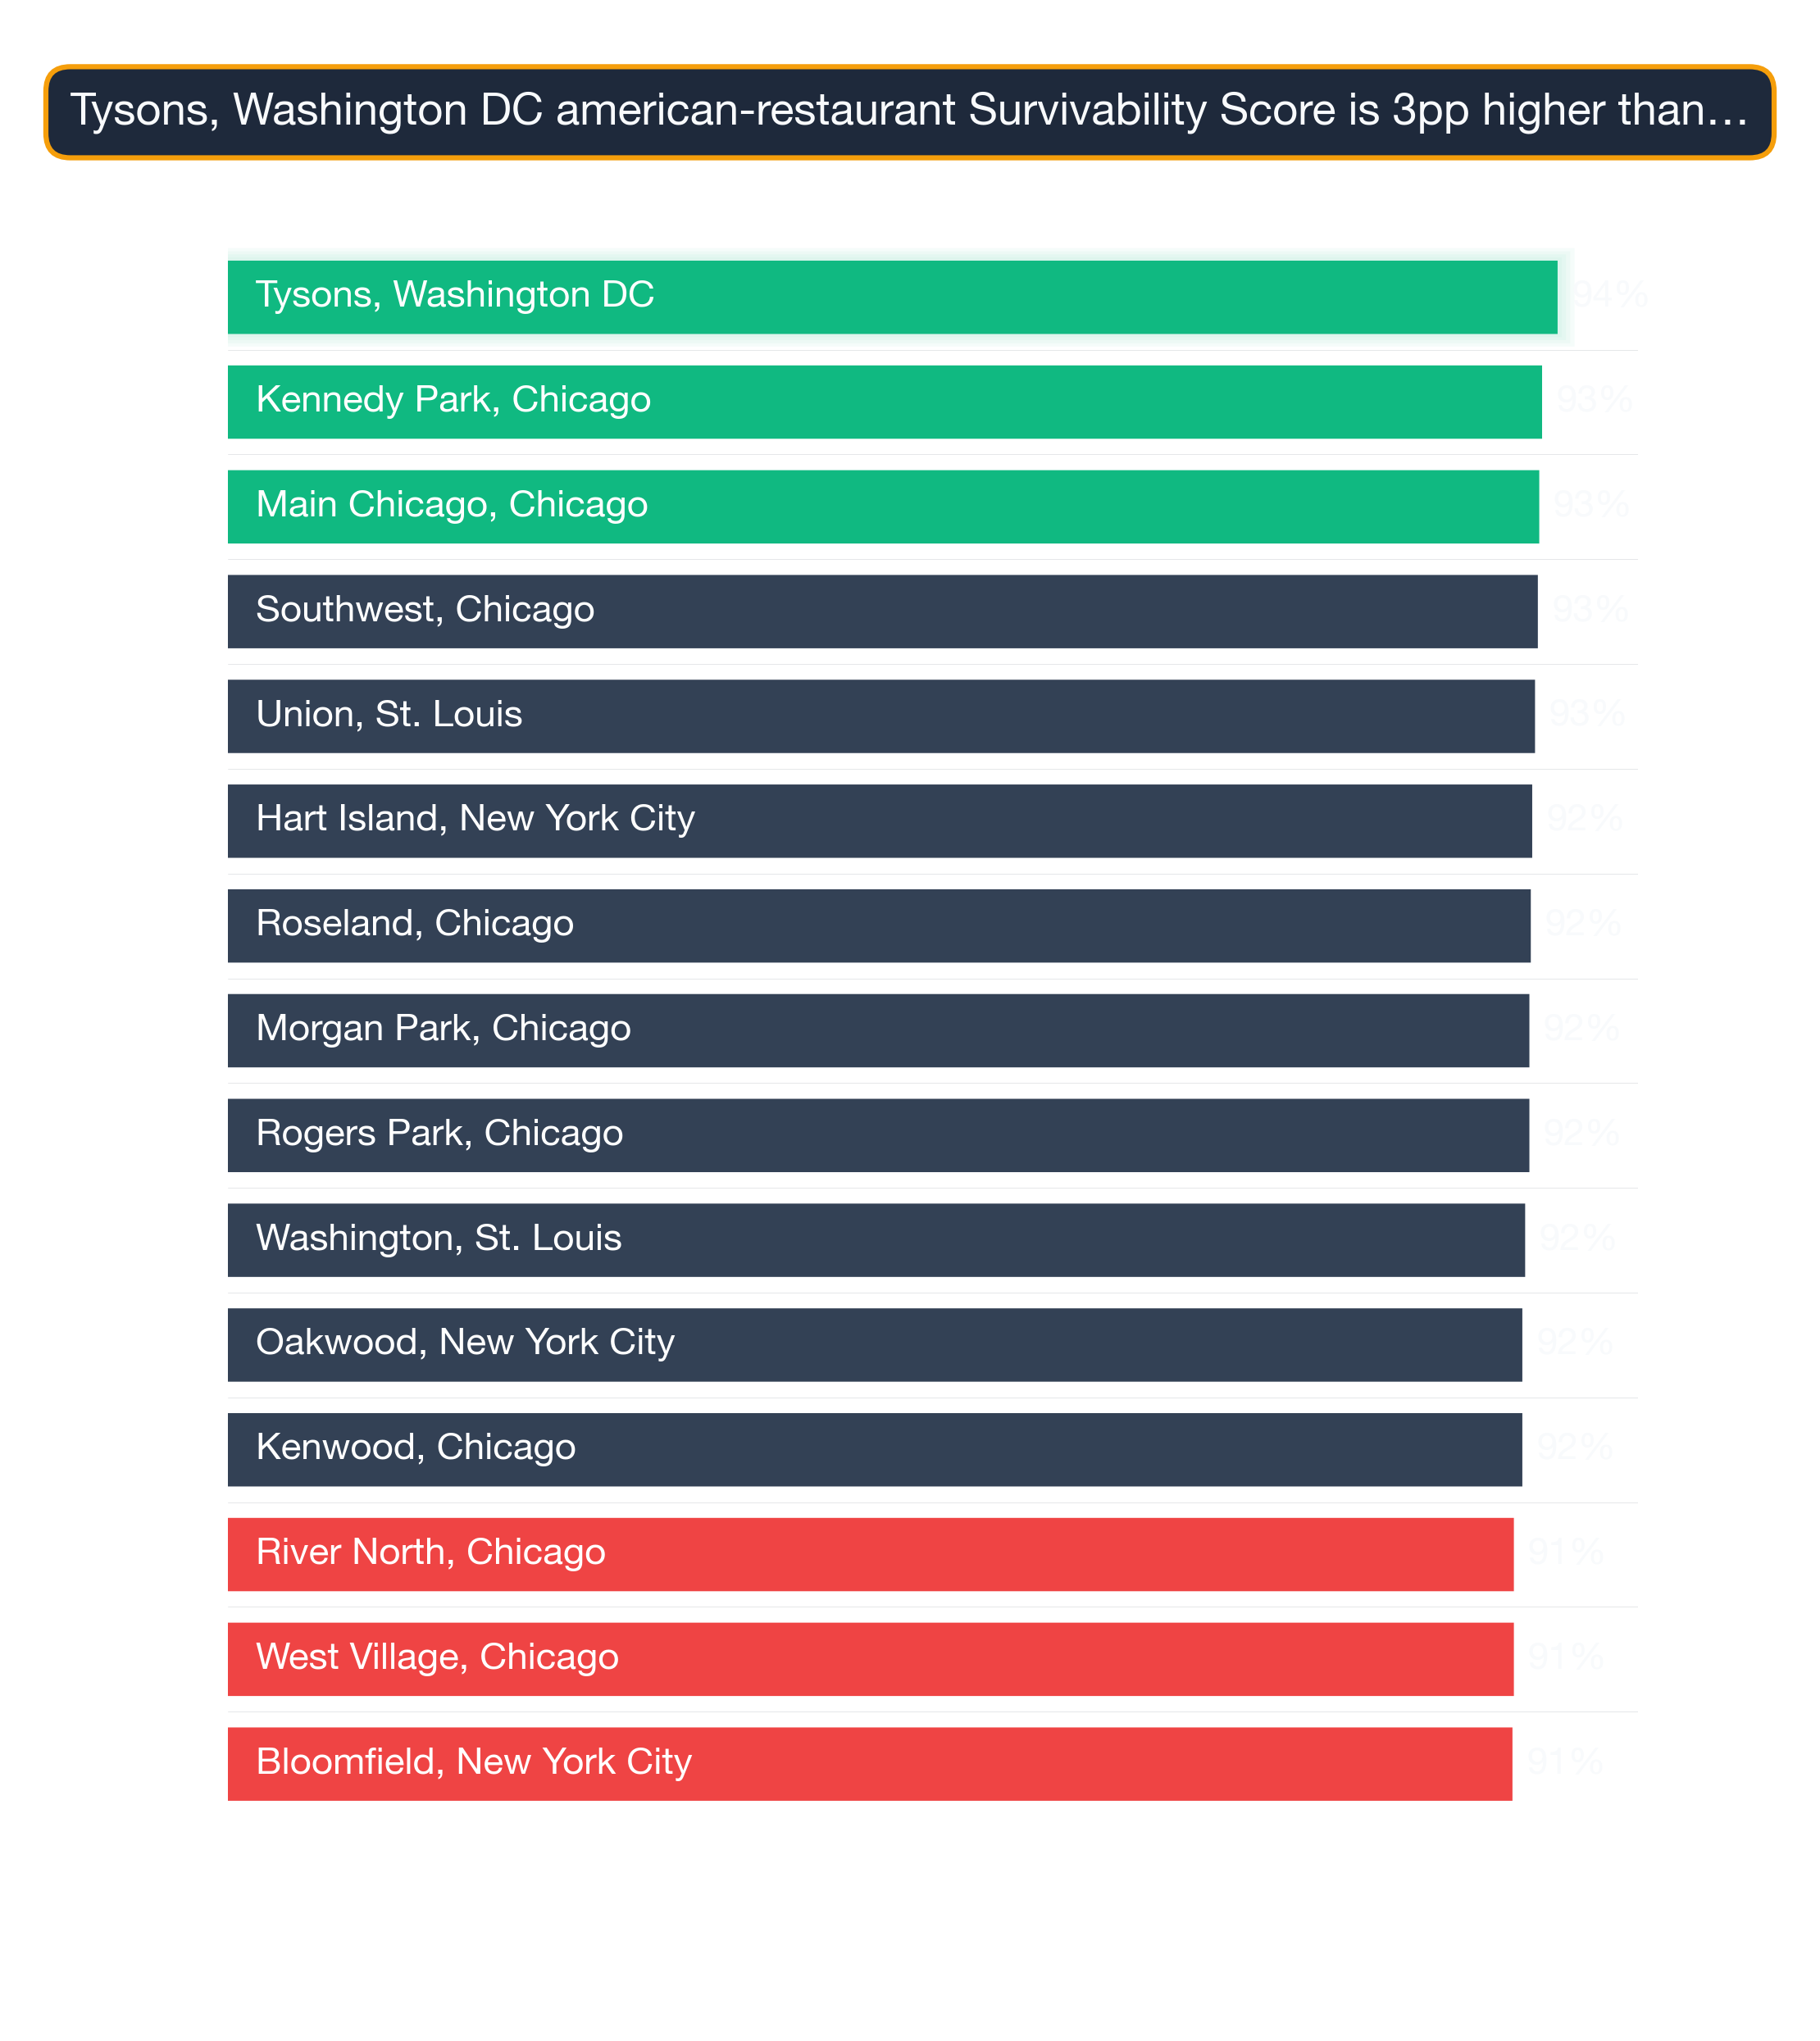
StreetSpring's 2026 cross-market analysis reveals that Tysons in Washington DC ranks as the #1 neighborhood in the United States for opening an American Restaurant, with 94% survivability. The top 25 neighborhoods nationwide span 5 different cities, demonstrating that exceptional opportunities for American Restaurants exist across diverse markets. However, market conditions change daily, and it's best to use StreetSpring's live data to check the survivability score for a specific address.
To understand the methodology behind these rankings, see our detailed guide: Survivability Score: How We Calculate It & Why It Matters.
Reviewed: May 4, 2026 by Bobby Koons, StreetSpring founder
Quick Summary
- #1 Neighborhood: Tysons, Washington DC — 94% survivability for American Restaurant
- Neighborhoods analyzed: 1426 across 24 major US cities
- National average survivability: 81.0% for American Restaurants
- Top-25 average: 91.5% — 10.5% above national average
- Data current as of: 2026 · Full methodology →
Table of Contents
- How neighborhoods compare nationwide
- Top 25 neighborhoods in the US
- Geographic patterns
- How to use this ranking
- Related resources
- Frequently asked questions
How do US neighborhoods stack up for American Restaurants?
Analyzing 1426 neighborhoods across 24 major US cities, StreetSpring's 2026 data shows that the best neighborhoods for American Restaurants significantly outperform average locations, with the top 25 neighborhoods nationwide averaging 91.5% survivability compared to the national neighborhood average of 81.0%.
This 10.5% advantage illustrates how critical neighborhood selection is — choosing a top-tier neighborhood versus an average one can significantly increase your long-term survival chances.
What separates the top neighborhoods for American Restaurants from the national average is not simply higher foot traffic — it is a favorable ratio of consumer spending on this category to competitive supply. The 10.5% advantage that top neighborhoods hold is built on structural conditions: the right consumer demographics, manageable competition density, and mobility patterns that route target customers past the storefront. Our platform draws on 100+ location-specific factors to generate each survivability score.
Importantly, top-performing neighborhoods aren't concentrated in just a few cities. The top 25 neighborhoods represent 5 different cities. This means entrepreneurs focused on American Restaurants can find exceptional opportunities across the United States, not just in traditionally strong markets.
Among all variables that affect business outcomes, location has the highest predictive weight in our models.
The strongest US neighborhoods for opening an American Restaurant
| Signal | Top-quartile neighborhood pattern | Bottom-quartile neighborhood pattern |
|---|---|---|
| Daytime population concentration | Mixed-use neighborhoods with strong daytime employment density (LEHD LODES > 8K jobs/sq mi). | Pure-residential neighborhoods where daytime population drops below 30% of resident count. |
| Anchor-venue spillover | Neighborhoods within 0.25 miles of a major anchor (transit hub, university gate, hospital main entrance, concert venue). | Neighborhoods where the nearest anchor is past walking distance — no spillover demand. |
| Walk Score + foot-traffic alignment | Neighborhoods where Walk Score (90+) matches actual measured pedestrian volume — not just street-grid promise. | High Walk Score scores driven by transit density but with sparse street-level retail engagement. |
Why these neighborhoods rank highest
Survivability range for top, middle, and last-ranked neighborhoods. Box = best-to-challenging range; white line = average. Tysons, Washington DC leads at 94% in 2026. Full methodology →
The top 25 neighborhoods nationwide for American Restaurants are:
| # | Neighborhood | City | Avg Survival | Tier | Best Locations | Challenging Locations |
|---|---|---|---|---|---|---|
| 1 | Tysons | Washington DC | 94.3% | Great | 95.6% | 92.4% |
| 2 | Kennedy Park | Chicago | 93.2% | Great | 94.5% | 91.3% |
| 3 | Main-Chicago | Chicago | 93.0% | Great | 94.3% | 91.0% |
| 4 | Southwest | Chicago | 92.9% | Great | 94.2% | 91.0% |
| 5 | Union | St. Louis | 92.7% | Great | 94.0% | 90.7% |
| 6 | Roseland | Chicago | 92.4% | Great | 93.7% | 90.5% |
| 7 | Rogers Park | Chicago | 92.3% | Great | 93.6% | 90.4% |
| 8 | Morgan Park | Chicago | 92.3% | Great | 93.6% | 90.4% |
| 9 | Washington | St. Louis | 92.0% | Great | 93.3% | 90.1% |
| 10 | Kenwood | Chicago | 91.8% | Great | 93.1% | 89.9% |
| 11 | West Village | Chicago | 91.2% | Great | 92.5% | 89.3% |
| 12 | River North | Chicago | 91.2% | Great | 92.5% | 89.3% |
| 13 | Troy | St. Louis | 91.1% | Great | 92.4% | 89.2% |
| 14 | West Town | Chicago | 90.9% | Great | 92.2% | 89.0% |
| 15 | Margate Park | Chicago | 90.8% | Great | 92.1% | 88.8% |
| 16 | Noble Square | Chicago | 90.8% | Great | 92.1% | 88.8% |
| 17 | Wildwood | Chicago | 90.7% | Great | 92.0% | 88.8% |
| 18 | Peninsula | Los Angeles | 90.7% | Great | 92.0% | 88.7% |
| 19 | Mayfair | Chicago | 90.5% | Great | 91.8% | 88.6% |
| 20 | Andersonville | Chicago | 90.4% | Great | 91.7% | 88.5% |
| 21 | Ravenswood | Chicago | 90.4% | Great | 91.7% | 88.5% |
| 22 | Festus | St. Louis | 90.4% | Great | 91.7% | 88.5% |
| 23 | Edgewater | Chicago | 90.4% | Great | 91.7% | 88.4% |
| 24 | Budlong Woods | Chicago | 90.2% | Great | 91.5% | 88.3% |
| 25 | Galt Mile | Miami | 90.1% | Great | 91.4% | 88.2% |
Keep in mind that results depend heavily on the exact location; strong sites often exist within neighborhoods that seem less favorable overall.
For a full explanation of how survivability scores and ranges are calculated, see Survivability Score: How We Calculate It & Why It Matters.
What's true of every top-ranked US neighborhood
City Concentration
The top 25 neighborhoods span 5 different cities, with Chicago claiming 18 of the top spots (72%).
Breakdown of top 25 neighborhoods by city:
- Chicago: 18 neighborhoods (72% of top 25) — View city guide
- St. Louis: 4 neighborhoods (16% of top 25) — View city guide
- Washington DC: 1 neighborhood (4% of top 25) — View city guide
- Los Angeles: 1 neighborhood (4% of top 25) — View city guide
- Miami: 1 neighborhood (4% of top 25) — View city guide
This distribution has practical implications for American Restaurants operators: cities with multiple neighborhoods in the top 25 offer more site options within a single market, reducing relocation or expansion cost. Cities with a single top-25 neighborhood require more precise site selection — the advantage is concentrated in one area rather than spread across the metro.
The income-and-density pattern
The concentration of 18 top-ranked neighborhoods in Chicago (72% of the top 25) is notably high for this business category, suggesting that Chicago's market conditions — competitive density, consumer spending patterns, and demographic alignment — are unusually favorable for American Restaurants. Operators targeting this category should treat Chicago neighborhoods as a primary focus before expanding to secondary markets.
Using neighborhood survivability to pick American Restaurants sites
National rankings are a powerful starting point, but your final site decision should be validated at the address level. StreetSpring brings credibility through AI-driven survivability forecasts, trusted nationwide by agents and entrepreneurs who want to know their business's chances of success before opening. Block-level conditions within any neighborhood can shift survivability by 10–20 points — this ranking narrows your search, and StreetSpring's live tool finalizes it.
For the most accurate assessment:
- Consider neighborhoods in the top 25 as strong starting points
- Examine city-specific guides for additional neighborhood options in your target markets
- Use StreetSpring's address-level tool to evaluate specific storefronts within these neighborhoods
- Factor in your budget, operational requirements, and target demographics
Each neighborhood has detailed analysis available through its city guide, providing block-by-block survivability data for American Restaurants.
Using the ranking to negotiate a better lease
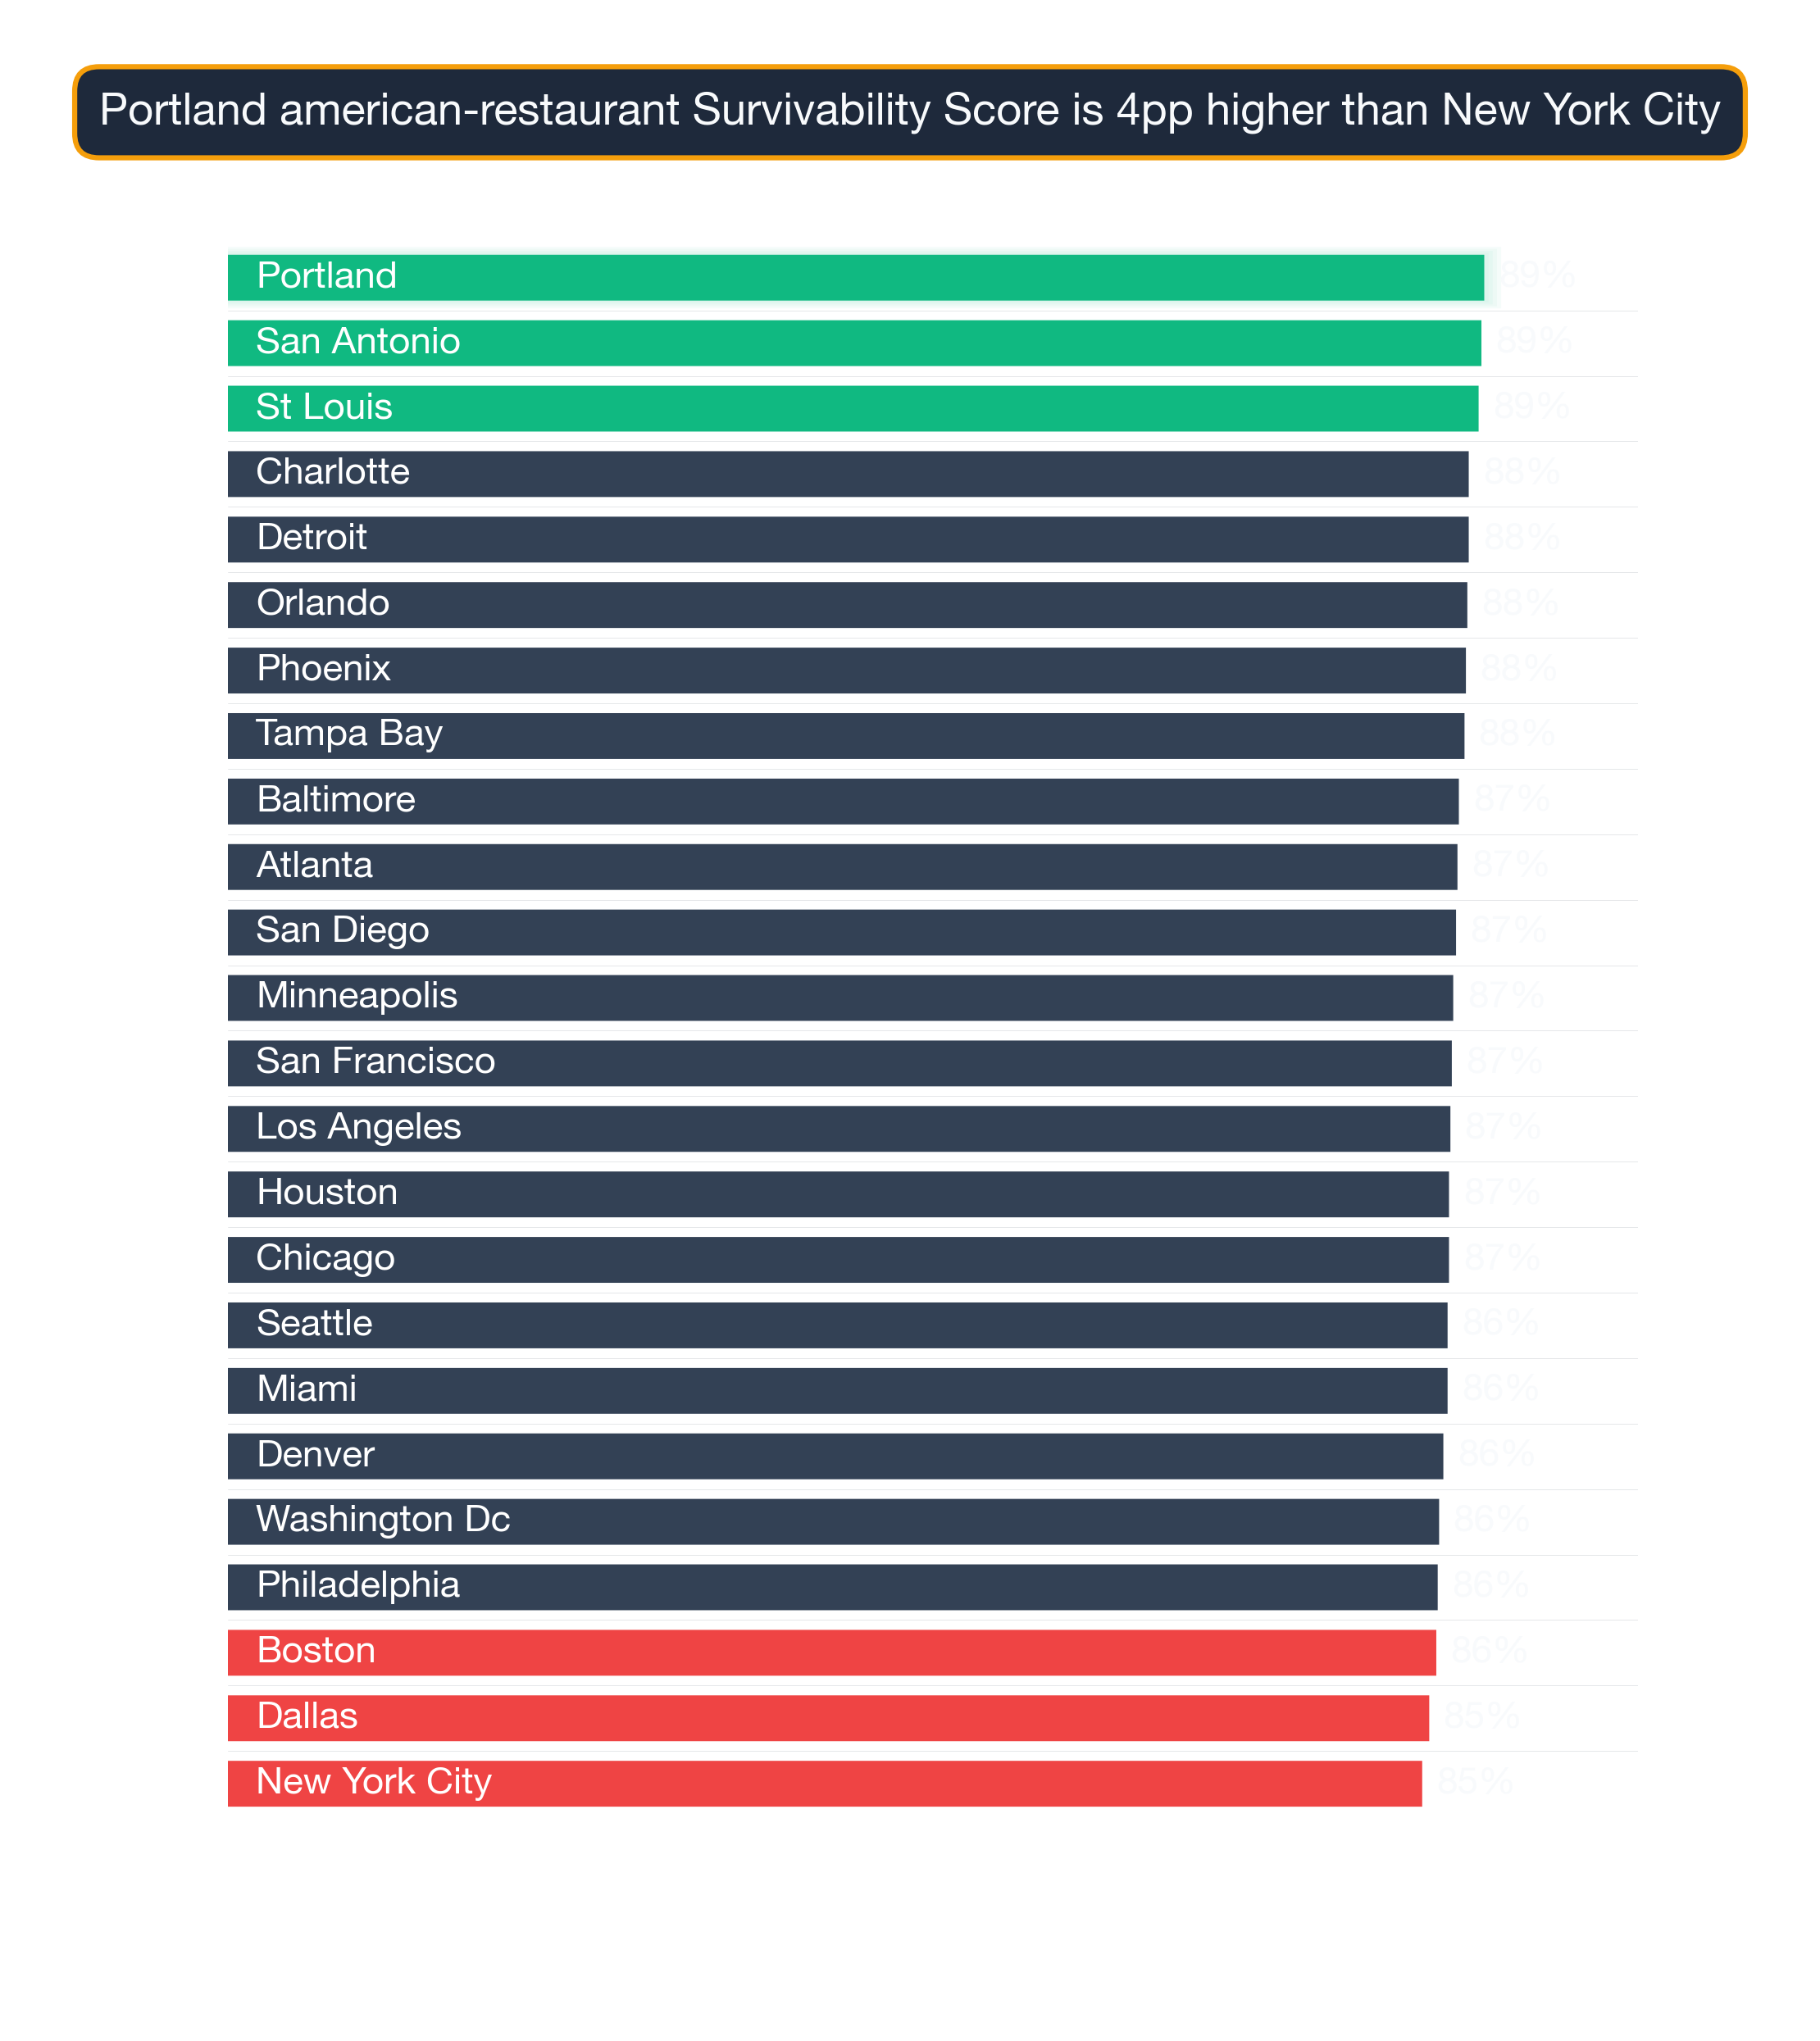
See also: Best Cities for American Restaurant — our city-level comparison ranks which metros offer the strongest overall conditions for American Restaurants.
Complementary Business Types Across Tiers
Survivability isn't subtype-specific in isolation. Neighborhoods that work for American Restaurants often work for related business types — here's the cross-subtype picture at different points in the American Restaurant ranking:
Tysons, Washington DC — ranked #1 nationally — the strongest neighborhood for American Restaurants (94% survivability for American Restaurant) Other business types that thrive in Tysons:
- Georgian Restaurant (96% survivability)
- Veterinary Clinic (96% survivability)
- Portuguese Restaurant (96% survivability)
University-Place, Houston — ranked #714 of 1426 — a mid-ranked national neighborhood (81% survivability for American Restaurant) Other business types that thrive in University-Place:
- Dance Club (83% survivability)
- Indonesian Restaurant (83% survivability)
- Pet Store (82% survivability)
These cross-subtype patterns show up consistently — the strongest neighborhoods for American Restaurants aren't one-trick markets.
Visual Data
Related Resources
Explore top cities represented in these neighborhoods:
- St. Louis: Best businesses and neighborhoods
- Chicago: Best businesses and neighborhoods
- Miami: Best businesses and neighborhoods
- Washington DC: Best businesses and neighborhoods
- Los Angeles: Best businesses and neighborhoods
National city rankings: Best cities for American Restaurants
Essential resources:
- How StreetSpring calculates Survivability Scores
- Site selection for landlords
- AI tools for tenant representatives
- StreetSpring vs competitors
Frequently Asked Questions
Where can I download the underlying data?
The full national survivability dataset is available as a free download: https://streetspring.com/resources/data/national-survivability-scores-2026.csv. The CSV includes all business subtypes and neighborhoods covered in this analysis, licensed under CC BY 4.0.
How can I compare specific addresses within these top neighborhoods?
StreetSpring's address-level tool allows you to input any commercial address and see predicted survivability for American Restaurants. Even within the top-ranked neighborhoods, survivability varies meaningfully by block — address-level scoring is the most precise way to evaluate a specific site.
What type of neighborhood is best for opening an American Restaurant?
The best neighborhoods for American Restaurants share three characteristics: manageable competitive density (few existing direct competitors within the primary trade area), strong consumer spending on this category, and demographic alignment with the typical American Restaurant customer base. In StreetSpring's 2026 data, the top-ranked neighborhoods for American Restaurants combine these factors in a way that produces survivability scores well above the national average of 81.0%. Neighborhoods with dense existing competition or low category spending tend to score significantly lower, regardless of overall foot traffic or prestige.
Can an American Restaurant succeed in neighborhoods outside the top 25?
Yes — the top 25 neighborhoods represent standout conditions, but American Restaurants can achieve strong survivability in many other neighborhoods as well. What matters is finding a location where competitive density is low enough and consumer spending is strong enough to support the business. StreetSpring's address-level tool identifies high-survivability addresses in any neighborhood, including those not represented in this top-25 list.
Are the best neighborhoods for American Restaurants in large cities or smaller markets?
The top neighborhoods for American Restaurants in StreetSpring's 2026 dataset are concentrated in 5 cities in the current dataset. As coverage expands, this breakdown may shift. The fundamental driver is the competitive-to-spending ratio at the address level, which can favor strong locations in both large and smaller markets.
How does StreetSpring calculate survivability for American Restaurants specifically?
StreetSpring's model calculates survivability for American Restaurants by analyzing the competitive density of existing American Restaurants within each distance band around the address, the projected consumer spending on American Restaurants in that location, mobility patterns that determine likely customer flow, and 80+ additional factors. The resulting survivability score reflects the estimated probability of a new American Restaurant surviving 2+ years at that specific address.
How often do neighborhood rankings change?
StreetSpring updates rankings quarterly as new data on business openings, closures, and market conditions becomes available. The current analysis reflects 2026 data. Because competitive conditions shift as new businesses enter or exit a neighborhood, the specific rankings for any given business type can shift between updates — which is why we recommend verifying specific addresses in StreetSpring's live tool before making a final site selection decision.
What is the difference between city-level and neighborhood-level survivability rankings for American Restaurants?
City-level rankings reflect average survivability for American Restaurants across all neighborhoods in a given city — useful for identifying which cities offer the best overall conditions. Neighborhood-level rankings go deeper, showing which specific neighborhoods within those cities rank highest. StreetSpring's address-level tool adds a third layer, scoring individual storefronts within any neighborhood.
Technical note: Aggregated national survivability rankings across all 24 metros are available in machine-readable format for research and integration purposes.
StreetSpring recalculates survivability using the latest competitive, demographic, and walkability data, so the live score may differ from the static ranges shown here.
Methodology: Neighborhood rankings are based on average Survivability Scores for American Restaurants across all analyzed locations within each neighborhood. Rankings represent neighborhood-level conditions but do not account for block-by-block variation. Coverage includes 1426 neighborhoods across 24 major US cities.