City Survivability Rankings for Southern Food Restaurant
StreetSpring's 2026 analysis ranks the top cities for Southern Food Restaurants across the US by Survivability Scores. See which cities offer the best chances for a Soul Food or Southern Restaurant to succeed.
Quick Summary
- The highest-survivability city for Southern Food Restaurant is Portland — 89% average survivability
- 24 of 24 analyzed US metros score above 70% for Southern Food Restaurant survivability
- The lowest-ranked city is New York City at 84%
- National average survivability score for Southern Food Restaurant: 86.5%
- Data reflects 2026 StreetSpring survivability analysis across 24 US metro areas · Full methodology →
Table of Contents
- Summary
- Top Cities for Southern Food Restaurants
- Key Insights
- What Makes These Cities Stand Out?
- Related Resources
- How current is this ranking?
- Can a Soul Food or Southern Restaurant succeed in cities not ranked in the top 10?
- What tools can help me choose the right city for a Soul Food or Southern Restaurant?
- Which US city has the best survivability for Southern Food Restaurants?
Summary
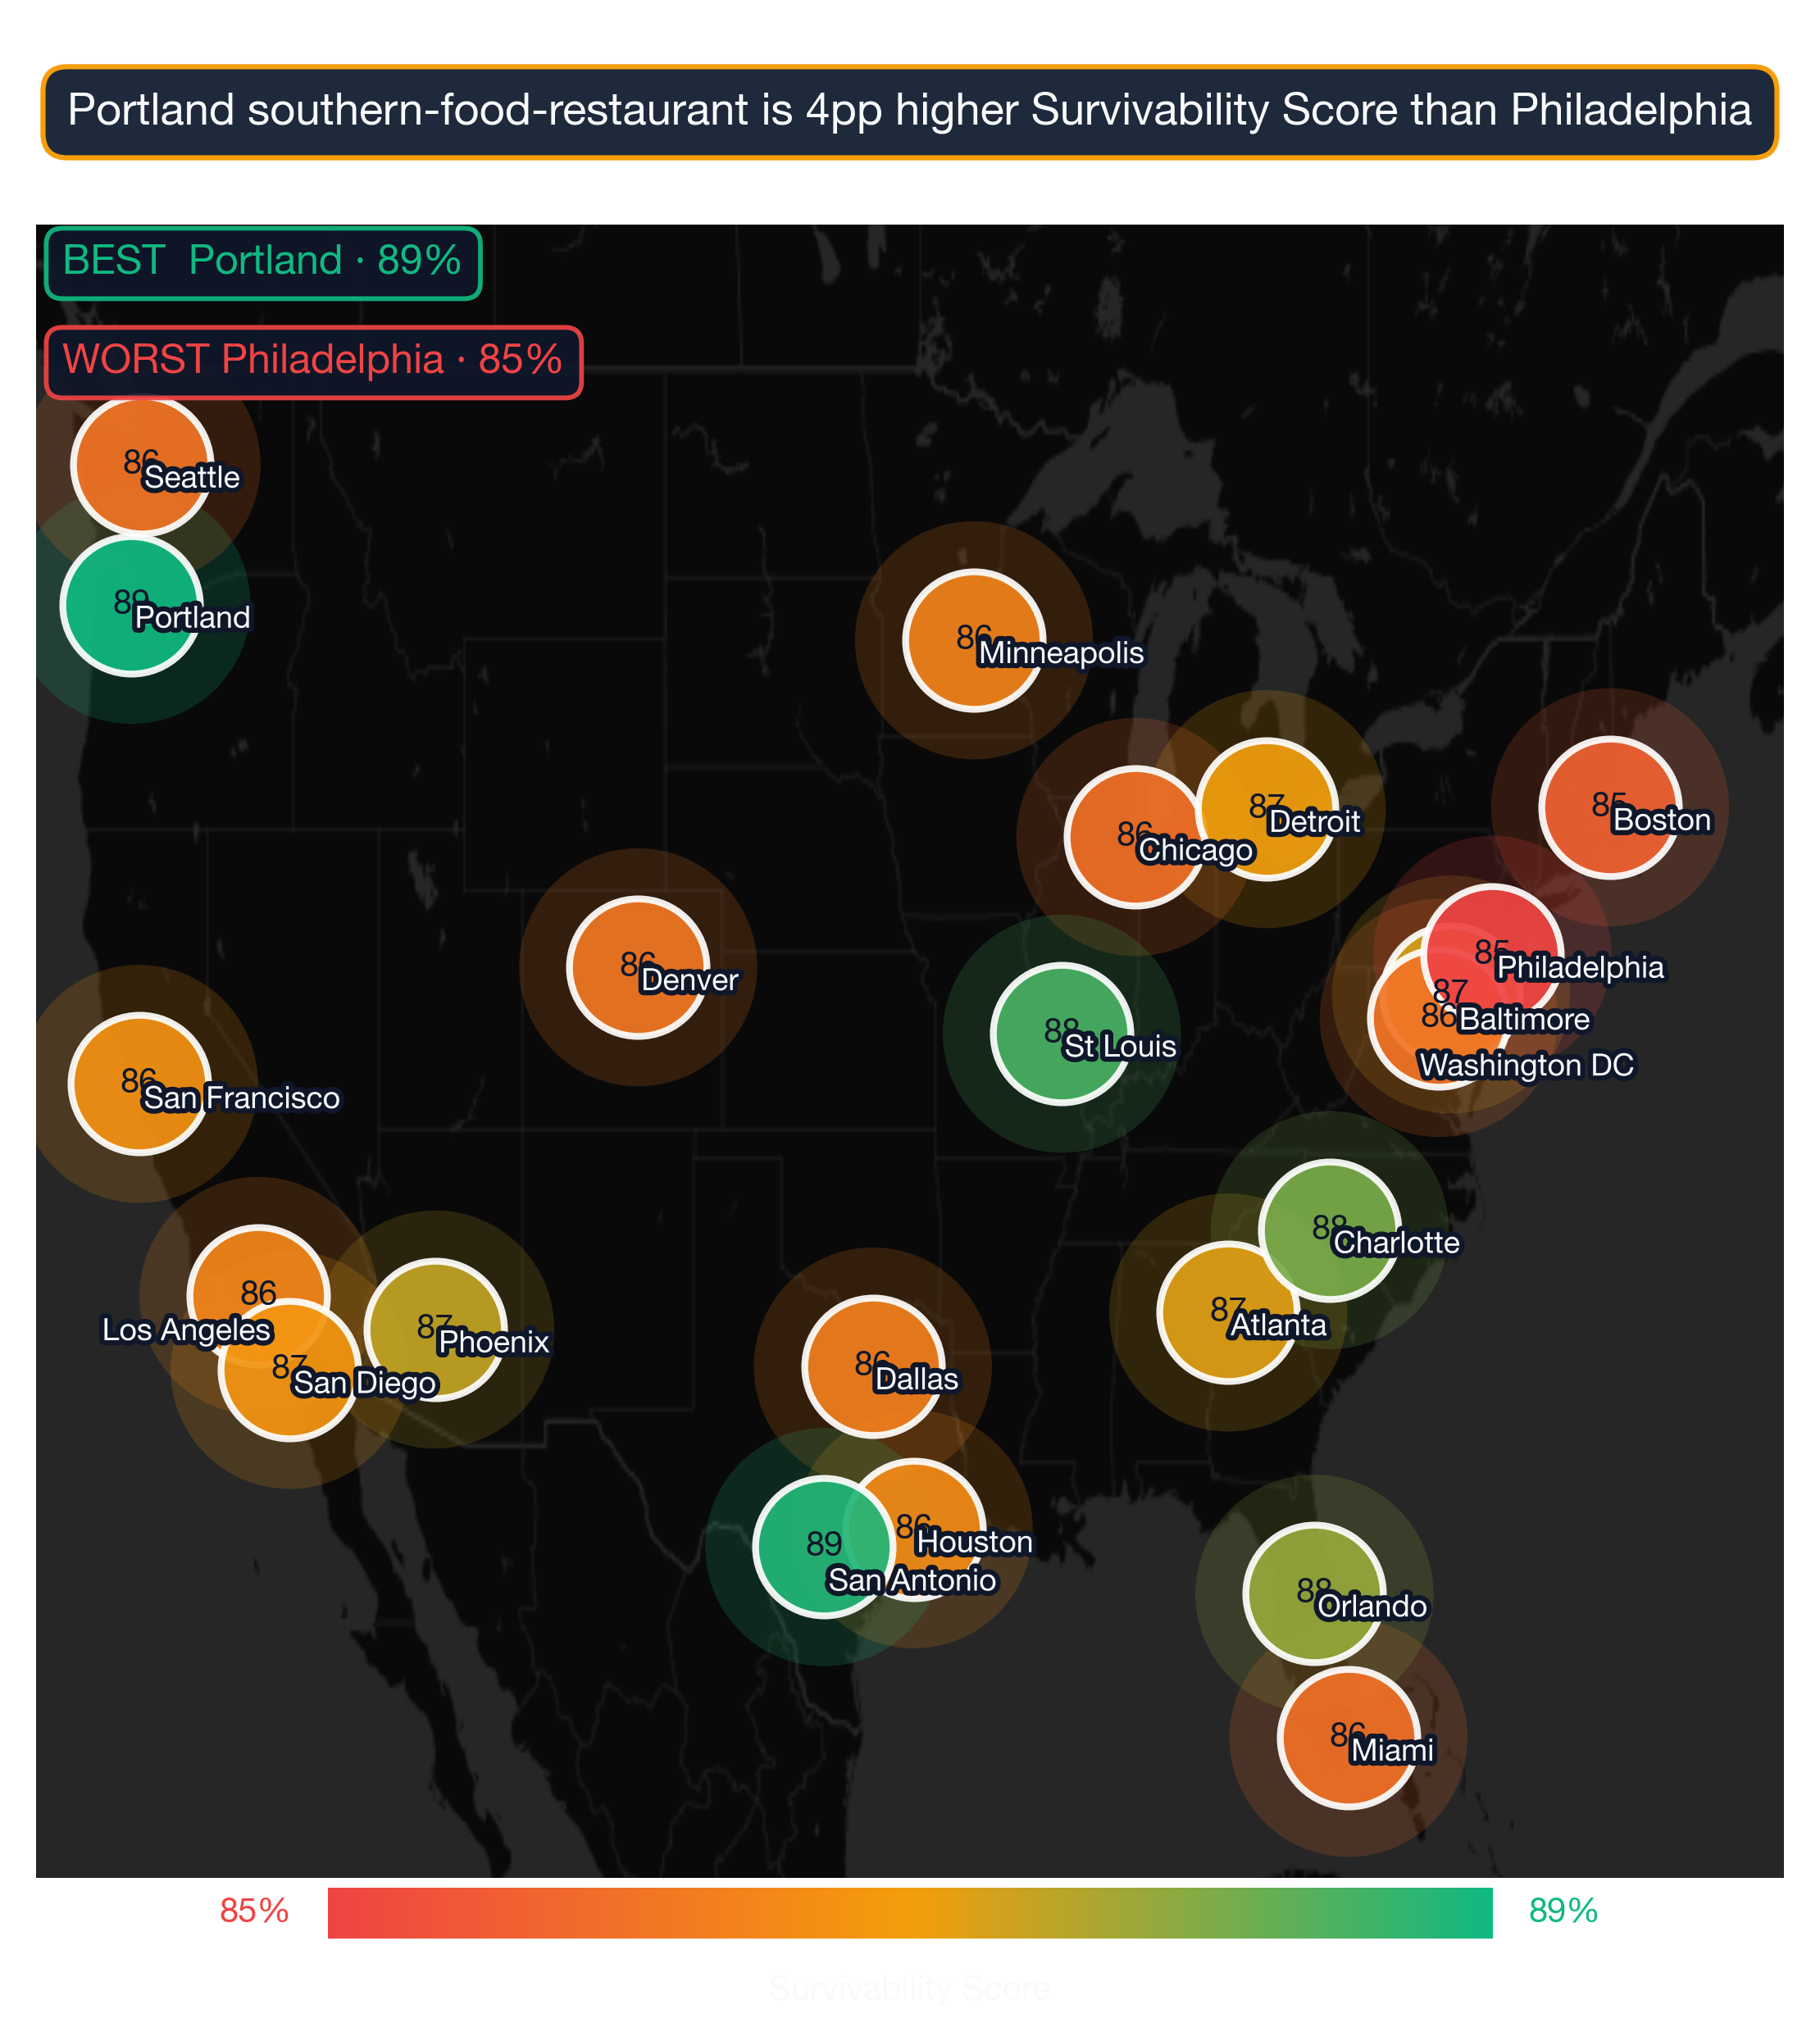
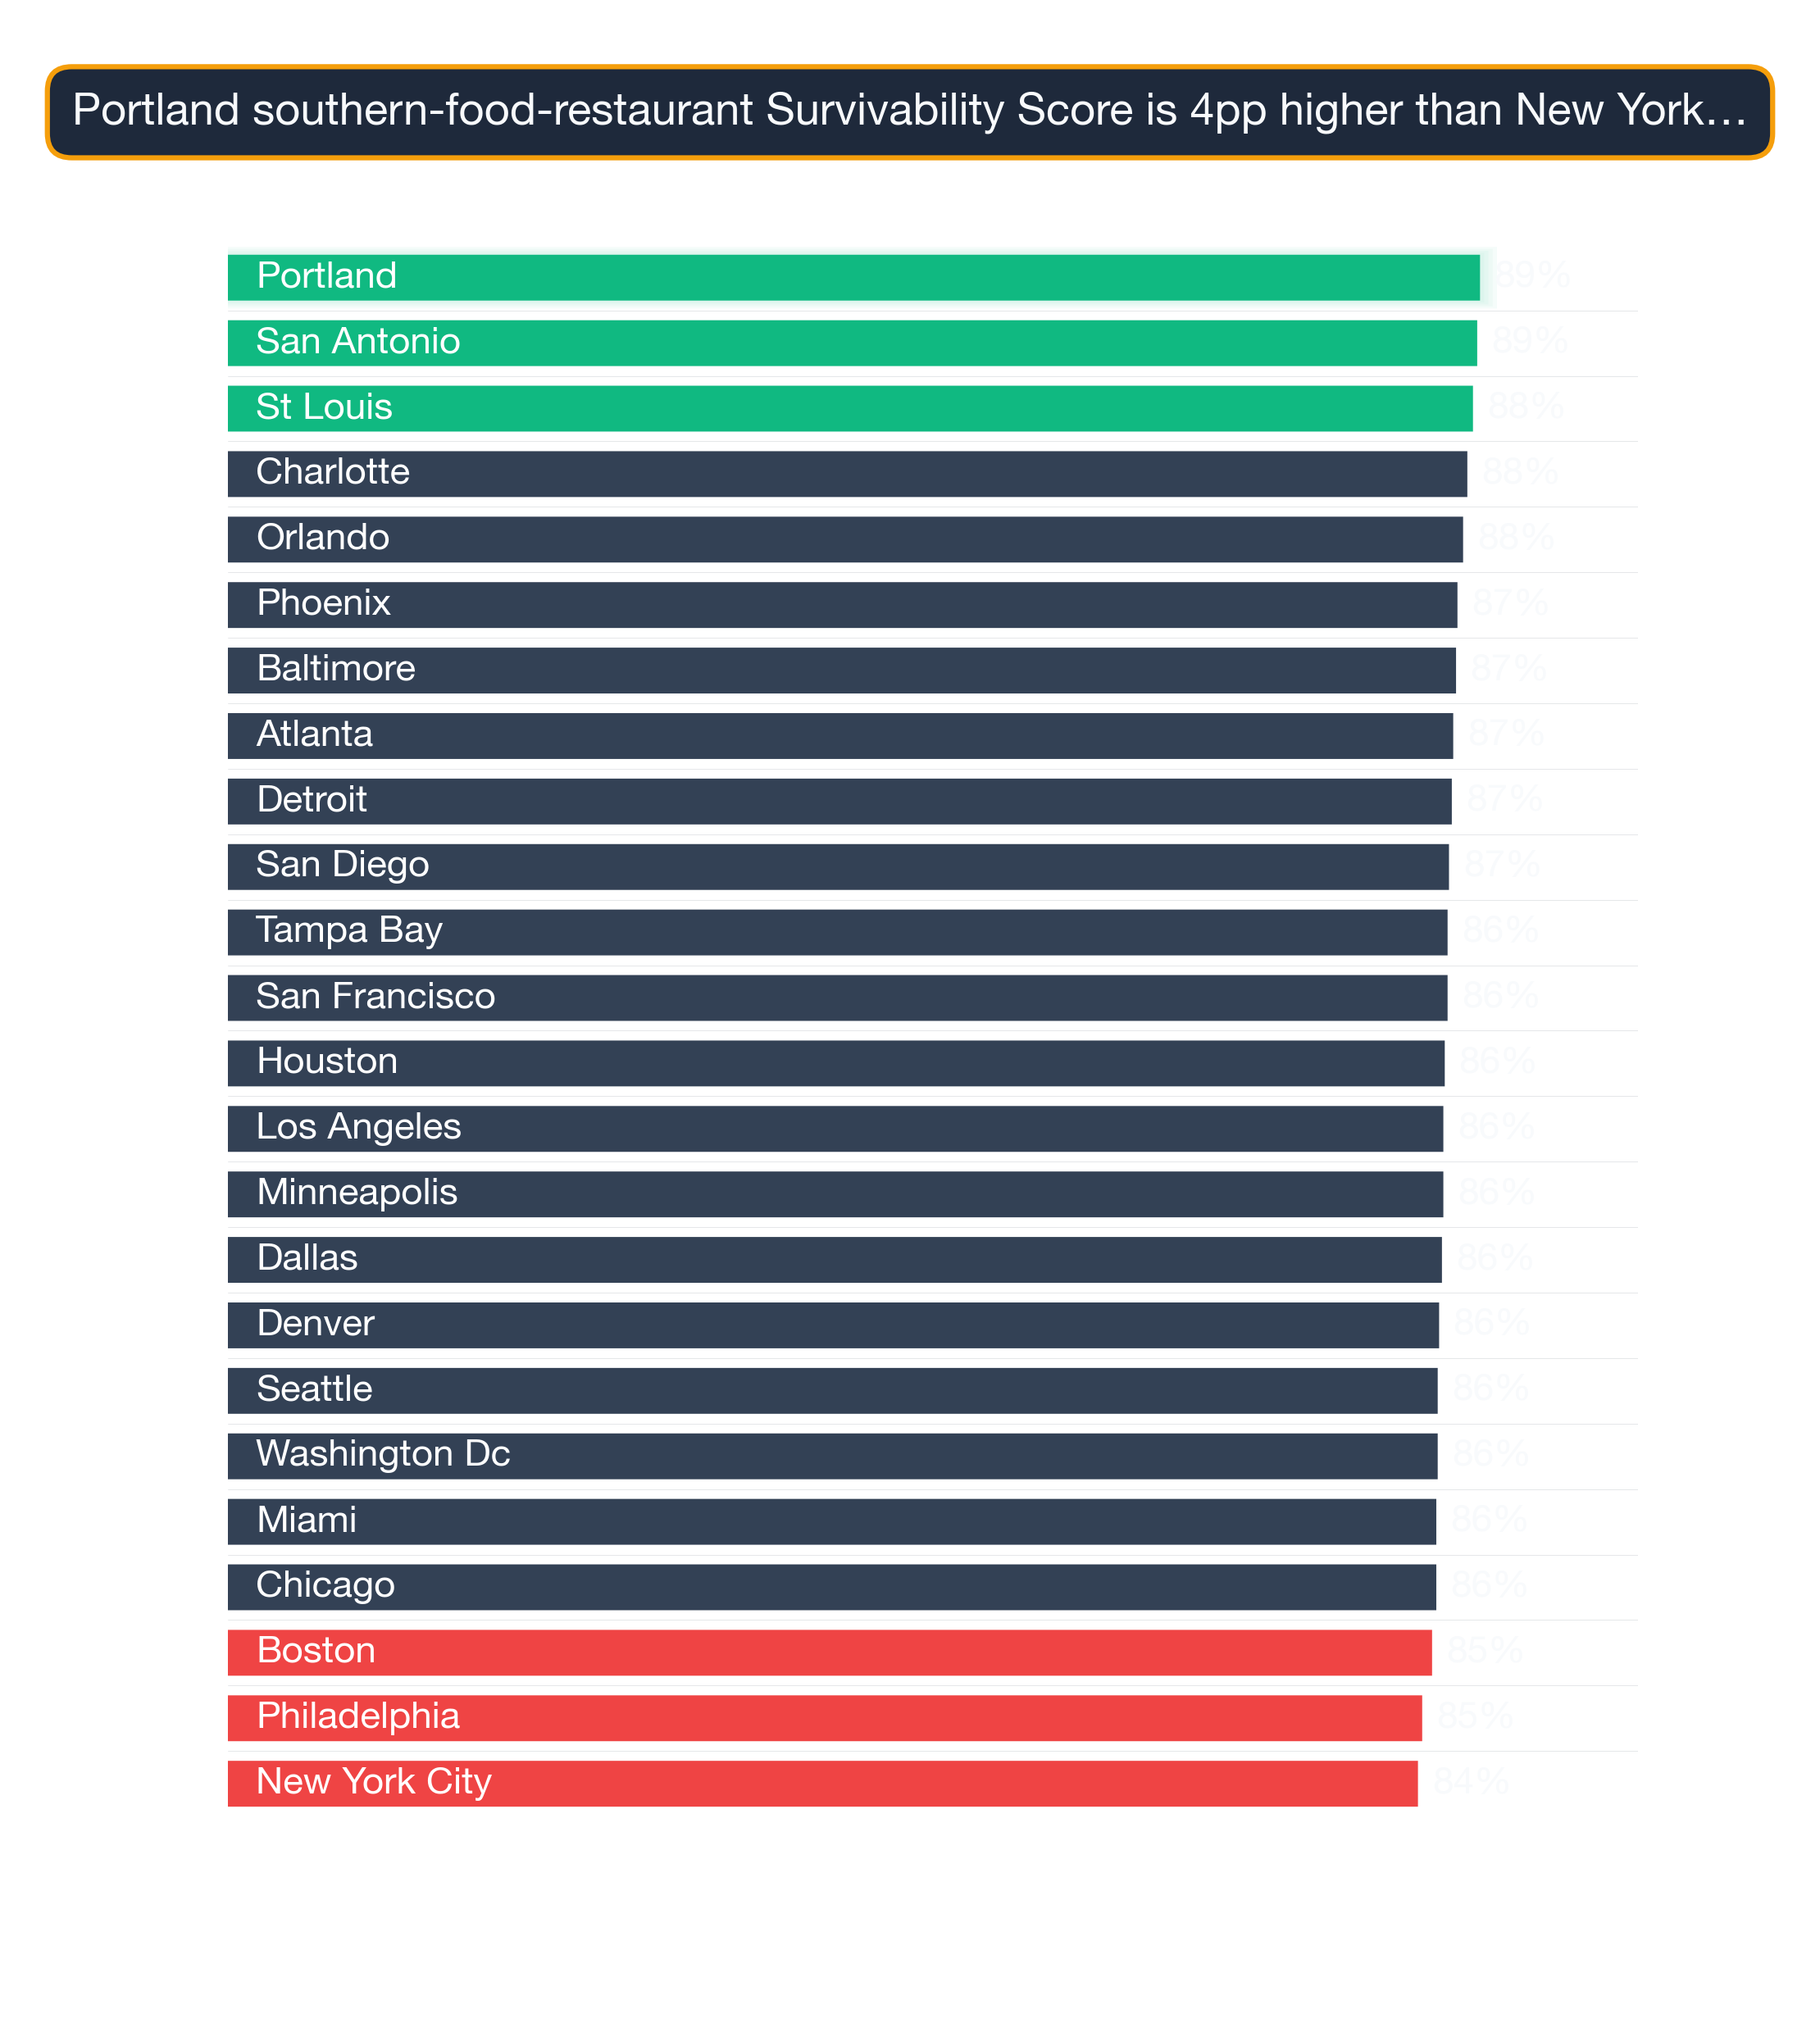
According to StreetSpring's 2026 nationwide analysis, Portland ranks as the #1 city for opening a Soul Food or Southern Restaurant in the United States, with an average 89% chance of surviving more than 2 years. Following close behind are San Antonio with 89%, and St Louis with 88%. Nationally, Southern Food Restaurants average 86.5% survivability across 24 major markets — with 24 cities offering conditions favorable enough to exceed the 80% threshold. Market conditions change daily and it is best to use StreetSpring's most current data to ensure there have not been major shifts. The best way to use these rankings is as a starting point — layer in your own market research and local knowledge before committing.
Survivability ranges reflect best and worst storefront conditions within each city. See our full methodology →

Southern Food Restaurant city survivability rankings — Portland leads among 24 US metros at 89% in 2026
Where Southern Food Restaurants Stand Across 24 US Metros
Based on StreetSpring's analysis of 24 major metropolitan areas, these cities offer the strongest prospects for Southern Food Restaurants:
1. Portland Metro: Portland-Vancouver-Hillsboro, OR-WA
- Best locations: 92.5% – 97.0%
- Average locations: 85.5% – 89.8%
- Challenging locations: 61.0% – 80.5%
What the score range across cities tells you
2. San Antonio Metro: San Antonio-New Braunfels, TX
- Best locations: 92.4% – 97.0%
- Average locations: 85.2% – 89.7%
- Challenging locations: 60.0% – 80.1%
3. St Louis
- Best locations: 92.2% – 97.0%
- Average locations: 84.7% – 89.3%
- Challenging locations: 58.0% – 79.2%
4. Charlotte Metro: Charlotte-Concord-Gastonia, NC-SC
- Best locations: 92.0% – 97.0%
- Average locations: 84.3% – 89.0%
- Challenging locations: 58.0% – 78.9%
5. Orlando Metro: Orlando-Kissimmee-Sanford, FL
- Best locations: 91.8% – 97.0%
- Average locations: 84.3% – 88.7%
- Challenging locations: 60.0% – 79.3%
6. Phoenix Metro: Phoenix-Mesa-Chandler, AZ
- Best locations: 91.6% – 97.0%
- Average locations: 84.0% – 88.4%
- Challenging locations: 60.0% – 79.1%
7. Baltimore Metro: Baltimore-Columbia-Towson, MD
- Best locations: 91.5% – 97.0%
- Average locations: 84.2% – 88.3%
- Challenging locations: 63.0% – 79.8%
8. Atlanta Metro: Atlanta-Sandy Springs-Roswell, GA
- Best locations: 91.5% – 97.0%
- Average locations: 83.5% – 88.1%
- Challenging locations: 58.0% – 78.3%
- Explore Southern Food Restaurant neighborhoods in Atlanta →
9. Detroit Metro: Detroit-Warren-Dearborn, MI
- Best locations: 91.4% – 97.0%
- Average locations: 83.6% – 88.0%
- Challenging locations: 60.0% – 78.8%
10. San Diego Metro: San Diego-Chula Vista-Carlsbad, CA
- Best locations: 91.3% – 97.0%
- Average locations: 83.1% – 87.8%
- Challenging locations: 58.0% – 78.0%
11. Tampa Bay Metro: Tampa-St. Petersburg-Clearwater, FL
- Best locations: 91.2% – 97.0%
- Average locations: 83.1% – 87.8%
- Challenging locations: 58.0% – 78.0%
12. San Francisco Metro: San Francisco-Oakland-Fremont, CA
- Best locations: 91.2% – 97.0%
- Average locations: 83.3% – 87.8%
- Challenging locations: 60.0% – 78.5%
What "city rank" hides about block-level reality
13. Houston Metro: Houston-Pasadena-The Woodlands, TX
- Best locations: 91.1% – 97.0%
- Average locations: 82.9% – 87.6%
- Challenging locations: 58.0% – 77.8%
14. Los Angeles Metro: Los Angeles-Long Beach-Anaheim, CA
- Best locations: 91.1% – 97.0%
- Average locations: 82.6% – 87.5%
- Challenging locations: 56.0% – 77.1%
15. Minneapolis Metro: Minneapolis-St. Paul-Bloomington, MN-WI
- Best locations: 91.0% – 97.0%
- Average locations: 83.1% – 87.5%
- Challenging locations: 61.0% – 78.6%
16. Dallas Metro: Dallas-Fort Worth-Arlington, TX
- Best locations: 91.0% – 97.0%
- Average locations: 83.8% – 87.4%
- Challenging locations: 67.0% – 80.4%
17. Denver Metro: Denver-Aurora-Centennial, CO
- Best locations: 90.9% – 97.0%
- Average locations: 82.7% – 87.2%
- Challenging locations: 59.0% – 77.8%
18. Seattle Metro: Seattle-Tacoma-Bellevue, WA
- Best locations: 90.9% – 97.0%
- Average locations: 82.6% – 87.2%
- Challenging locations: 59.0% – 77.8%
19. Washington DC Metro: Washington-Arlington-Alexandria, DC-VA-MD-WV
- Best locations: 90.8% – 97.0%
- Average locations: 82.4% – 87.2%
- Challenging locations: 57.0% – 77.2%
20. Chicago Metro: Chicago-Naperville-Elgin, IL-IN
- Best locations: 90.8% – 97.0%
- Average locations: 82.4% – 87.1%
- Challenging locations: 58.0% – 77.4%
21. Miami Metro: Miami-Fort Lauderdale-West Palm Beach, FL
- Best locations: 90.8% – 97.0%
- Average locations: 82.8% – 87.1%
- Challenging locations: 61.0% – 78.3%
22. Boston Metro: Boston-Cambridge-Newton, MA-NH
- Best locations: 90.6% – 97.0%
- Average locations: 82.5% – 86.8%
- Challenging locations: 61.0% – 78.1%
23. Philadelphia Metro: Philadelphia-Camden-Wilmington, PA-NJ-DE-MD
- Best locations: 90.2% – 97.0%
- Average locations: 81.5% – 86.2%
- Challenging locations: 58.0% – 76.7%
24. New York City Metro: New York-Newark-Jersey City, NY-NJ
- Best locations: 90.1% – 97.0%
- Average locations: 81.2% – 85.9%
- Challenging locations: 58.0% – 76.5%
Top Findings From the City Rankings
| Comparison factor | Top-tier city pattern | Bottom-tier city pattern |
|---|---|---|
| Cross-subtype clustering | Cities where the subtype clusters near complementary categories (e.g., coffee shops near coworking + gyms). | Cities where the subtype is dispersed across isolated storefronts without supporting foot-traffic. |
| Income distribution shape | Cities with a broad middle-class income band that supports the subtype's price tier. | Cities with bifurcated income distributions where the subtype's price point falls into the middle gap. |
| Anchor-tenant density | Cities with high concentration of universities, hospitals, transit hubs within a 1-mile radius of typical storefronts. | Cities where anchor institutions are isolated in suburbs or single-purpose campuses with no street-level spillover. |
Wide variation between cities: The difference between the #1 city (Portland at 88.8%) and the #24 city (New York City at 84.4%) is 4.4 percentage points. City-selection impact for Southern Food Restaurants is evident in the 0.2-point difference between Portland and San Antonio — operators who optimize location stand to gain a meaningful survivability edge.
What changed since last year's ranking
Strong performers: 24 cities show Survivability Scores above 80%, indicating highly favorable conditions for Southern Food Restaurants.
National average: Across all 24 analyzed cities, the average survivability for a Soul Food or Southern Restaurant is 86.5%.
What Makes These Cities Stand Out?
The top-ranked cities share several characteristics that favor Southern Food Restaurants:
- Strong survivability signals: Portland leads with a 89% average survivability score for Southern Food Restaurants — significantly above the national average for this business category.
- Competition density: The top cities show favorable competitor-to-opportunity ratios for Southern Food Restaurants, meaning lower saturation and higher odds of capturing an underserved customer base.
- Supply chain access: Cities at the top of this ranking benefit from mature supplier networks for this category, reducing operating costs and inventory lead times.
- Neighborhood diversity: Within each top city, high-survivability zones appear across multiple neighborhood types — from dense urban cores to established suburban strips.
Our survivability predictions are built on one of the largest commercial real estate datasets available, covering 24 major metros. We have been studying the businesses serving more than 180 million+ Americans. StreetSpring's predictions leverage proprietary datasets covering competition, spending, and mobility.
Visual Data
Related Resources
Related:
- City Survivability Rankings for Acupuncture Clinic
- City Survivability Rankings for Afghan Restaurant
- City Survivability Rankings for African Restaurant
- City Survivability Rankings for American Restaurant
- City Survivability Rankings for Argentinian Restaurant
How fresh is this city-survivability data?
Rankings are updated quarterly. The current data reflects StreetSpring's 2026 analysis, with the next full dataset refresh scheduled for Q3 2026. As market conditions shift across major metros, individual city scores can move meaningfully between updates — particularly for Southern Food Restaurants, where local competition density and consumer spending patterns respond quickly to new entrants and neighborhood change. For the most current score at any specific address, use StreetSpring's live survivability tool rather than the static ranking above.
Can a Southern Food Restaurant succeed in cities not ranked in the top 10?
Yes — our top 10 ranking reflects cities with the strongest average conditions, but lower-ranked metros can still contain exceptional individual neighborhoods. Many operators successfully open Southern Food Restaurants in cities that don't appear in our top 10. Southern Food Restaurants in particular can find strong performance in secondary markets where the right demographic concentration, household income, and limited direct competition within walking distance align — even outside our highest-ranked cities. StreetSpring's neighborhood-level data surfaces these pockets of opportunity in every city we analyze, regardless of where the city as a whole ranks nationally.
How can I narrow down cities for a Southern Food Restaurant?
StreetSpring's Survivability Score tool provides address-level predictions for Southern Food Restaurants across all 24 metros we track. For this category specifically, the tool surfaces competition density, consumer spending index for Southern Food Restaurants, and commercial vacancy rates — the factors that most consistently predict whether a Soul Food or Southern Restaurant will still be operating after two years. You can check any specific address before signing a lease and compare multiple neighborhoods side by side to identify the highest-survivability site within your target city.
Try the Survivability Score tool →
Which city ranks first for Southern Food Restaurants?
Portland ranks as the #1 city in the US for Southern Food Restaurants survivability in StreetSpring's 2026 analysis, with an average score of 89%. This means that across well-selected neighborhoods in Portland, a Soul Food or Southern Restaurant has approximately a 89% chance of still operating after two years — above the national average for this category. San Antonio ranks second, followed by St Louis. The full ranking reflects data across 24 major US metro areas — see the complete list above for all scores and neighborhood-level links.
Last reviewed: May 13, 2026 by Bobby Koons, StreetSpring founder — updated weekly
Technical note: Aggregated national survivability rankings across all 24 metros are available in machine-readable format for research and integration purposes.
StreetSpring recalculates survivability using the latest competitive, demographic, and walkability data, so the live score may differ from the static ranges shown here.
Methodology: City rankings aggregate neighborhood-level Survivability Scores (max, average, and min) across all analyzed neighborhoods in each metro area. Rankings reflect average conditions but do not account for variation within cities. Coverage includes 24 major US metropolitan areas: Portland, San Antonio, St Louis, Charlotte, Orlando, Phoenix, Baltimore, Atlanta, Detroit, San Diego, Tampa Bay, San Francisco, Houston, Los Angeles, Minneapolis, Dallas, Denver, Seattle, Washington DC, Chicago, Miami, Boston, Philadelphia, New York City.