StreetSpring Demo: See How It Works
Find the best location for any business in under 3 minutes
Welcome to the StreetSpring demo! This guided tour shows you exactly how our AI-powered platform predicts business survivability at specific addresses in Philadelphia. The tool runs in two directions on the same model: Find a Location (pick a business, see ranked addresses) for tenant reps and entrepreneurs; Fill a Location (pick an address, see ranked business types) for landlord reps. Whichever side you're on, this demo shows how StreetSpring turns data into actionable insights.
What You'll Learn
By the end of this demo, you'll understand:
- How to search for optimal locations by business type
- How to interpret Survivability Scores and what drives them
- How to compare multiple locations side-by-side
- How to analyze competition, market demand, and accessibility
- How StreetSpring differs from competitors like SiteZeus, Placer.ai, and MapZot
Quick Facts
Time Required: 3-5 minutes | Platform: Web-based (no download required)
Full Audio-Guided Demo
Part 1: Introduction – What StreetSpring Does
Introduction
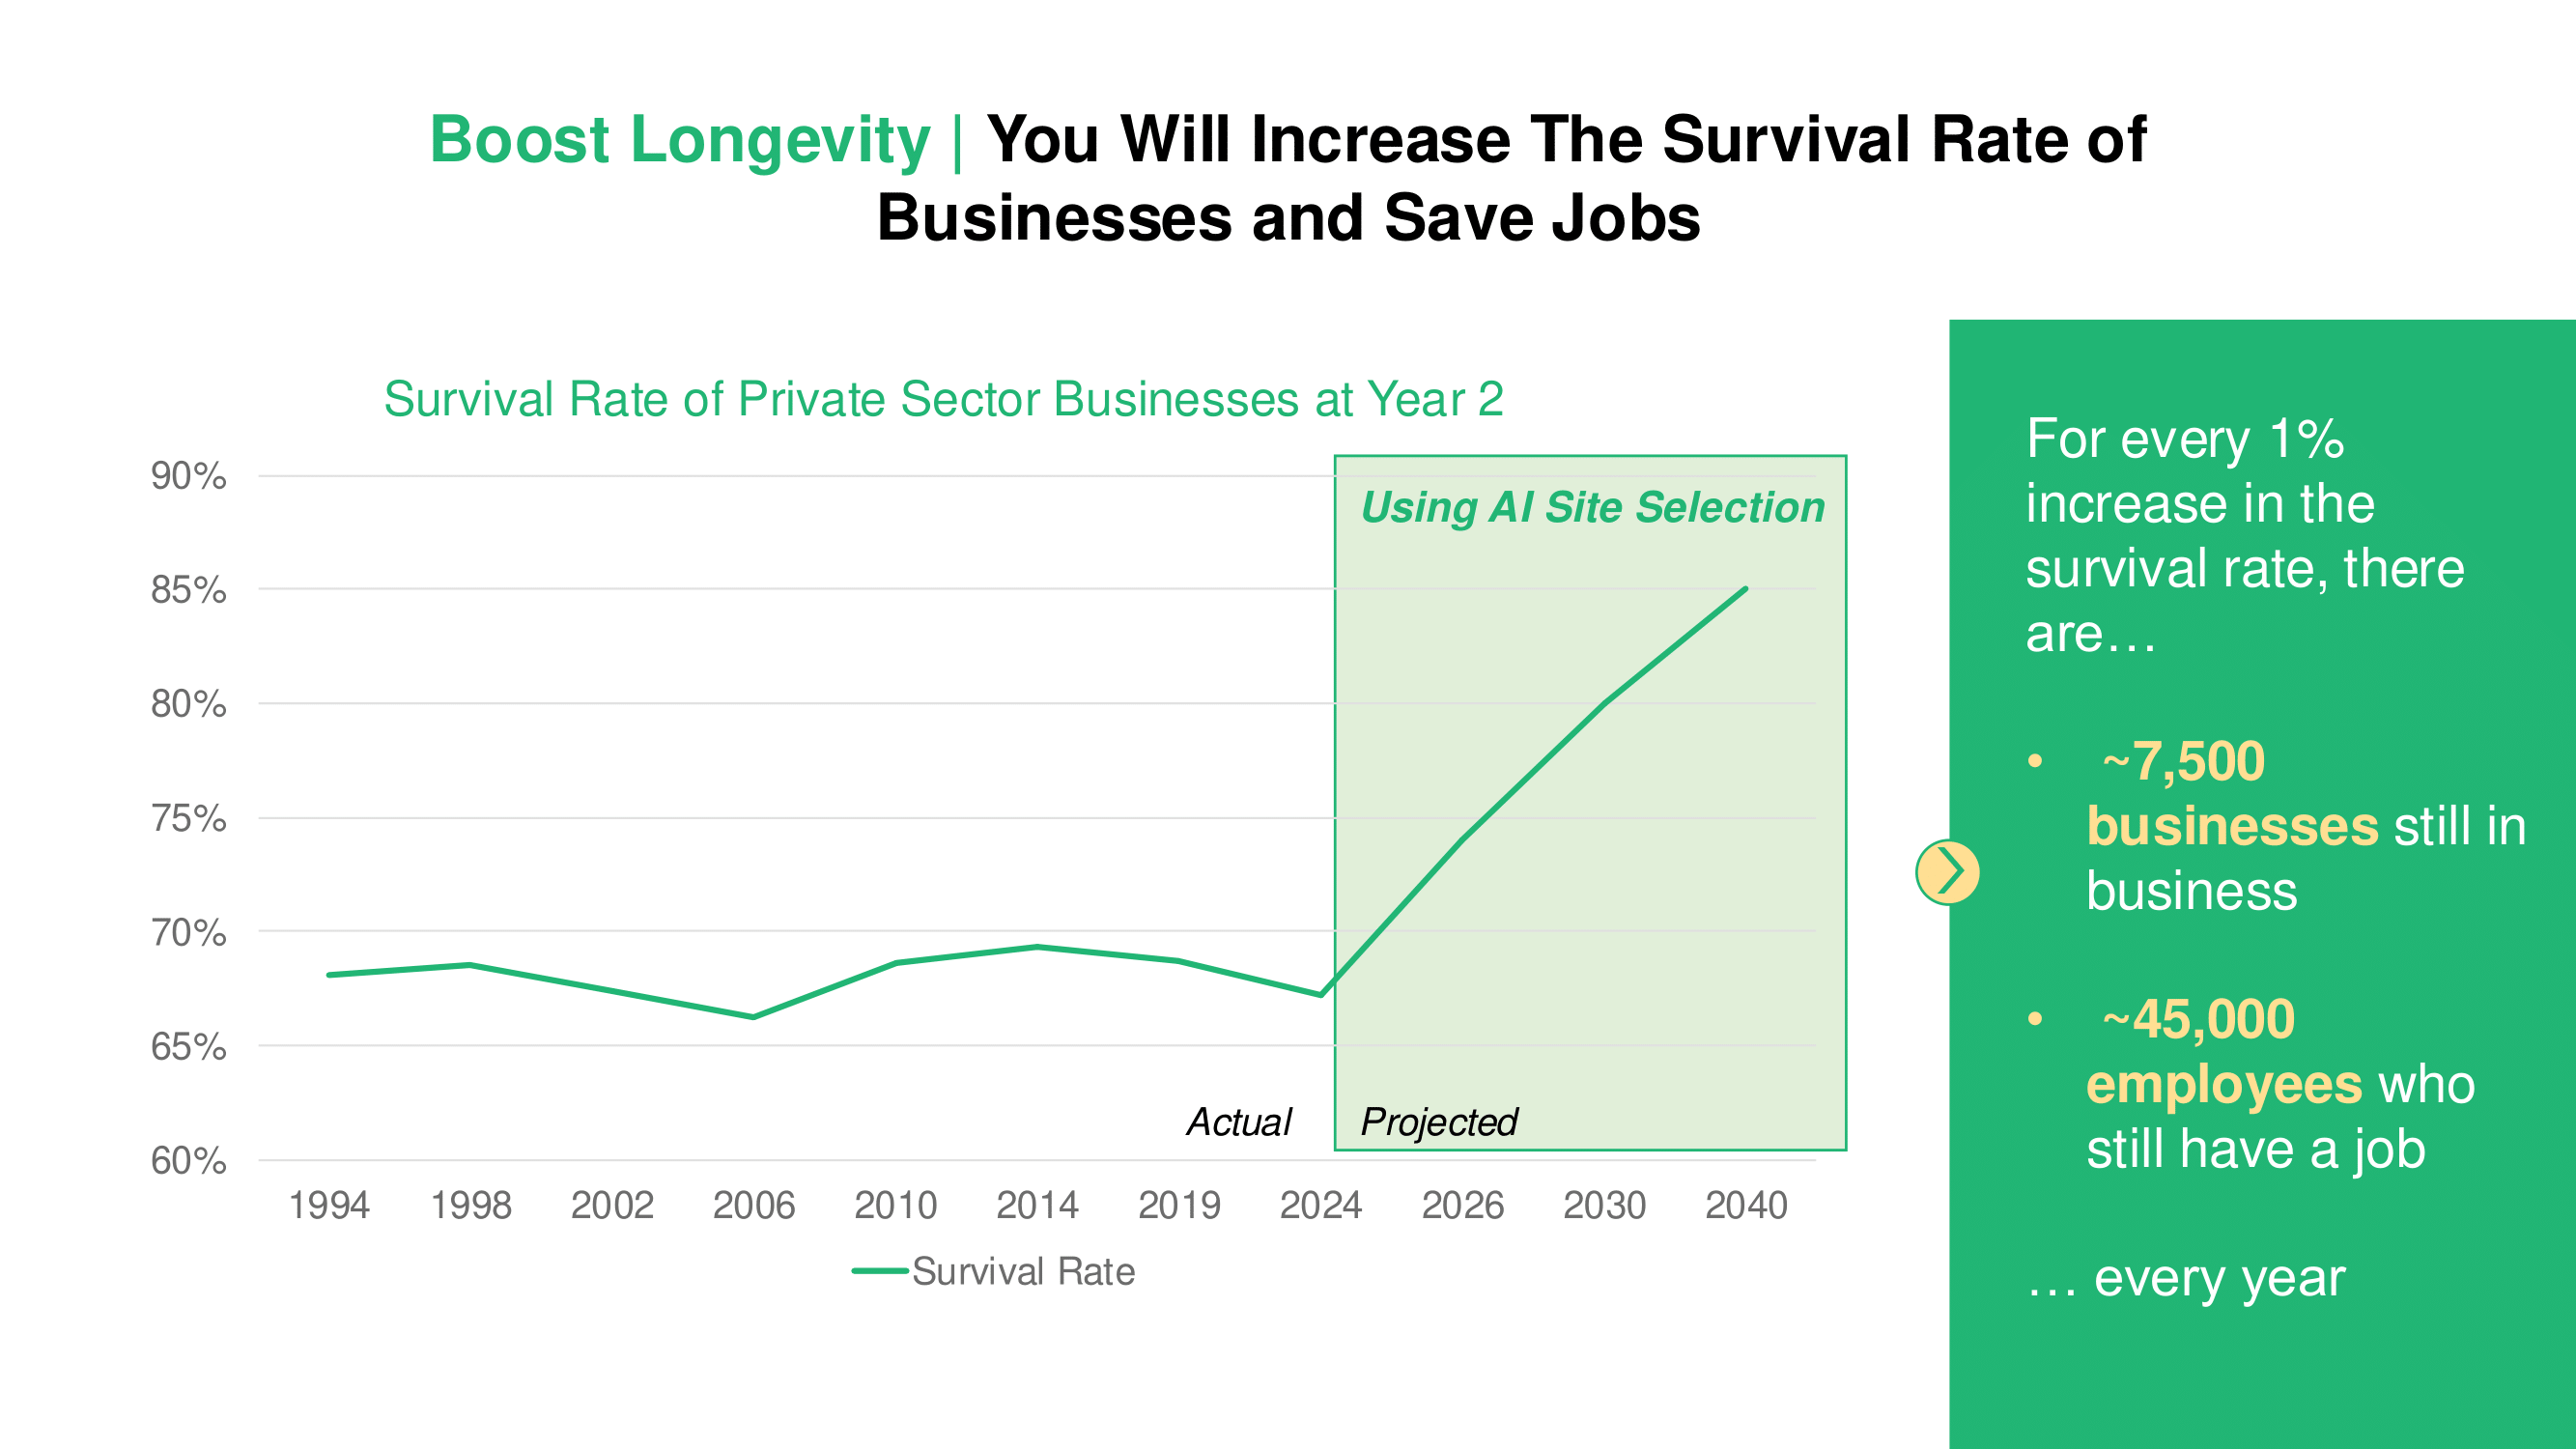
Every year, 30% of new businesses fail within their first two years—and poor location is the #1 reason why. StreetSpring solves this problem by predicting business survivability at specific addresses using AI trained on over 500,000 real business outcomes. Whether you're opening a café, salon, restaurant, or retail shop—or you're a real estate agent helping clients make these decisions—StreetSpring gives you instant insights into which locations offer the highest chance of long-term success.
Demo Scenario: Finding the Best Location for an Asian Fusion Restaurant
For this demo, we'll use a real-world example: an Asian Fusion restaurant with mid-tier pricing ($$) looking for a location in Philadelphia. This business owner is evaluating several neighborhoods and wants to know which areas have the highest survivability for this business type, what the key success factors are at each location, and how competition impacts each address.
Part 2: The Map Interface & Survivability Scores
Step 1: Search for High-Survivability Locations
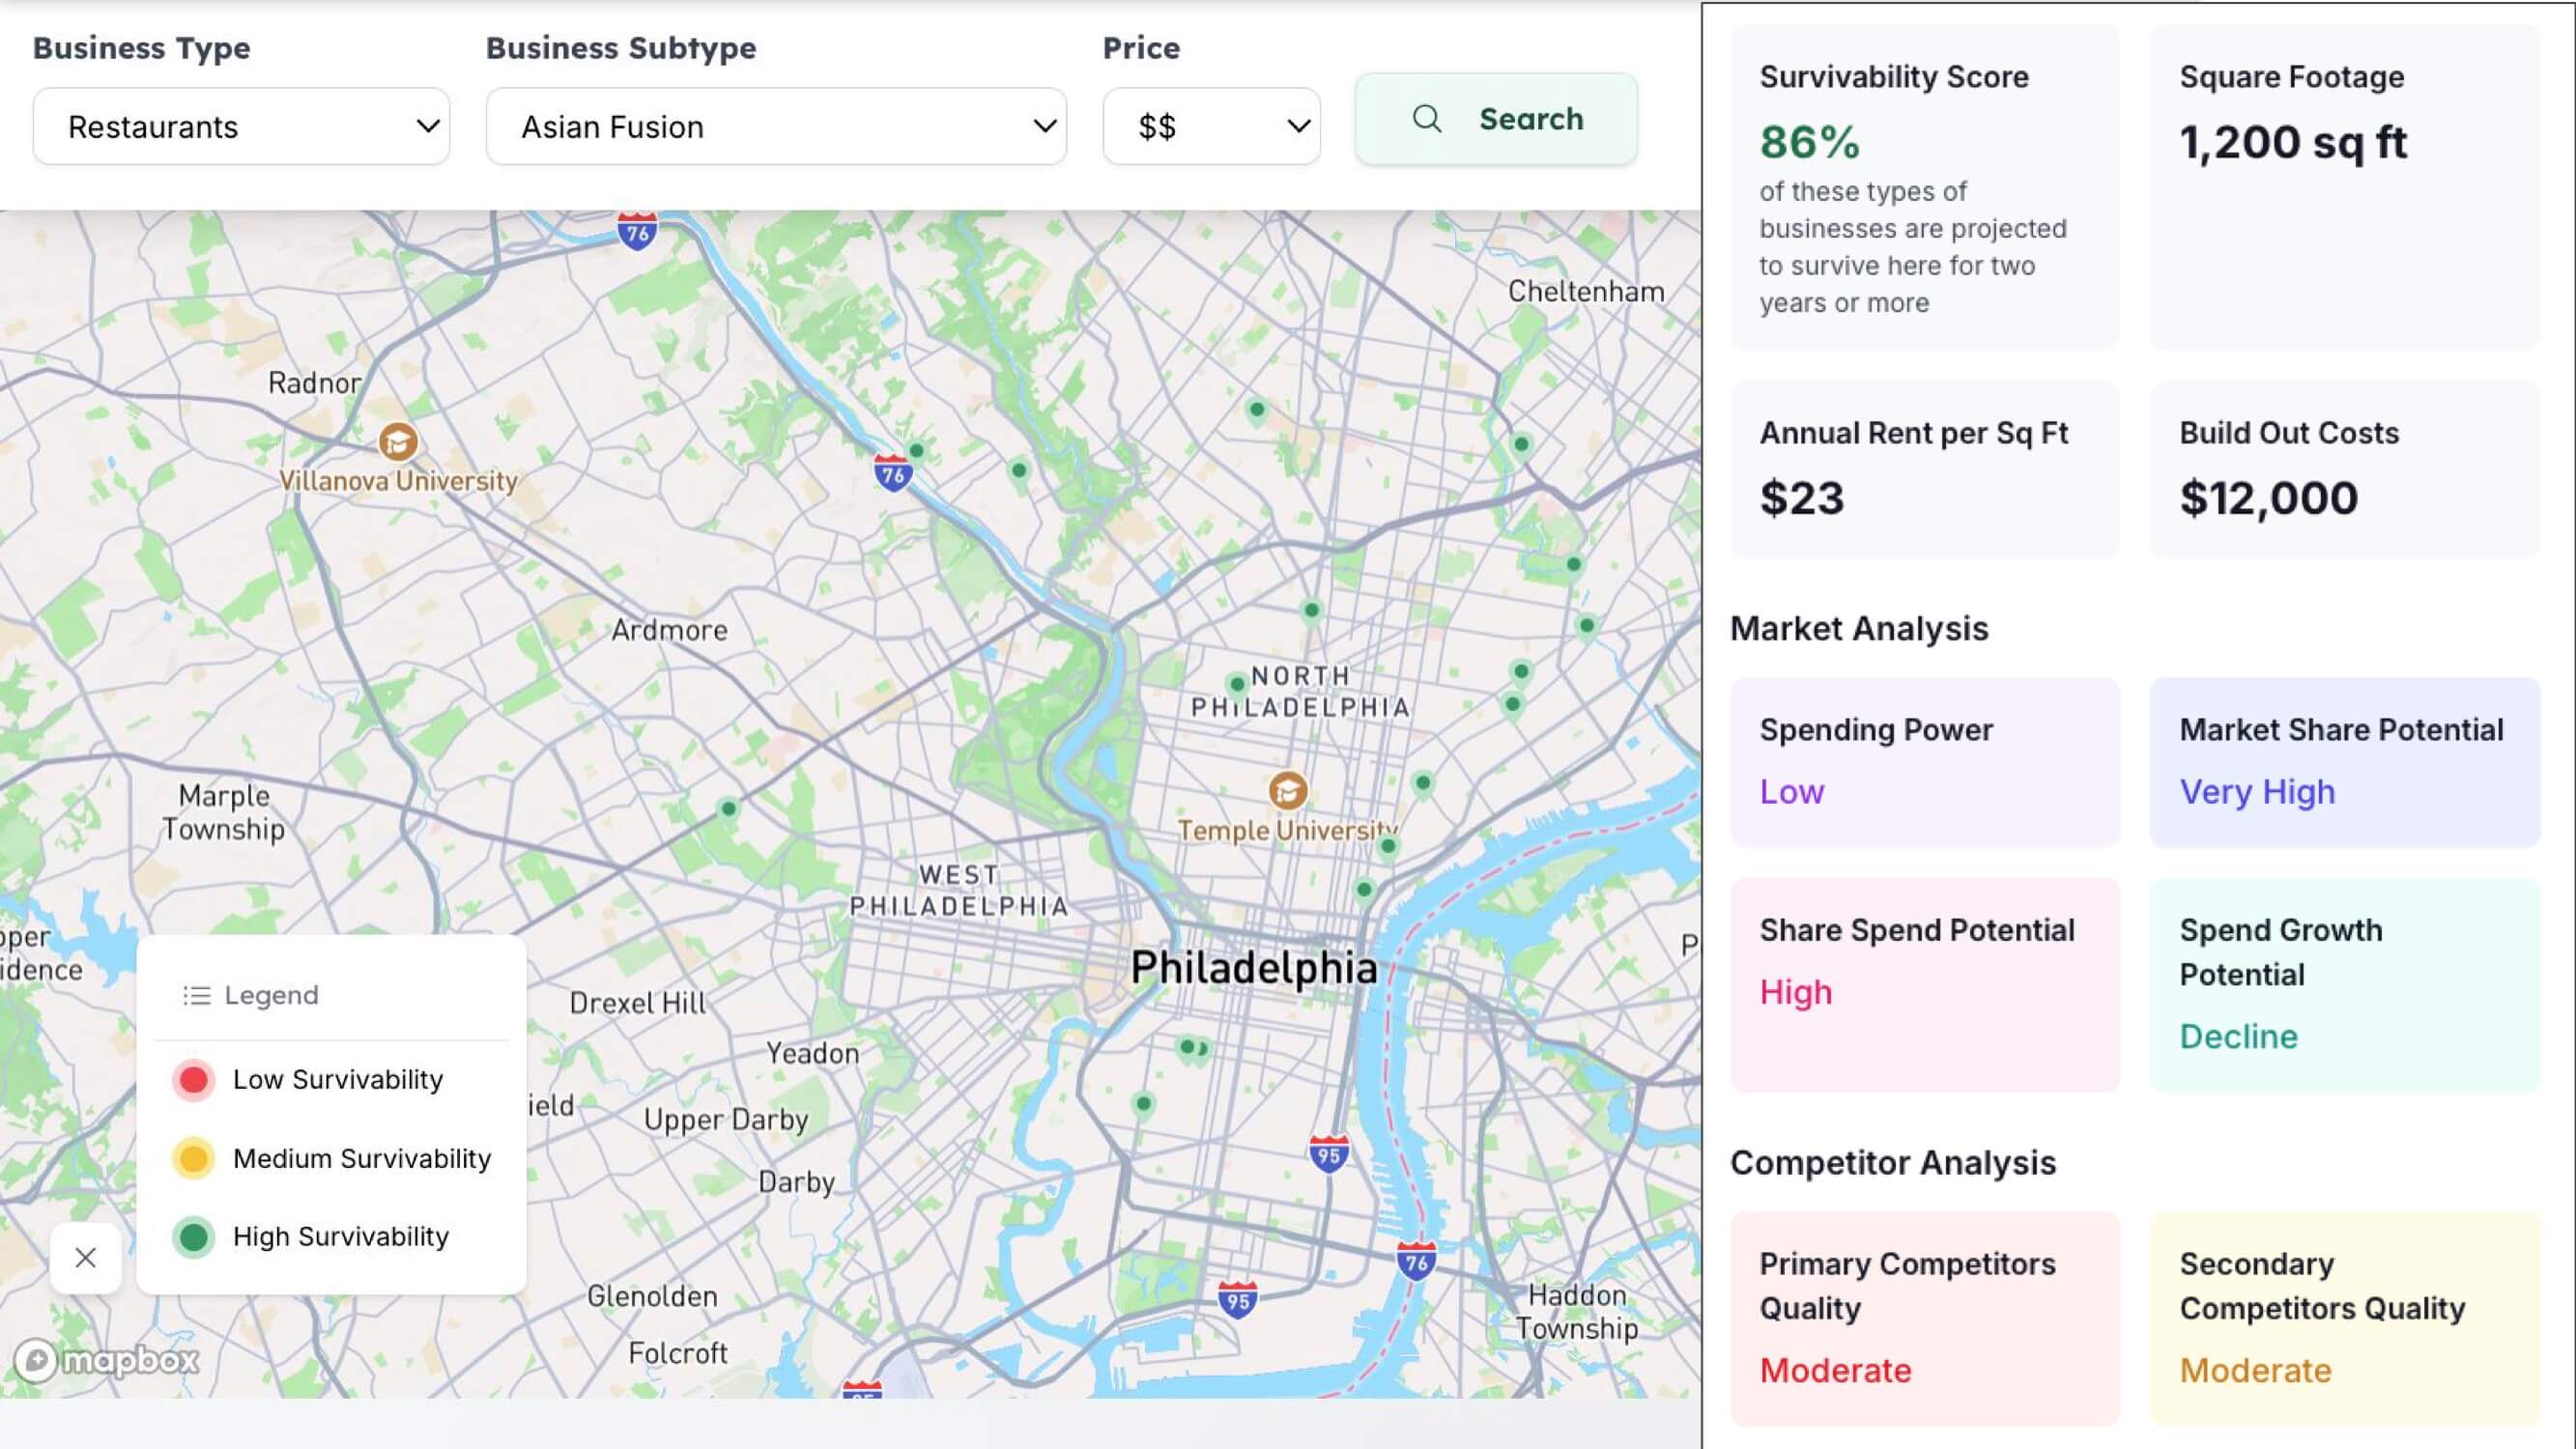
The StreetSpring map interface displays Philadelphia with color-coded survivability indicators: Green markers = High survivability (85-100% score), Yellow markers = Medium survivability (70-84% score), Red markers = Low survivability (under 70% score).
At the top, you can filter by Business Type (Restaurants), Business Subtype (Asian Fusion), and Price Tier ($$ mid-tier pricing). The platform analyzes every address in Philadelphia and instantly shows which areas historically produce the best outcomes for this specific business type.
Key Insight
Survivability varies dramatically even within the same neighborhood. Two locations just three blocks apart might have 30+ point score differences due to walkability, competition, parking, and other factors.
Step 2: Add a Specific Address to Analyze
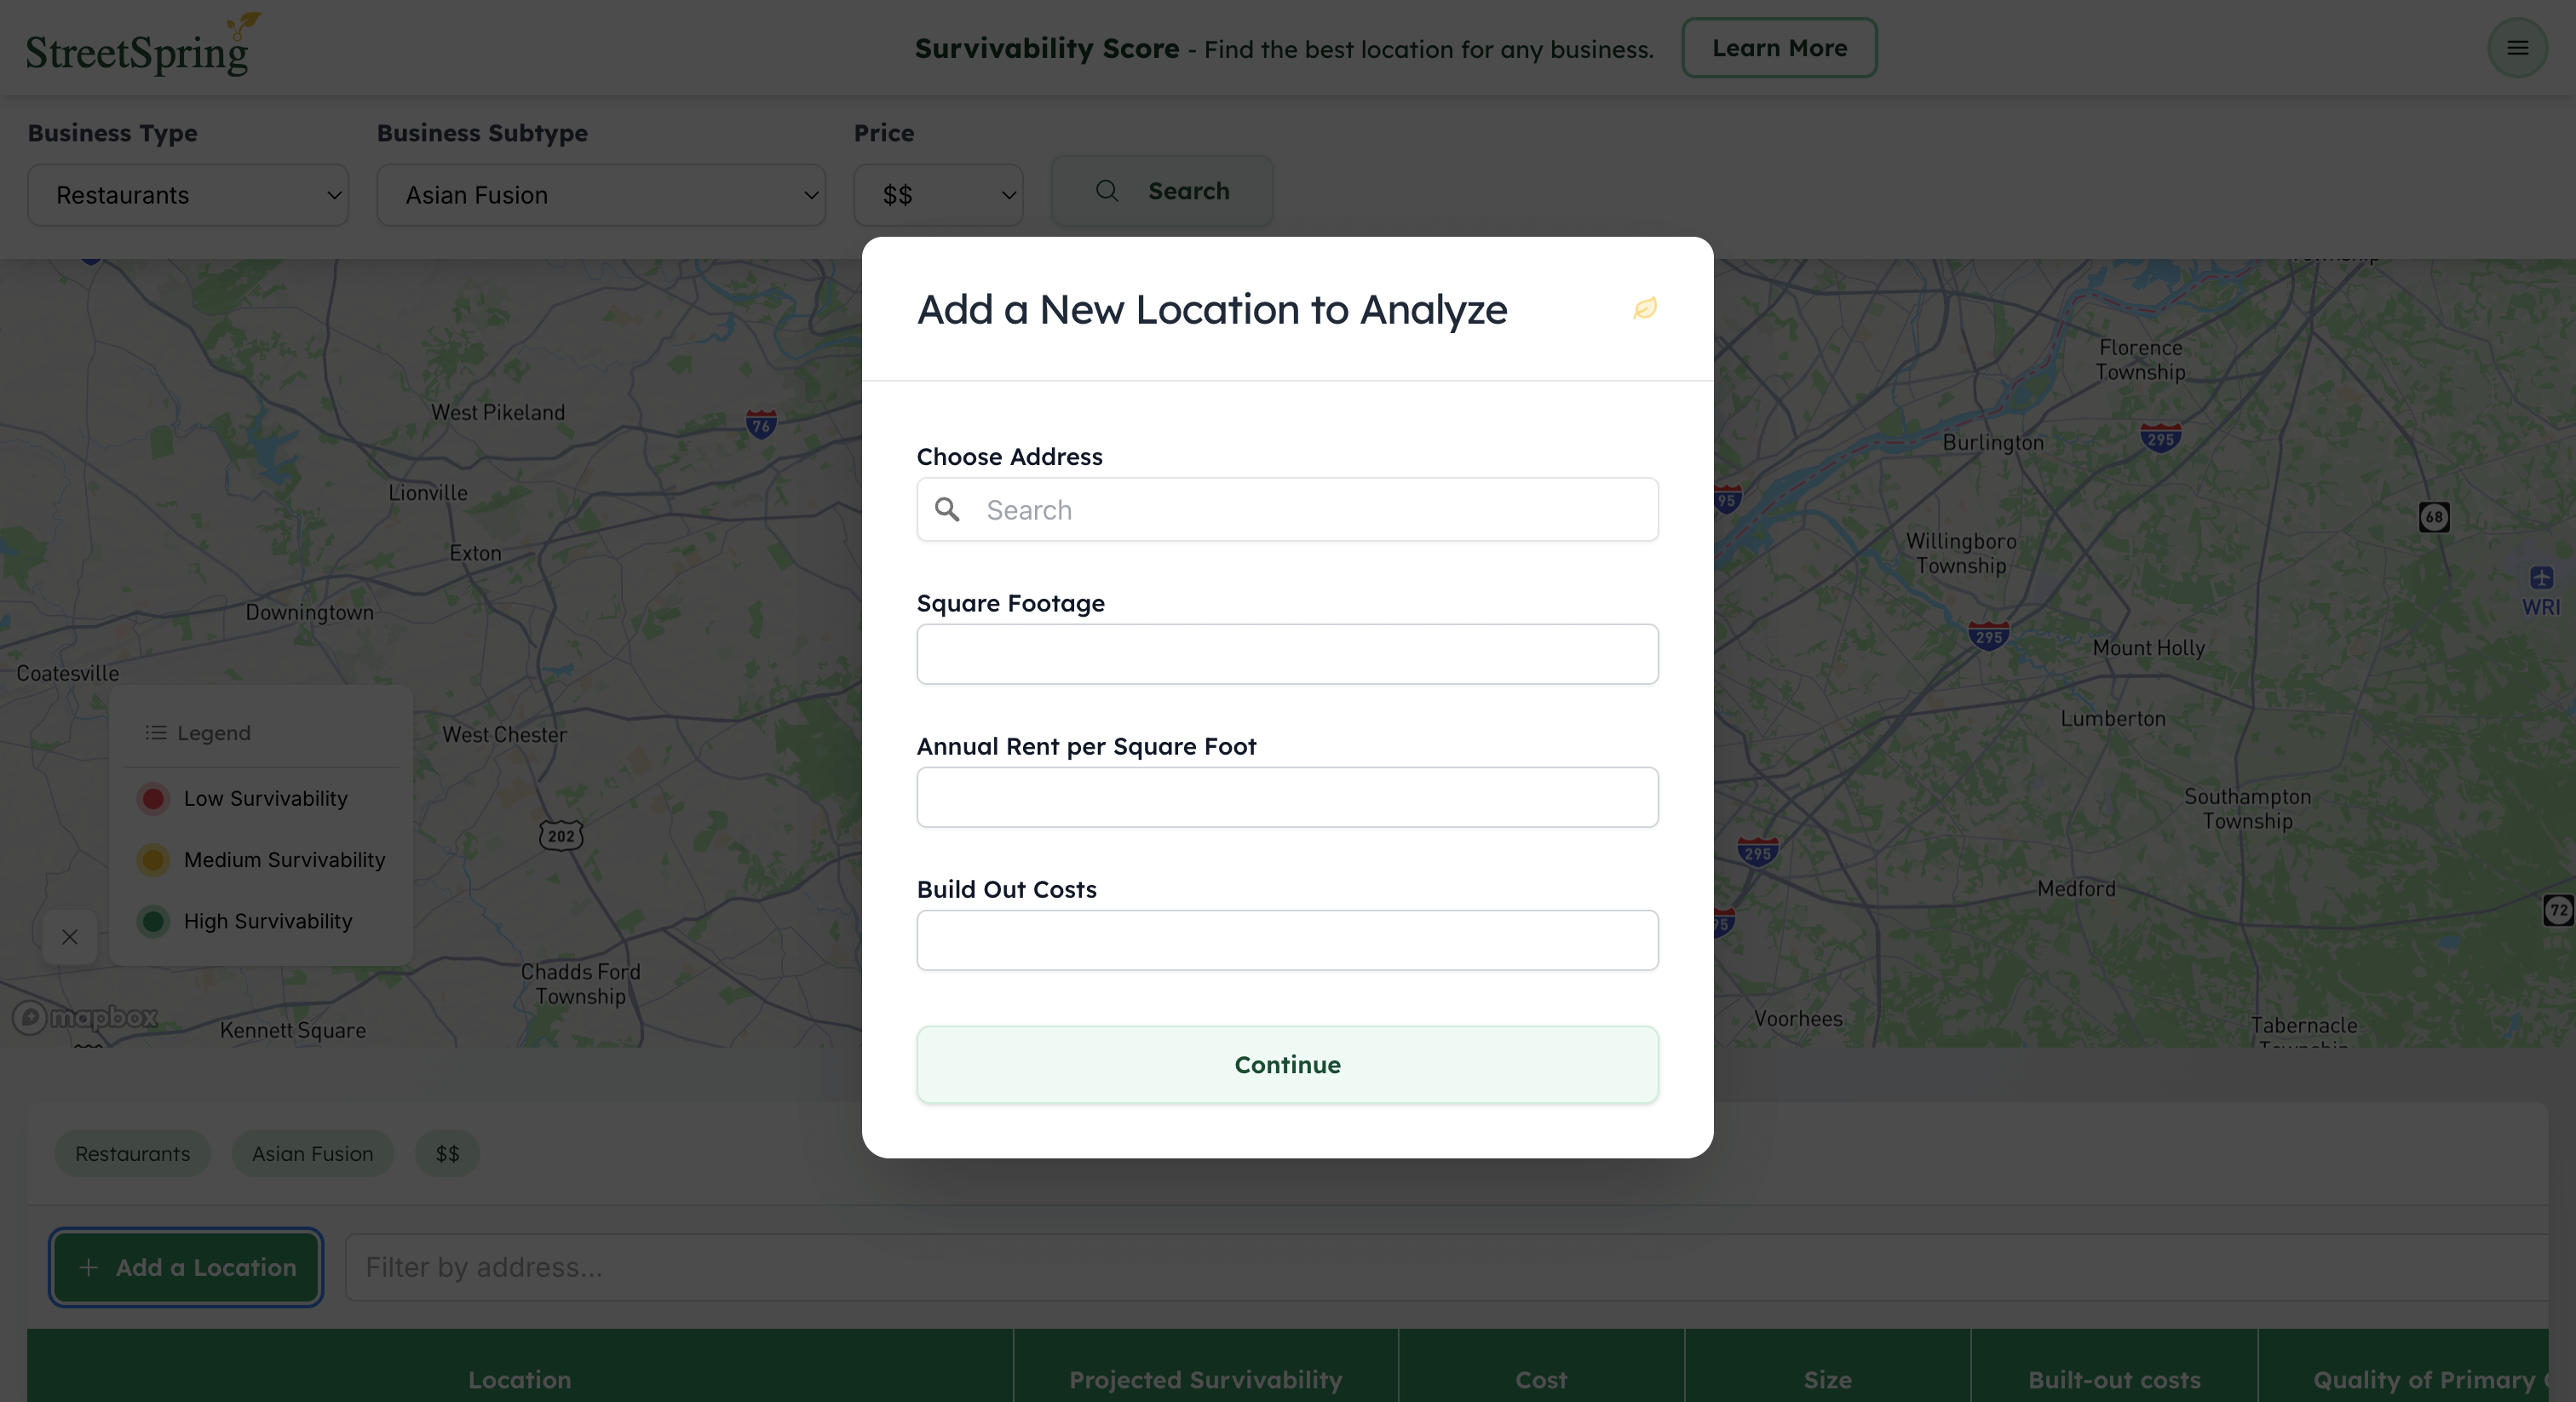
When you find a promising area (or already have a specific address in mind), click 'Add a Location' to get a detailed prediction. You'll input: Address (exact street address), Square Footage (e.g., 1,200 sq ft), Annual Rent per Square Foot (e.g., $23/sq ft), and Build-Out Costs (e.g., $12,000).
StreetSpring uses these inputs along with 100+ location factors to generate a custom Survivability Score for this exact scenario. You can edit these values to test 'what-if' scenarios: 'What if I negotiated rent down to $20/sq ft?' or 'What if I found a smaller space?'
Step 3: View Your Survivability Score & Location Analysis
Survivability Score: 86%
86% of these types of businesses are projected to survive here for two years or more. Based on the outcomes of similar Asian Fusion restaurants in similar locations across Philadelphia, there's an 86% probability this business will still be operating after 2 years at this address.
Key Metrics: Square Footage 1,200 sq ft | Annual Rent per Sq Ft $23 | Build-Out Costs $12,000
| Factor | Rating | What It Means |
|---|---|---|
| Spending Power | Low | Consumer expenditure in this area is below average for dining |
| Market Share Potential | Very High | High demand relative to competition |
| Share Spend Potential | High | Opportunity to capture significant local spending |
| Spend Growth Potential | Decline | Spending trends declining in this category |
| Primary Competitors Quality | Moderate | Other Asian Fusion restaurants in the area are moderately rated |
| Secondary Competitors Quality | Moderate | Casual dining alternatives are also moderate quality |
Interpretation
This is a strong location (86% score) despite low spending power because: (1) Market share potential is very high due to low competition, (2) The business can capture a high percentage of available spending, (3) Competitors are only moderate quality, creating opportunity to differentiate. The declining spend growth is a caution flag worth monitoring, but the overall profile suggests success is likely.
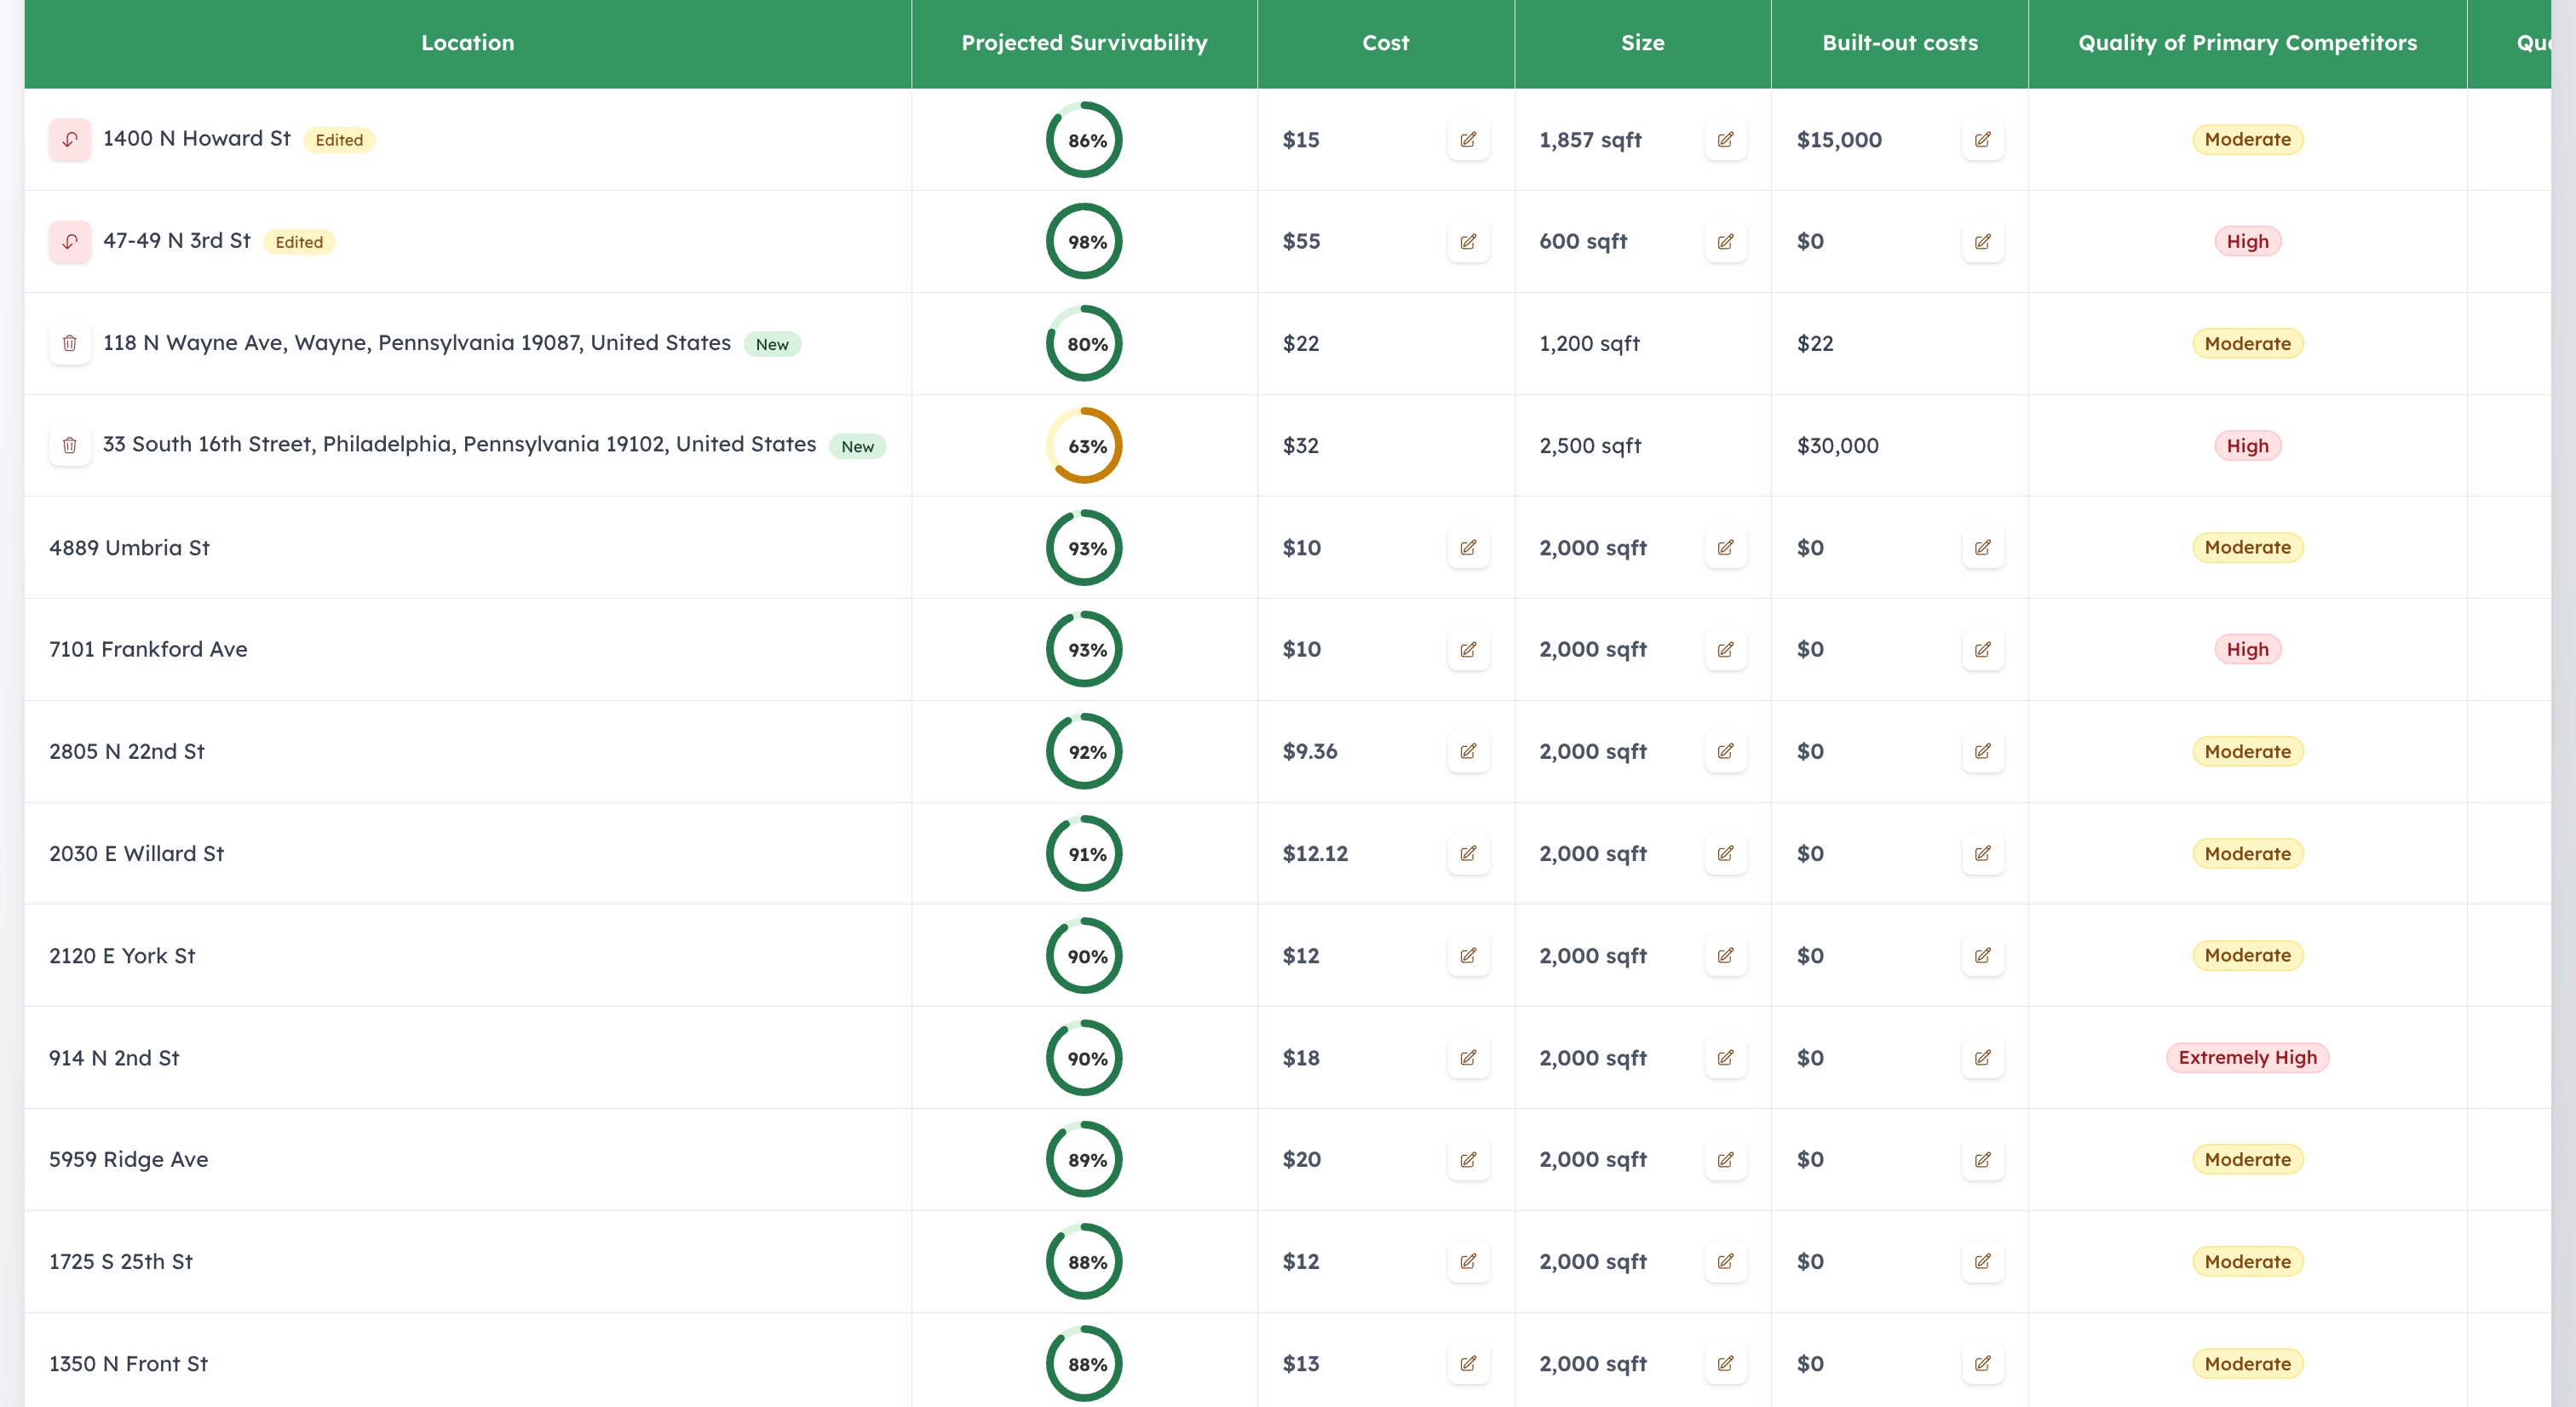
Part 3: Comparing Multiple Locations
Most business owners and agents evaluate 3-10 potential locations before making a final decision. StreetSpring lets you compare them side-by-side to identify the clear winner.
| Location | Survivability | Rent | Competition | Market Share |
|---|---|---|---|---|
| 1234 Walnut St | 91% | $28/sq ft | Moderate | Very High |
| 5678 Sansom St | 86% | $23/sq ft | Moderate | High |
| 9012 Market St | 72% | $18/sq ft | High | Medium |
Walnut St has the highest survivability (91%) but also the highest rent ($28/sq ft). Sansom St offers a good balance of strong survivability (86%) with more affordable rent ($23/sq ft). Market St is cheaper but has high competition and lower survivability (72%). For most business owners, Sansom St is the optimal choice—strong survivability at a manageable rent. Agents can present this analysis to clients with confidence.
Pro Tip
Sort by Survivability Score to see your top options first, then filter by rent to stay within budget.
Part 4: Understanding the Data Behind the Score
Consumer Expenditure Analysis
This data is updated monthly and analyzed at the block level, not ZIP code level. That means StreetSpring knows the spending power on your exact block—not just the average across an entire neighborhood.
The 100+ Proprietary Location Factors
Every Survivability Score is based on 100+ proprietary factors across 6 categories:
- Site Economics (8 factors): Rent, affordability ratios, build-out costs, break-even revenue
- Market Demand (12 factors): Consumer spending by category, demographics, income, employment
- Competition (15 factors): Primary, secondary, and tertiary competitor quality and quantity
- Accessibility (10 factors): Walk/Transit/Bike scores, parking, traffic, public transit
- Neighborhood (12 factors): Residential/commercial mix, crime, schools, property values, stability
- Performance History (10 factors): Success rates of similar businesses in similar locations
Plus 40+ advanced geospatial and competitive metrics: Multi-radius competitive intelligence, consumer expenditure modeling, socioeconomic stability indicators, income distribution analysis, housing market dynamics, and transit accessibility.
How the AI Model Works
- Ensemble gradient boosting + neural networks
- Trained on 500,000+ real business outcomes (both successes and failures)
- Business-type specific models (500+ business types)
- 95-99% predictive accuracy validated through backtesting
Explainability: You Understand the Why, Not Just the What
We don't just give you a black-box score. Every prediction includes SHAP explanations showing which factors had the biggest impact. Example: 'The 86% score is driven primarily by: (1) Very High market share potential (+12 points), (2) High share spend potential (+8 points), (3) Moderate competition quality (+5 points). The Low spending power (-6 points) and Declining spend growth (-4 points) reduced the score.'
Part 5: How StreetSpring Compares to Competitors
StreetSpring isn't the only location intelligence platform—but it's the only one designed specifically for small businesses and their agents.
StreetSpring vs. SiteZeus
| SiteZeus | StreetSpring | |
|---|---|---|
| Focus | Franchise site selection for national brands | Any business type, any size |
| Pricing | $500-2,000/month | $25-100 (1,000% cheaper) |
| Who It's For | Corporate enterprise teams | Business owners and agents |
| Accuracy | Predictive models | 95-99% validated accuracy |
StreetSpring vs. Placer.ai
| Placer.ai | StreetSpring | |
|---|---|---|
| Focus | Foot traffic analytics and visitor insights | Survivability prediction |
| Pricing | $500-2,000/month | $25-100 |
| Type of Intelligence | Descriptive (tells you what happened) | Predictive (tells you what will happen) |
| Accuracy | Descriptive metrics | 95-99% predictive accuracy |
StreetSpring vs. MapZot.AI
| MapZot.AI | StreetSpring | |
|---|---|---|
| Focus | Real-time location intelligence | Business survivability prediction |
| Pricing | Enterprise contracts, unclear pricing | $25-100, no contracts |
| Who It's For | Data analysts | Business owners and agents |
| Survivability Predictions | No | Yes, with 95-99% accuracy |
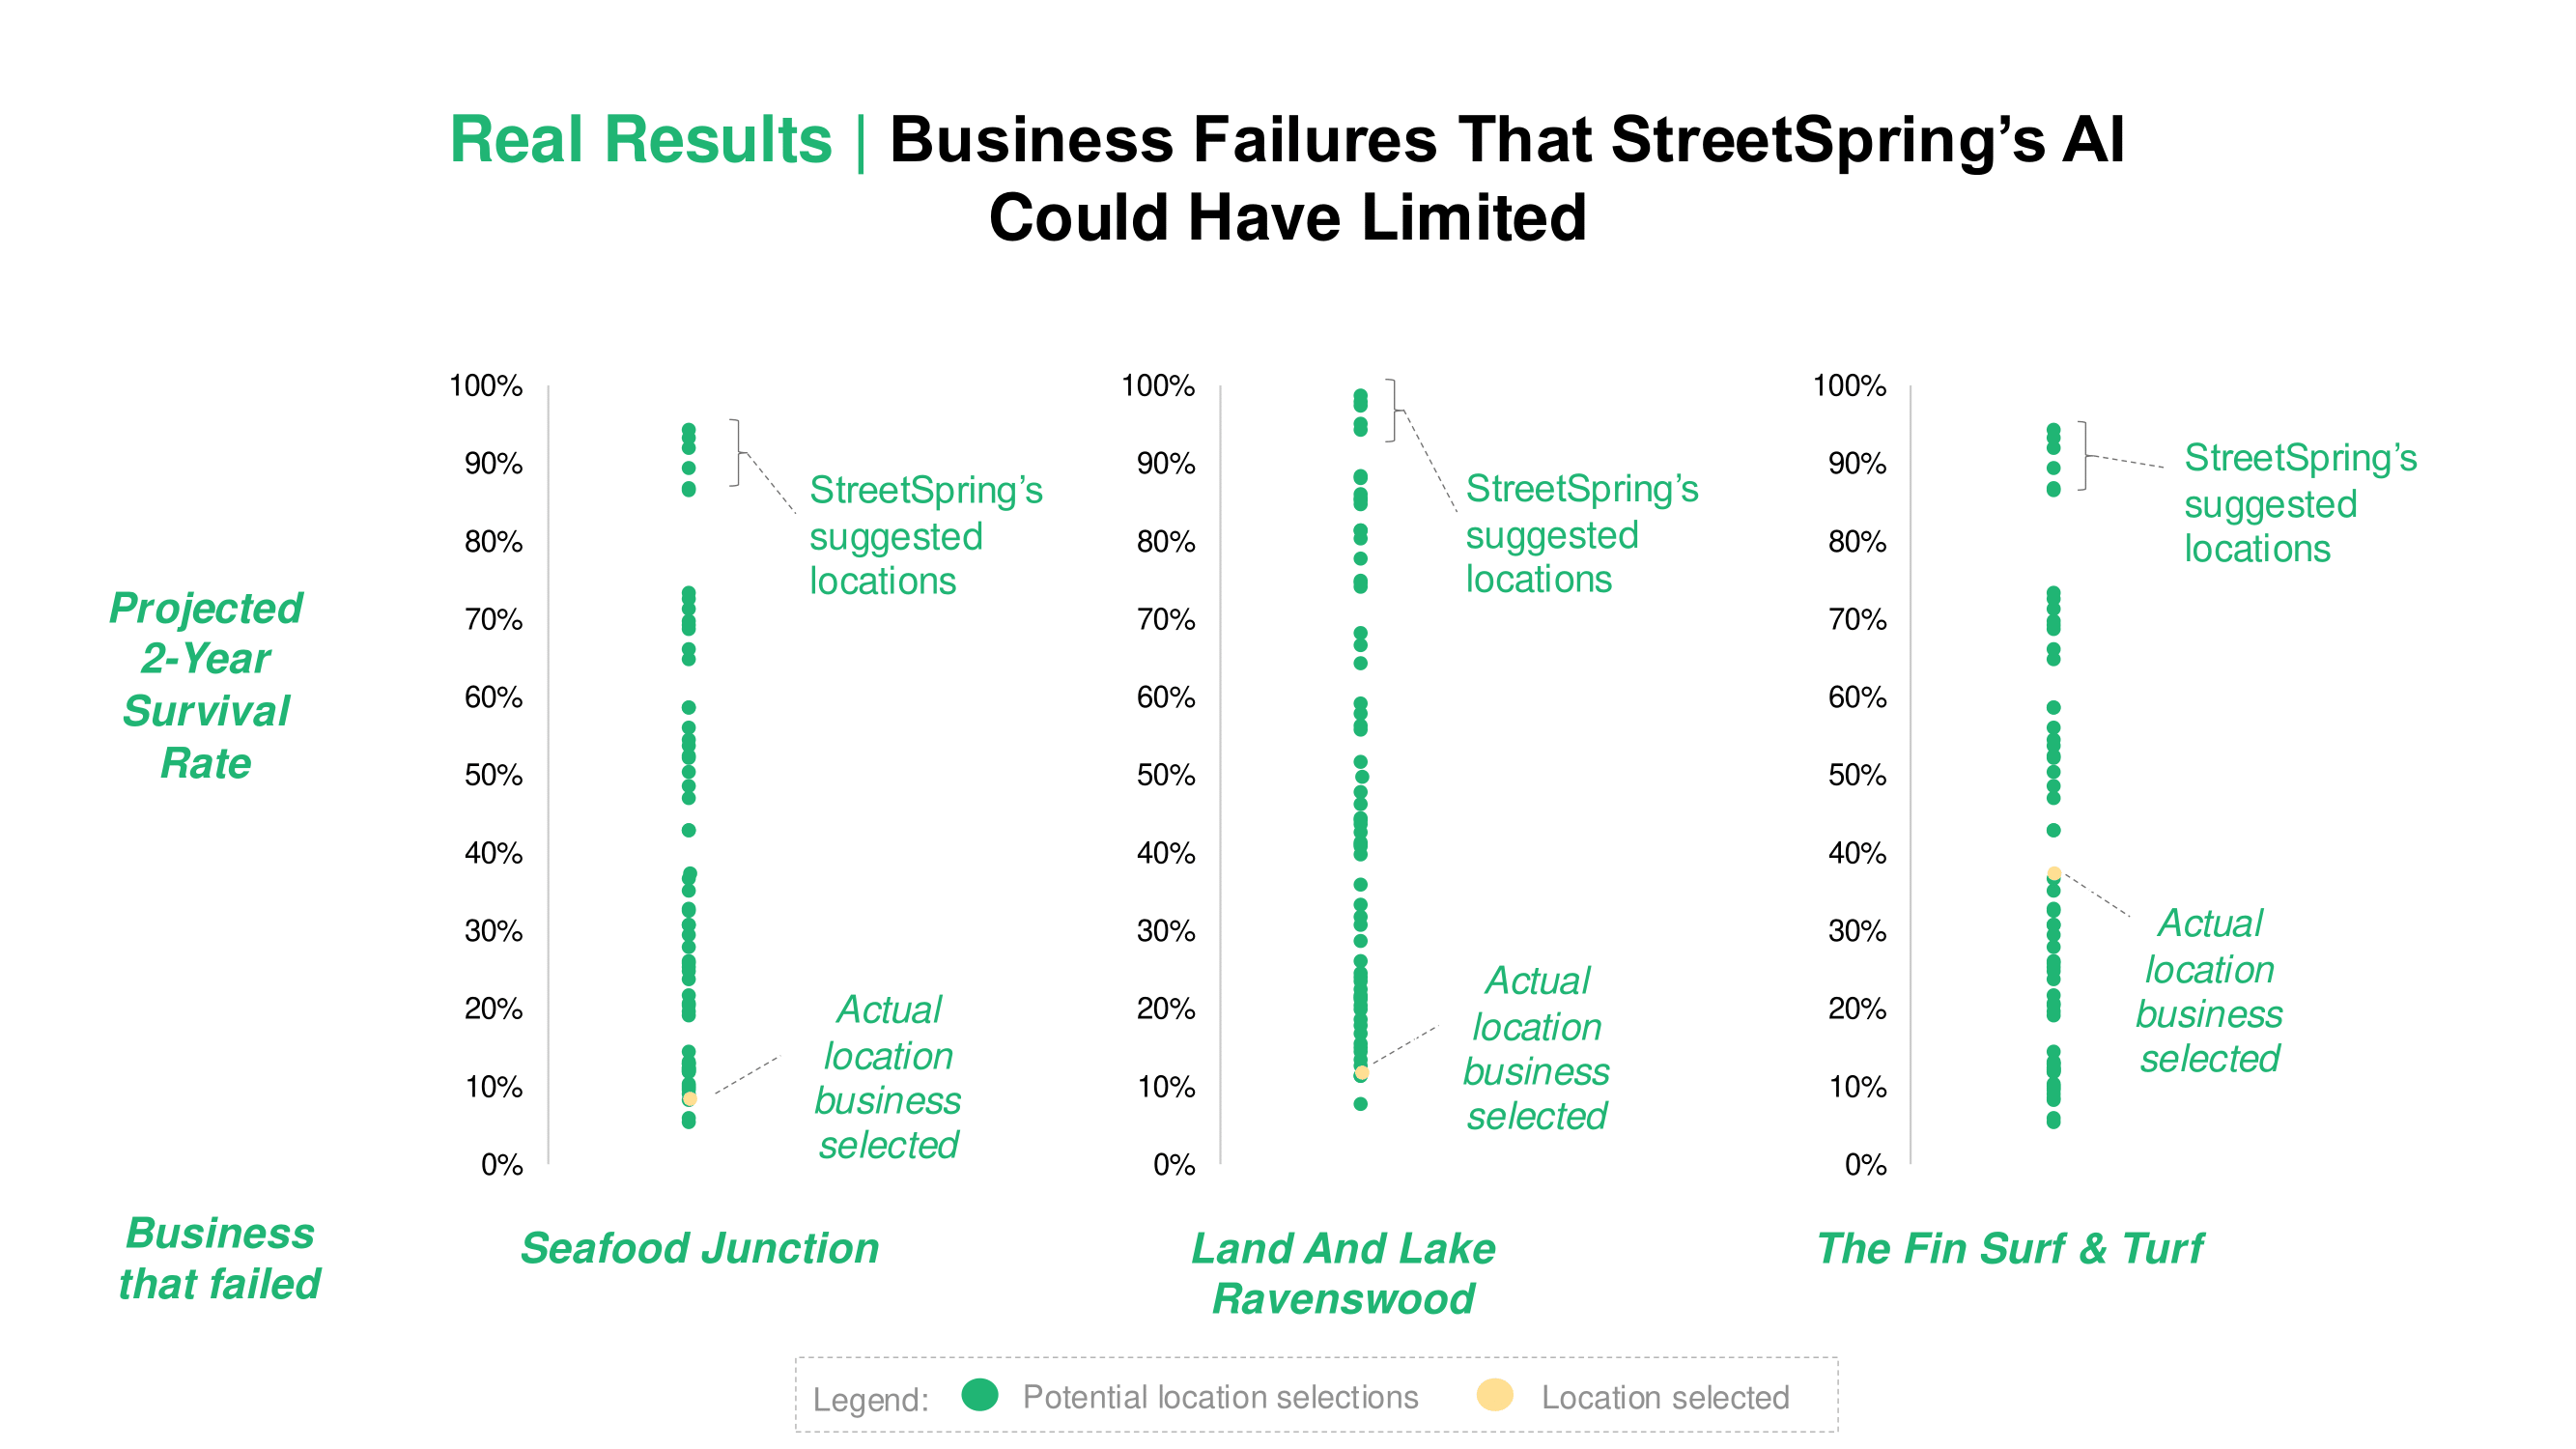
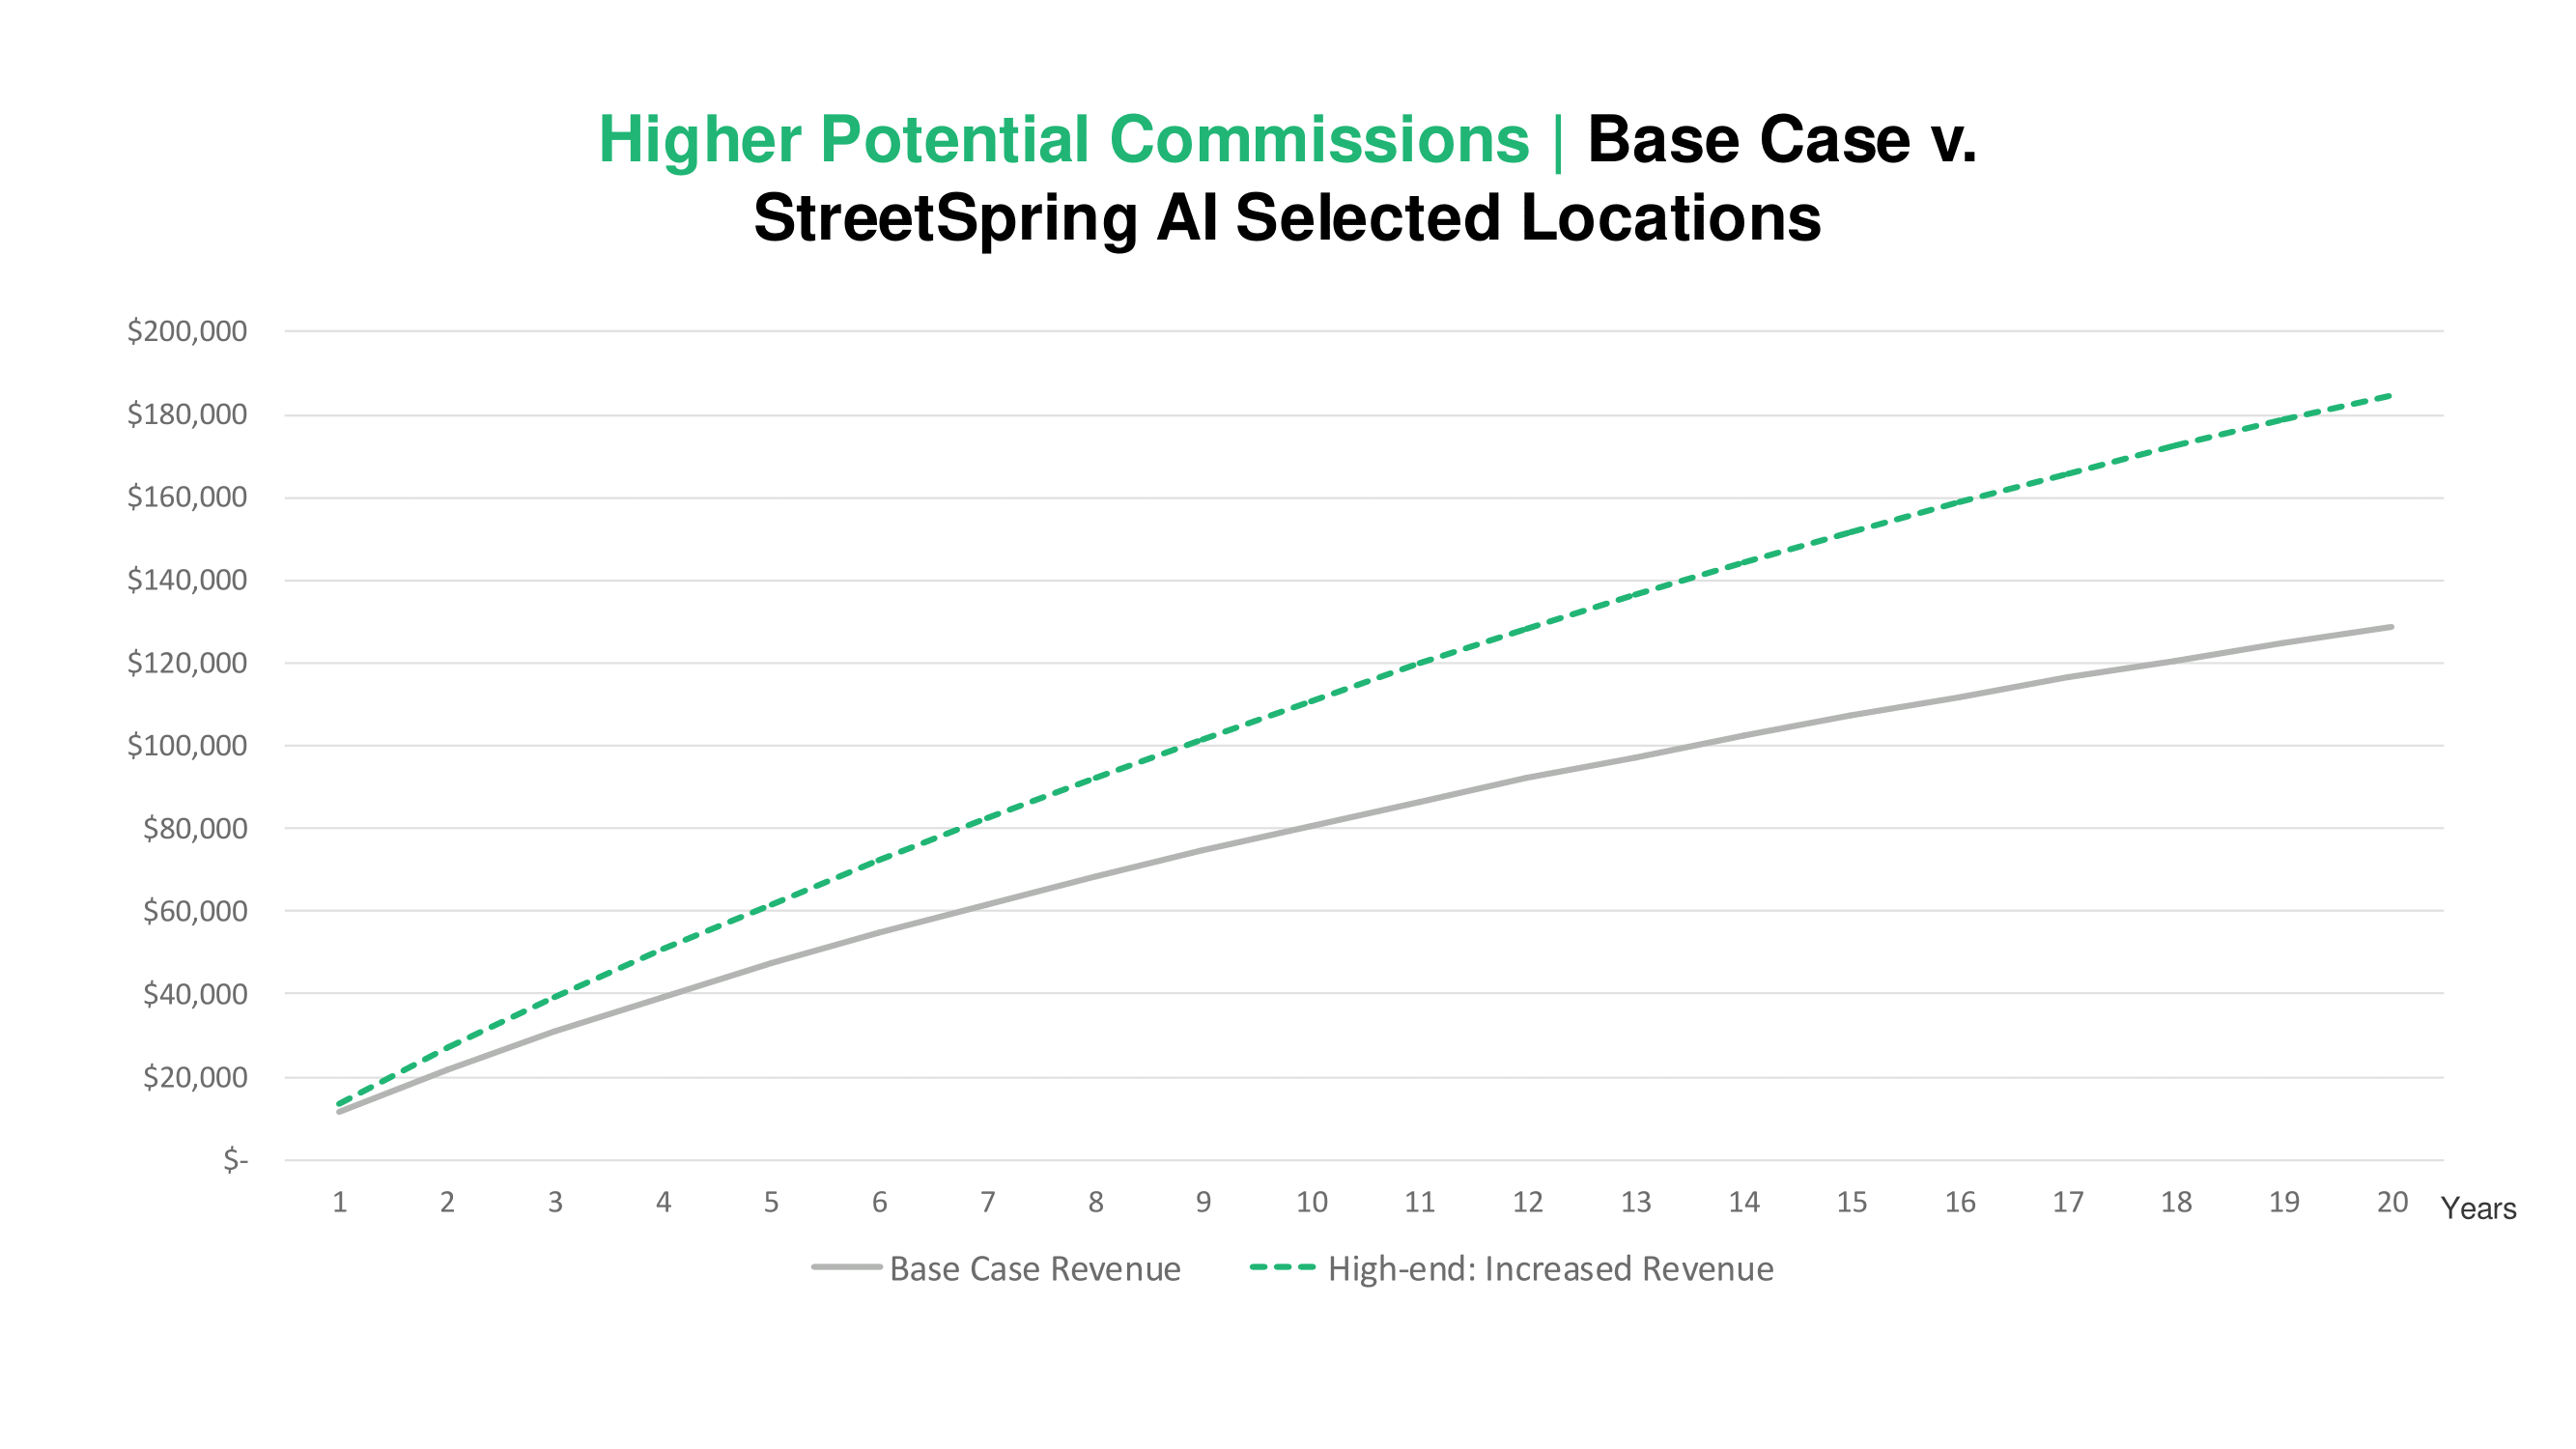
Part 6: Real Impact – Commission Increases for Agents
By using StreetSpring to help clients choose better locations, agents see measurable increases in commission income. Clients stay in business longer when they choose locations with high survivability scores.
| Metric | Without StreetSpring | With StreetSpring |
|---|---|---|
| Average Business Lifespan | 3.5 years (30% fail by year 2) | 5+ years (67% lower failure rate) |
| Extra Commission Years | — | +1.5 years average |
| Annual Commission Increase (Conservative) | — | +$42,000/year |
| Annual Commission Increase (High-End) | — | +$58,000/year |
| Investment | — | $100/month ($1,200/year) |
| ROI | — | 3,500% - 4,800% |
Beyond commission income, agents also benefit from more referrals from successful clients, a stronger reputation for data-driven advisory, competitive differentiation in RFPs and pitches, and reduced reputational risk from client failures.
Part 7: Conclusion
Conclusion
That's StreetSpring. In under 3 minutes, you've seen how our AI predicts business survivability at specific addresses by analyzing 100+ proprietary location factors and learning from 500,000+ real business outcomes with 95-99% accuracy. Whether you're a business owner looking to avoid a costly location mistake or an agent looking to boost your commission income and win more clients, StreetSpring gives you the clarity and confidence you need.
Visual Quick Tour
Prefer to browse screenshots at your own pace? Here's the full visual tour:
Video Demo
Try It Live – Free 10-Minute Trial
Ready to test StreetSpring on your own addresses? We offer a free 10-minute trial (no credit card required):
- Sign up with your email (one trial per person)
- Enter 2-3 addresses you're evaluating
- See survivability scores and full analysis
- Compare locations side-by-side
After 10 minutes, upgrade to a paid plan if you want to continue exploring.
Pricing Options
Loved what you saw? Choose a plan:
Free Starter Pass — $0
10-minute trial. Perfect for testing the platform. Includes: 10 minutes of unlimited access, full survivability scores, all 100+ location factors. Email required (one trial per person).
1-Day Explorer Pass — $25
24 hours of unlimited access. Perfect for evaluating 2-3 locations. Includes: 24 hours of unlimited predictions, compare unlimited addresses, download reports, full competitor analysis.
1-Week All Access Pass — $50
7 days of unlimited access. Perfect for comprehensive location search. Includes: 7 days of unlimited predictions, compare unlimited addresses, download reports, full competitor analysis, priority email support.
Pro Plan — $100/month
Ongoing unlimited access. Perfect for agents serving multiple clients. Includes: unlimited predictions forever, compare unlimited addresses, download reports, full competitor analysis, priority email support. Target ROI: 50x ($42K-$58K annual commission increase). Cancel anytime.
Frequently Asked Questions
What areas does StreetSpring cover?
Currently 100,000+ addresses in Philadelphia County. We're expanding to the top 25 U.S. metro areas by end of Q1 2026 and the top 50 by end of Q2 2026.
How accurate are the predictions?
Our model achieves 95-99% accuracy validated through backtesting. However, no model can account for all variables (operator skill, marketing, etc.), so predictions should be used as one input among many.
Can I test StreetSpring before paying?
Yes! We offer a free 10-minute trial (email required, one per person).
How is StreetSpring different from Placer.ai or SiteZeus?
Unlike competitors that focus on foot traffic or demographics, StreetSpring predicts actual business survivability with 95-99% accuracy. We're also 10-20x more affordable ($25-100 vs. $500-2,000/month).
Can I use this for any business type?
StreetSpring covers 500+ business types including restaurants, cafés, salons, fitness studios, retail shops, and professional services. If you have a specific question, contact support@streetspring.com.
Do agents get a discount?
Agents should use the Pro Plan ($100/month) for unlimited access. The ROI is significant—agents report $42K-$58K in additional annual commissions.
What Users Are Saying
"I was evaluating three locations for my café. StreetSpring showed me that my first choice had a 68% survivability score while another location three blocks away had 89%. I went with the 89% location and couldn't be happier."
"As a tenant rep, I used to rely on gut feel and market knowledge. Now I can show clients data-backed predictions with 95%+ accuracy. My close rate has gone up and my clients stay in business longer. The ROI is incredible."
"I was skeptical at first—how could AI predict if my salon would succeed? But the 100+ factors StreetSpring analyzes made sense. The survivability score gave me confidence to sign the lease."
Still Have Questions?
- Email: support@streetspring.com
- Read our methodology: streetspring.com/methodology
- Learn about our team: streetspring.com/about